
Why this matters: Vacancy rates are on a year-over-year upward incline, while net absorption returns were positive this quarter. New projects were opened to the market but are not yet occupied. A few major tenants are boosting occupancy of distribution space, while smaller businesses are slowly shutting down.
An abundance of caution
The first quarter (Q1) 2026 reports on the Southern California (SoCal) commercial property market are in, courtesy of VOIT Real Estate Services.
SoCal’s commercial market, comprised of San Diego, Orange County, Los Angeles and the Inland Empire, struggles to retain tenants — while brick-and-mortar tenants struggle to put artificial intelligence (AI) to use and remain solvent.
Business closures, layoffs and growing fuel prices have left business owners and consumers cautious — more ripple effects for our undeclared real estate recession.
The office vacancy rate is averaging around 13% in San Diego and Orange County. The office sector has been struggling since the pandemic-era remote work revolution. As a further decoupling from space needs, efficiency of workflow by all businesses integrating AI technologies as an assistant is certain to significantly disrupt this sector.
San Diego is the only SoCal region where retail trends are measured. Retail vacancy rates average around 5% in San Diego. Languishing retail space with inadequate traffic counts will be put to better uses, much like office space undergoing residential conversions.
All SoCal regions have industrial market data available. All regions are on an increasing vacancy and availability trend year-over-year. However, all regions experienced positive net absorption for the first quarter, meaning more industrial space became occupied during the first quarter. The net absorption increase in Q1 2026 was accompanied with increased vacancy levels due to more construction placed on the market without sufficient tenant growth to occupy the premises. Big warehouse operators like Amazon are increasing net absorption rates for the moment, overshadowing additional availability due to closures of small businesses.
Read on to get a deeper understanding of the market forces at work quarter-over-quarter and year-over-year for the SoCal commercial market.
San Diego County — industrial, office and retail
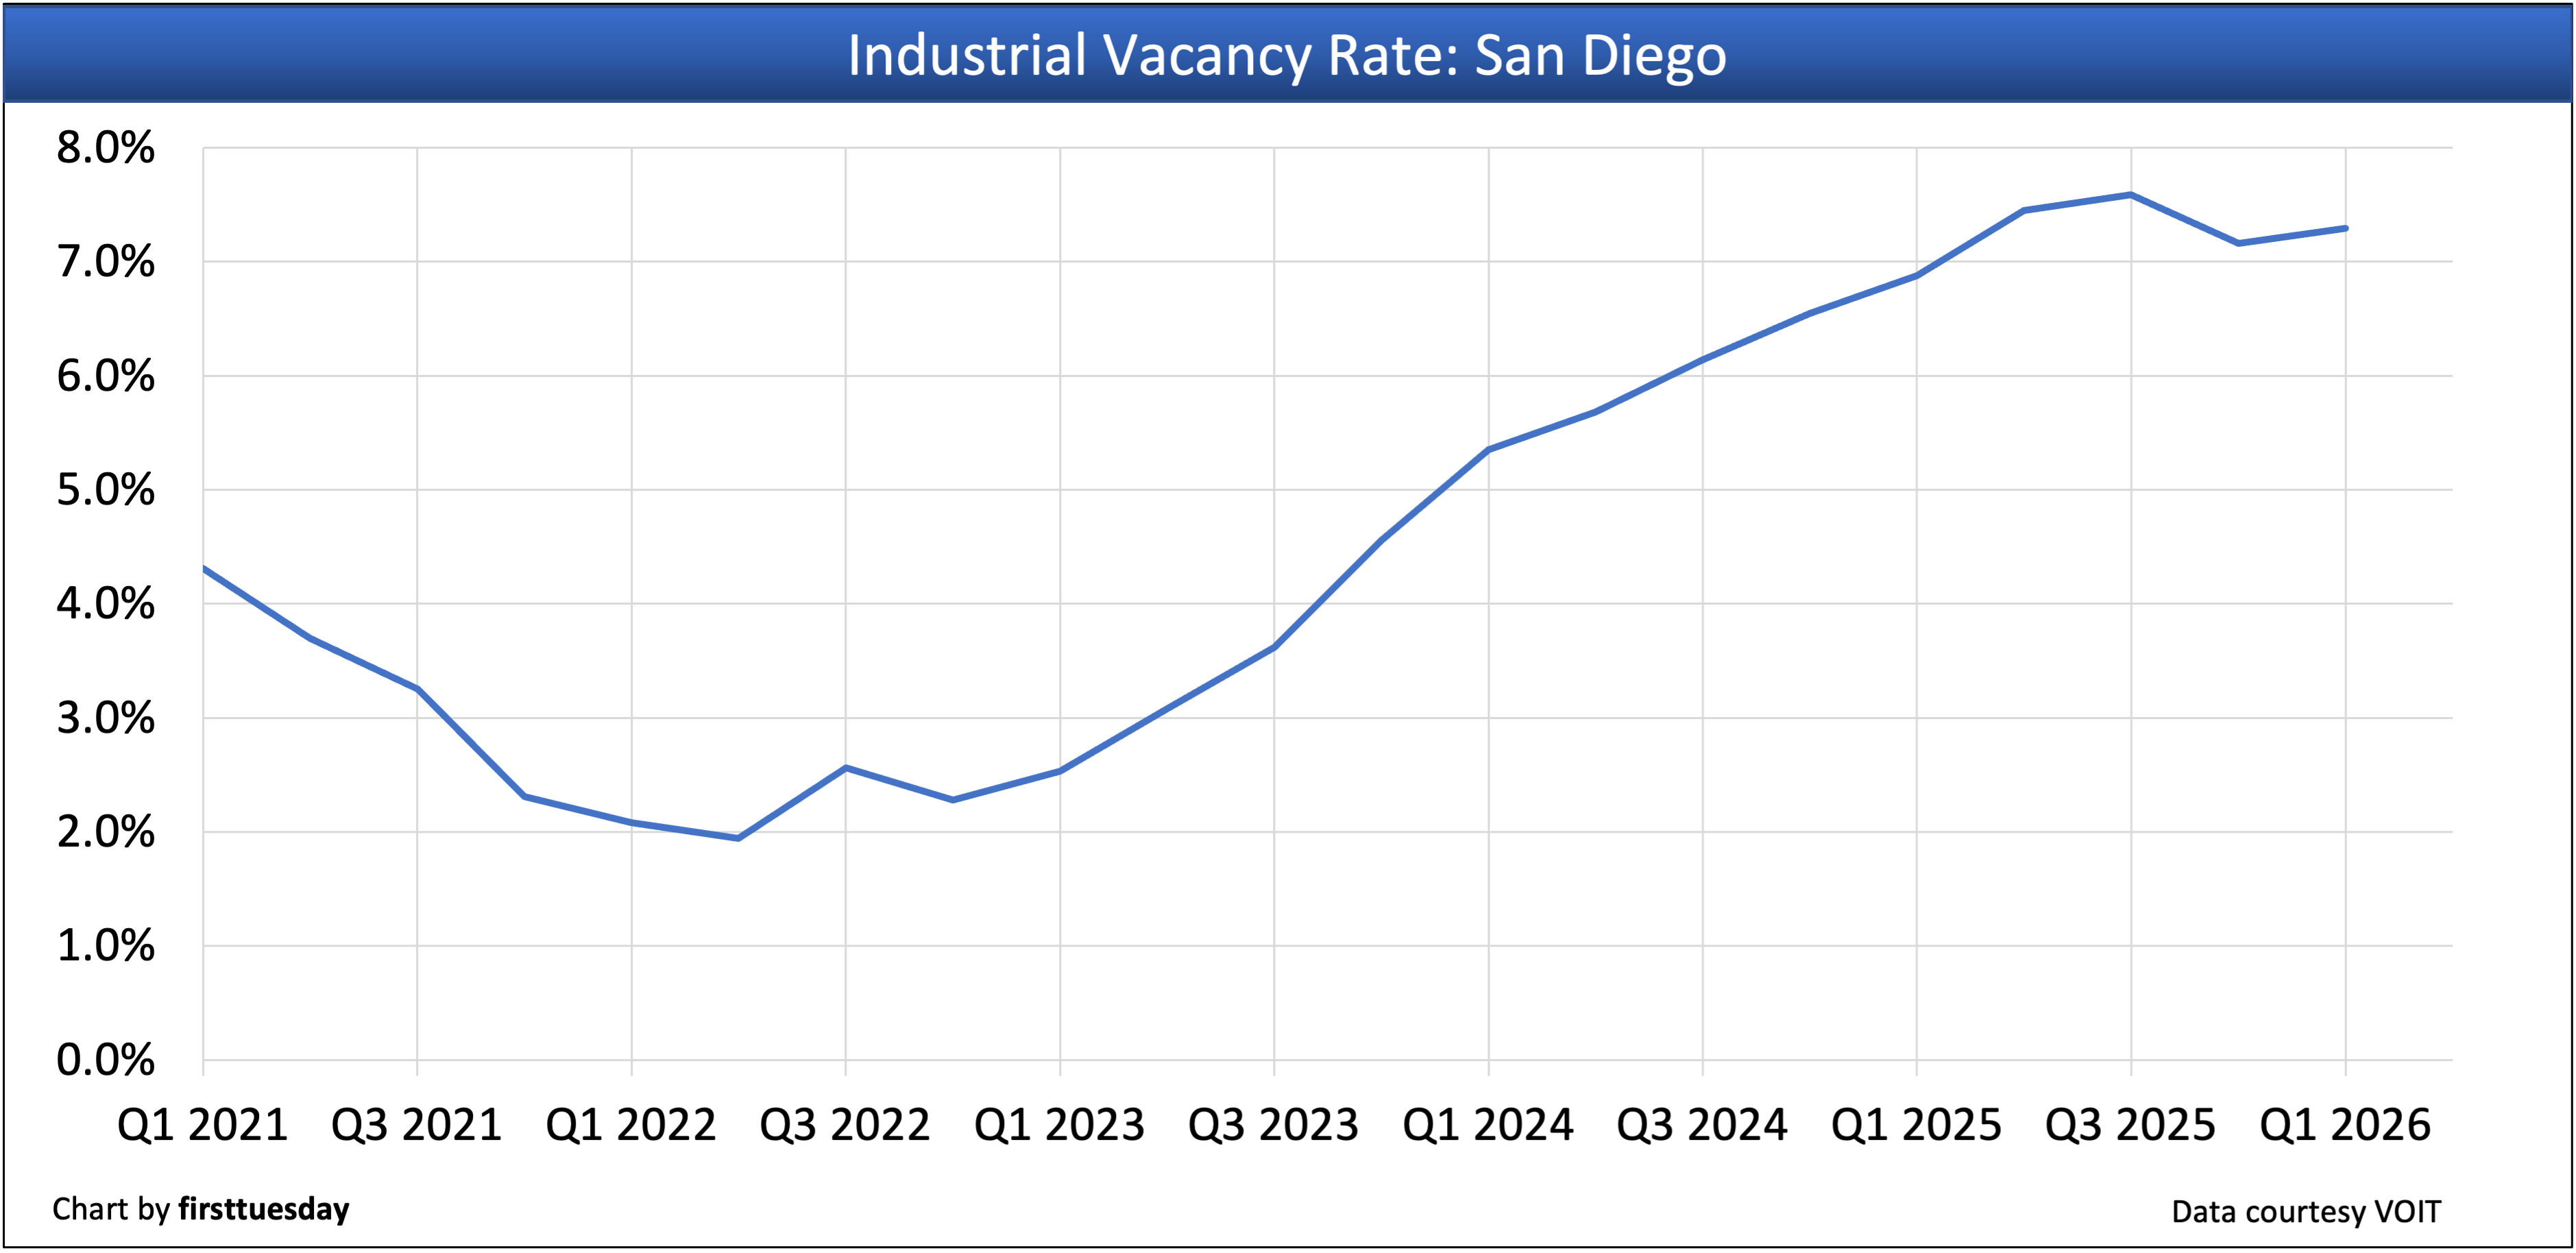
San Diego County’s industrial vacancy rate is:
- 7.29% in Q1 2026;
- up from 7.12% in Q4 2025; and
- up from 6.69% in Q1 2025.
Conclusion: San Diego’s industrial availability rate is the highest it’s been since Q1 2014. So long as global turmoil keeps interfering with supply chains, expect the upward trend to continue.
San Diego County’s industrial net absorption — the total change in occupied industrial space during the quarter — is:
- +863,148 square feet in Q1 2026;
- up from +369,241 square feet in Q4 2025; and
- up from -239,091 square feet in Q1 2025.
Conclusion: After three consecutive years of San Diego experiencing negative net absorption, starting the first quarter of 2026 with increasing positive net absorption is a welcome trend. However, there’s a caveat. One Amazon warehouse added to the inventory on its completion and led to the positive uptick — without it, the quarter would have been negative.
San Diego County’s office vacancy rate is:
- 13.61% in Q1 2026;
- flat from 13.63% in Q4 2025; and
- up from 12.98% in Q1 2025.
Conclusion: Vacancies are holding steady quarter-over-quarter but moved up year-over-year. The vacancy rate for Downtown San Diego is at an elevated 34%. With such high inner-city vacancy rates in office buildings, expect to see more office-to-residential conversions.
San Diego County’s office net absorption rate — the total change in occupied office space during the quarter — is:
- +87,658 square feet in Q1 2026;
- higher than -77,453 square feet in Q4 2025; and
- down from +288,603 square feet in Q1 2025.
Conclusion: The trend over the past three years is that tenants are using less office space. Class A suites consistently perform best.
San Diego County’s retail vacancy rate is:
- 4.65% in Q1 2026;
- up from 4.51% in Q4 2025; and
- up from 4.19% in Q1 2025.
Conclusion: Store closures pushed the vacancy rate up. Obsolete retail space is being redeveloped for higher and better uses.
San Diego County’s retail net absorption rate — the total change in occupied retail space during the quarter — is:
- -187,877 square feet in Q1 2026;
- down from +36,080 square feet in Q4 2025; and
- improving from -331,938 square feet in Q1 2025.
Conclusion: Thousands of stores across the U.S. are projected to close this year. Retail stores continue to struggle with seemingly irreversible headwinds from consumer shopping online with same day delivery.
Orange County — industrial and office
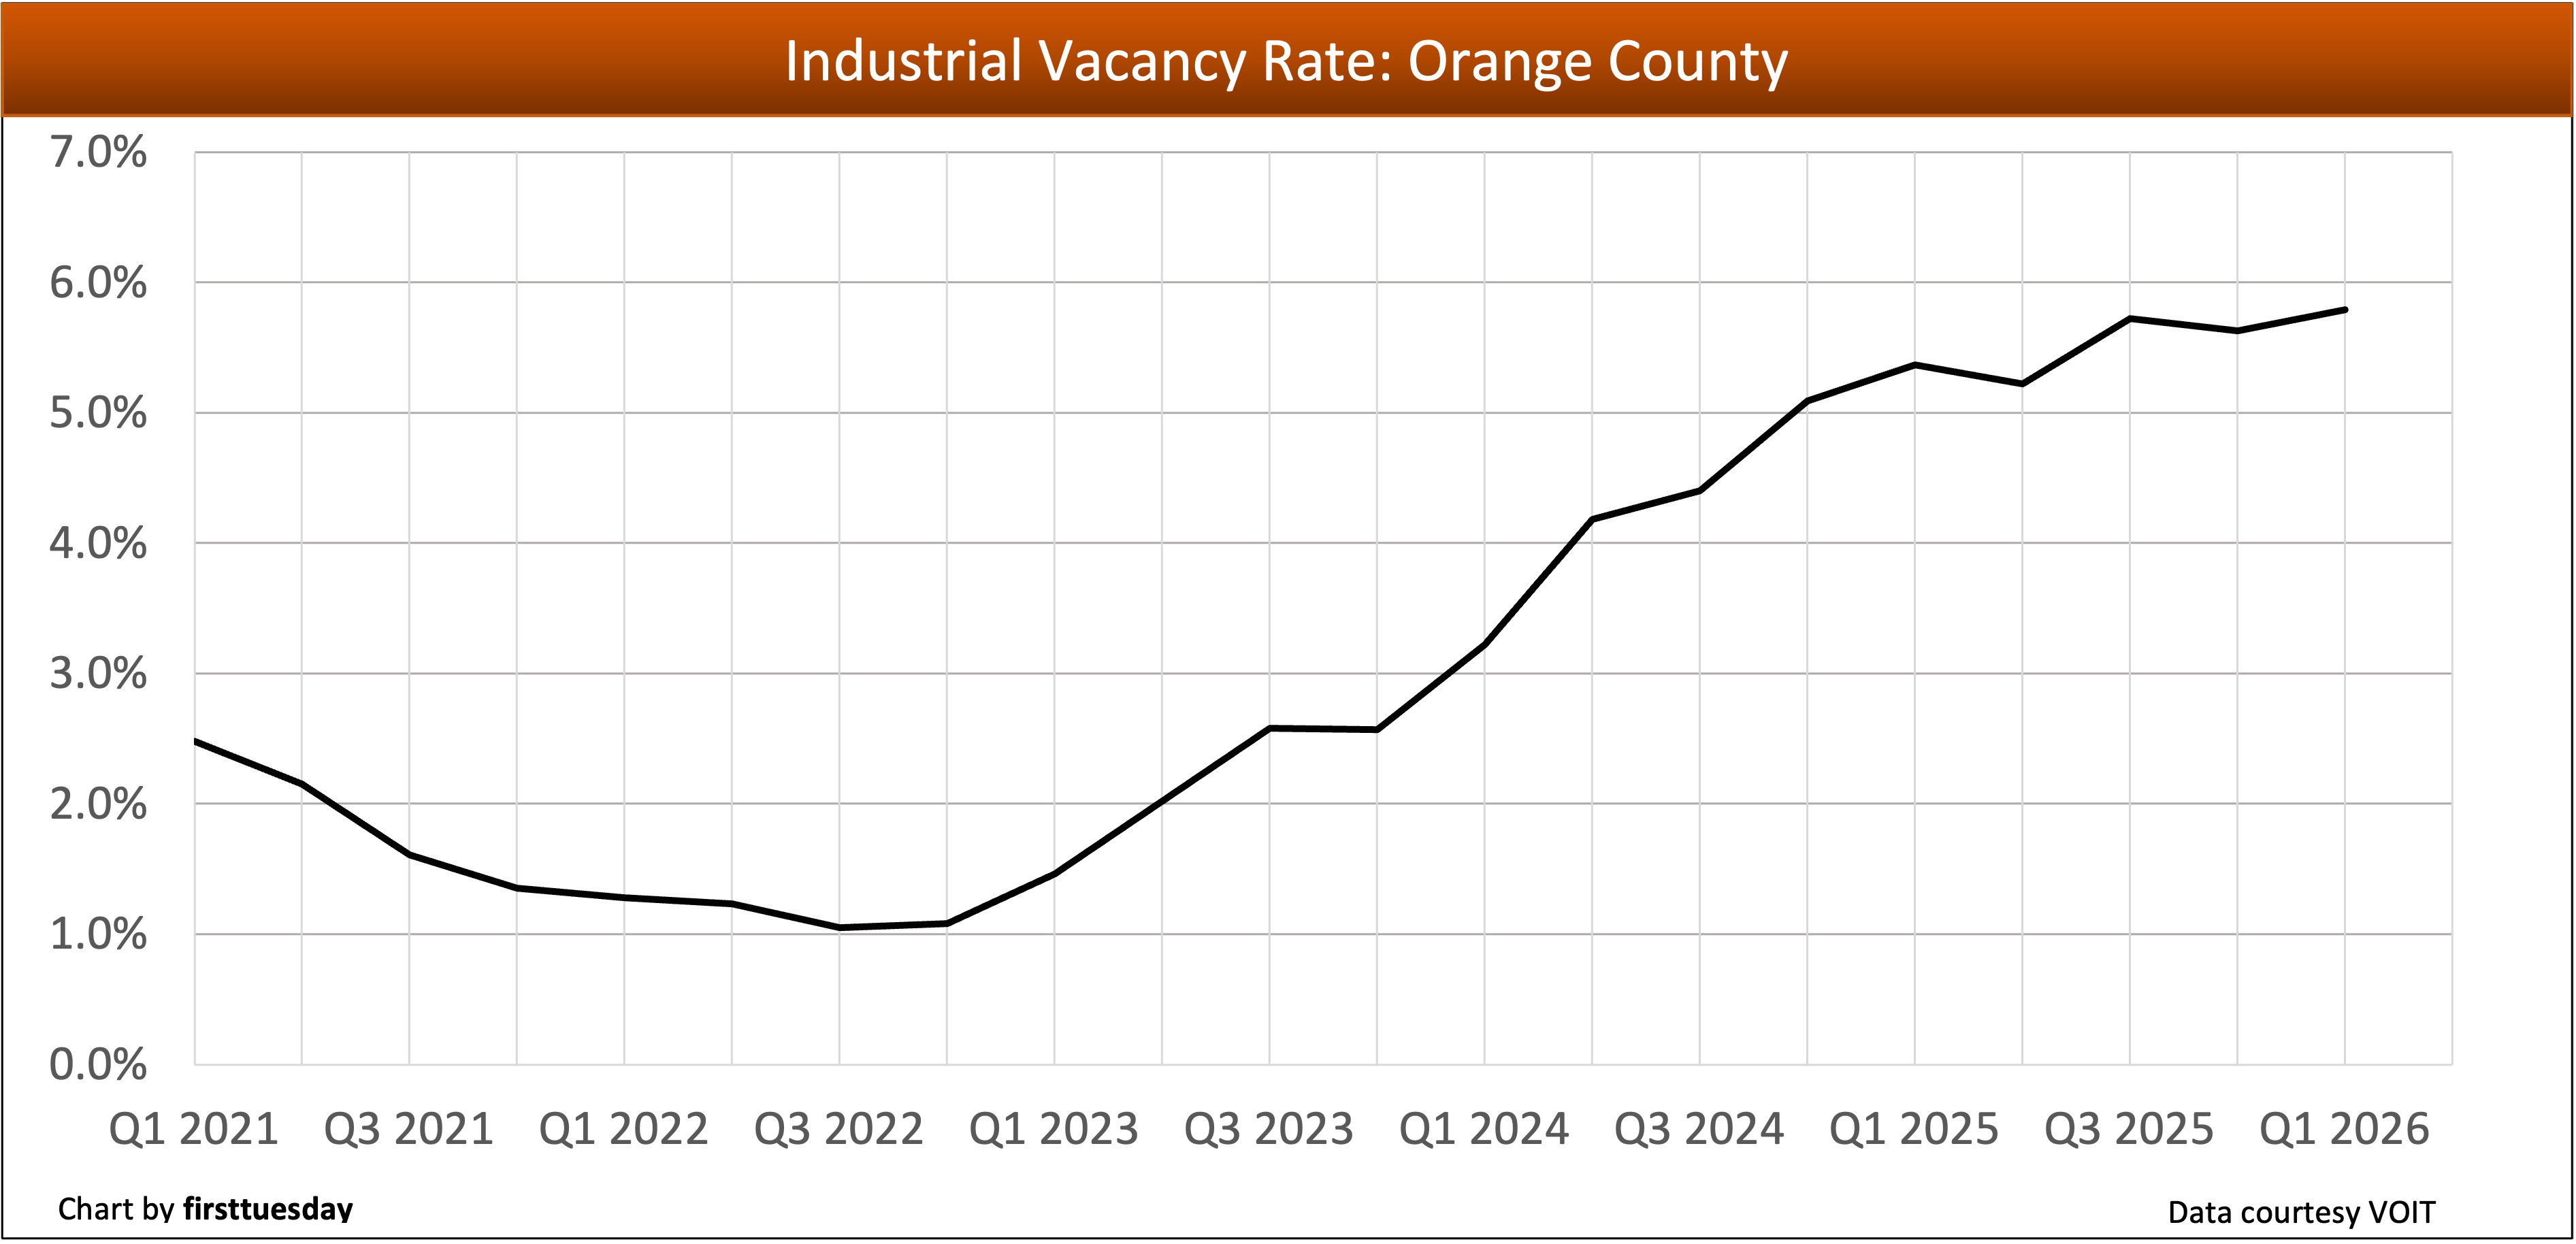
Orange County’s industrial vacancy rate is:
- 5.79% in Q1 2026;
- up from 5.63% in Q4 2025; and
- up from 5.31% in Q1 2025.
Conclusion: Orange County’s industrial vacancy rate has increased from the record lows experienced in the immediate post-pandemic year and is now steadily climbing. It is now at the highest point in years.
Orange County’s industrial net absorption rate is:
- +531,781 square feet in Q1 2026;
- up from +286,194 square feet in Q4 2025; and
- up from -272,207 square feet in Q1 2025.
Conclusion: Orange County industrial experienced two consecutive quarters of positive net absorption. Vacancy rates are up due to new construction available for lease as unoccupied while net absorption, while up, did not match the space released into inventory.
Orange County’s office vacancy rate is:
- 13.52% in Q1 2026;
- down from 14.55% in Q4 2025; and
- down from 15.48% in Q1 2025.
Conclusion: Orange County office vacancy rates are settling from their peak at 17.27% in Q4 2023, but are well above pre-pandemic rates, such as 11.80% in Q4 2019 with an economy-wide recession — not just a real estate recession now being experienced — on the horizon. The culprit is the consequences of the tariff and military wars underway, and the shrinking of the labor force as men and immigrants drop out.
Orange County’s office net absorption rate is:
- +292,601 square feet in Q1 2026;
- down from +597,932 square feet in Q4 2025; and
- up from -333,333 square feet in Q1 2025.
Conclusion: Q1 2026 marked the third consecutive quarter of positive net absorption. Developments in AI will eventually decrease demand for space in the already hurting office sector as AI is an office assistant that requires no space and is likely to reduce all types and levels of employment.
Los Angeles County — industrial
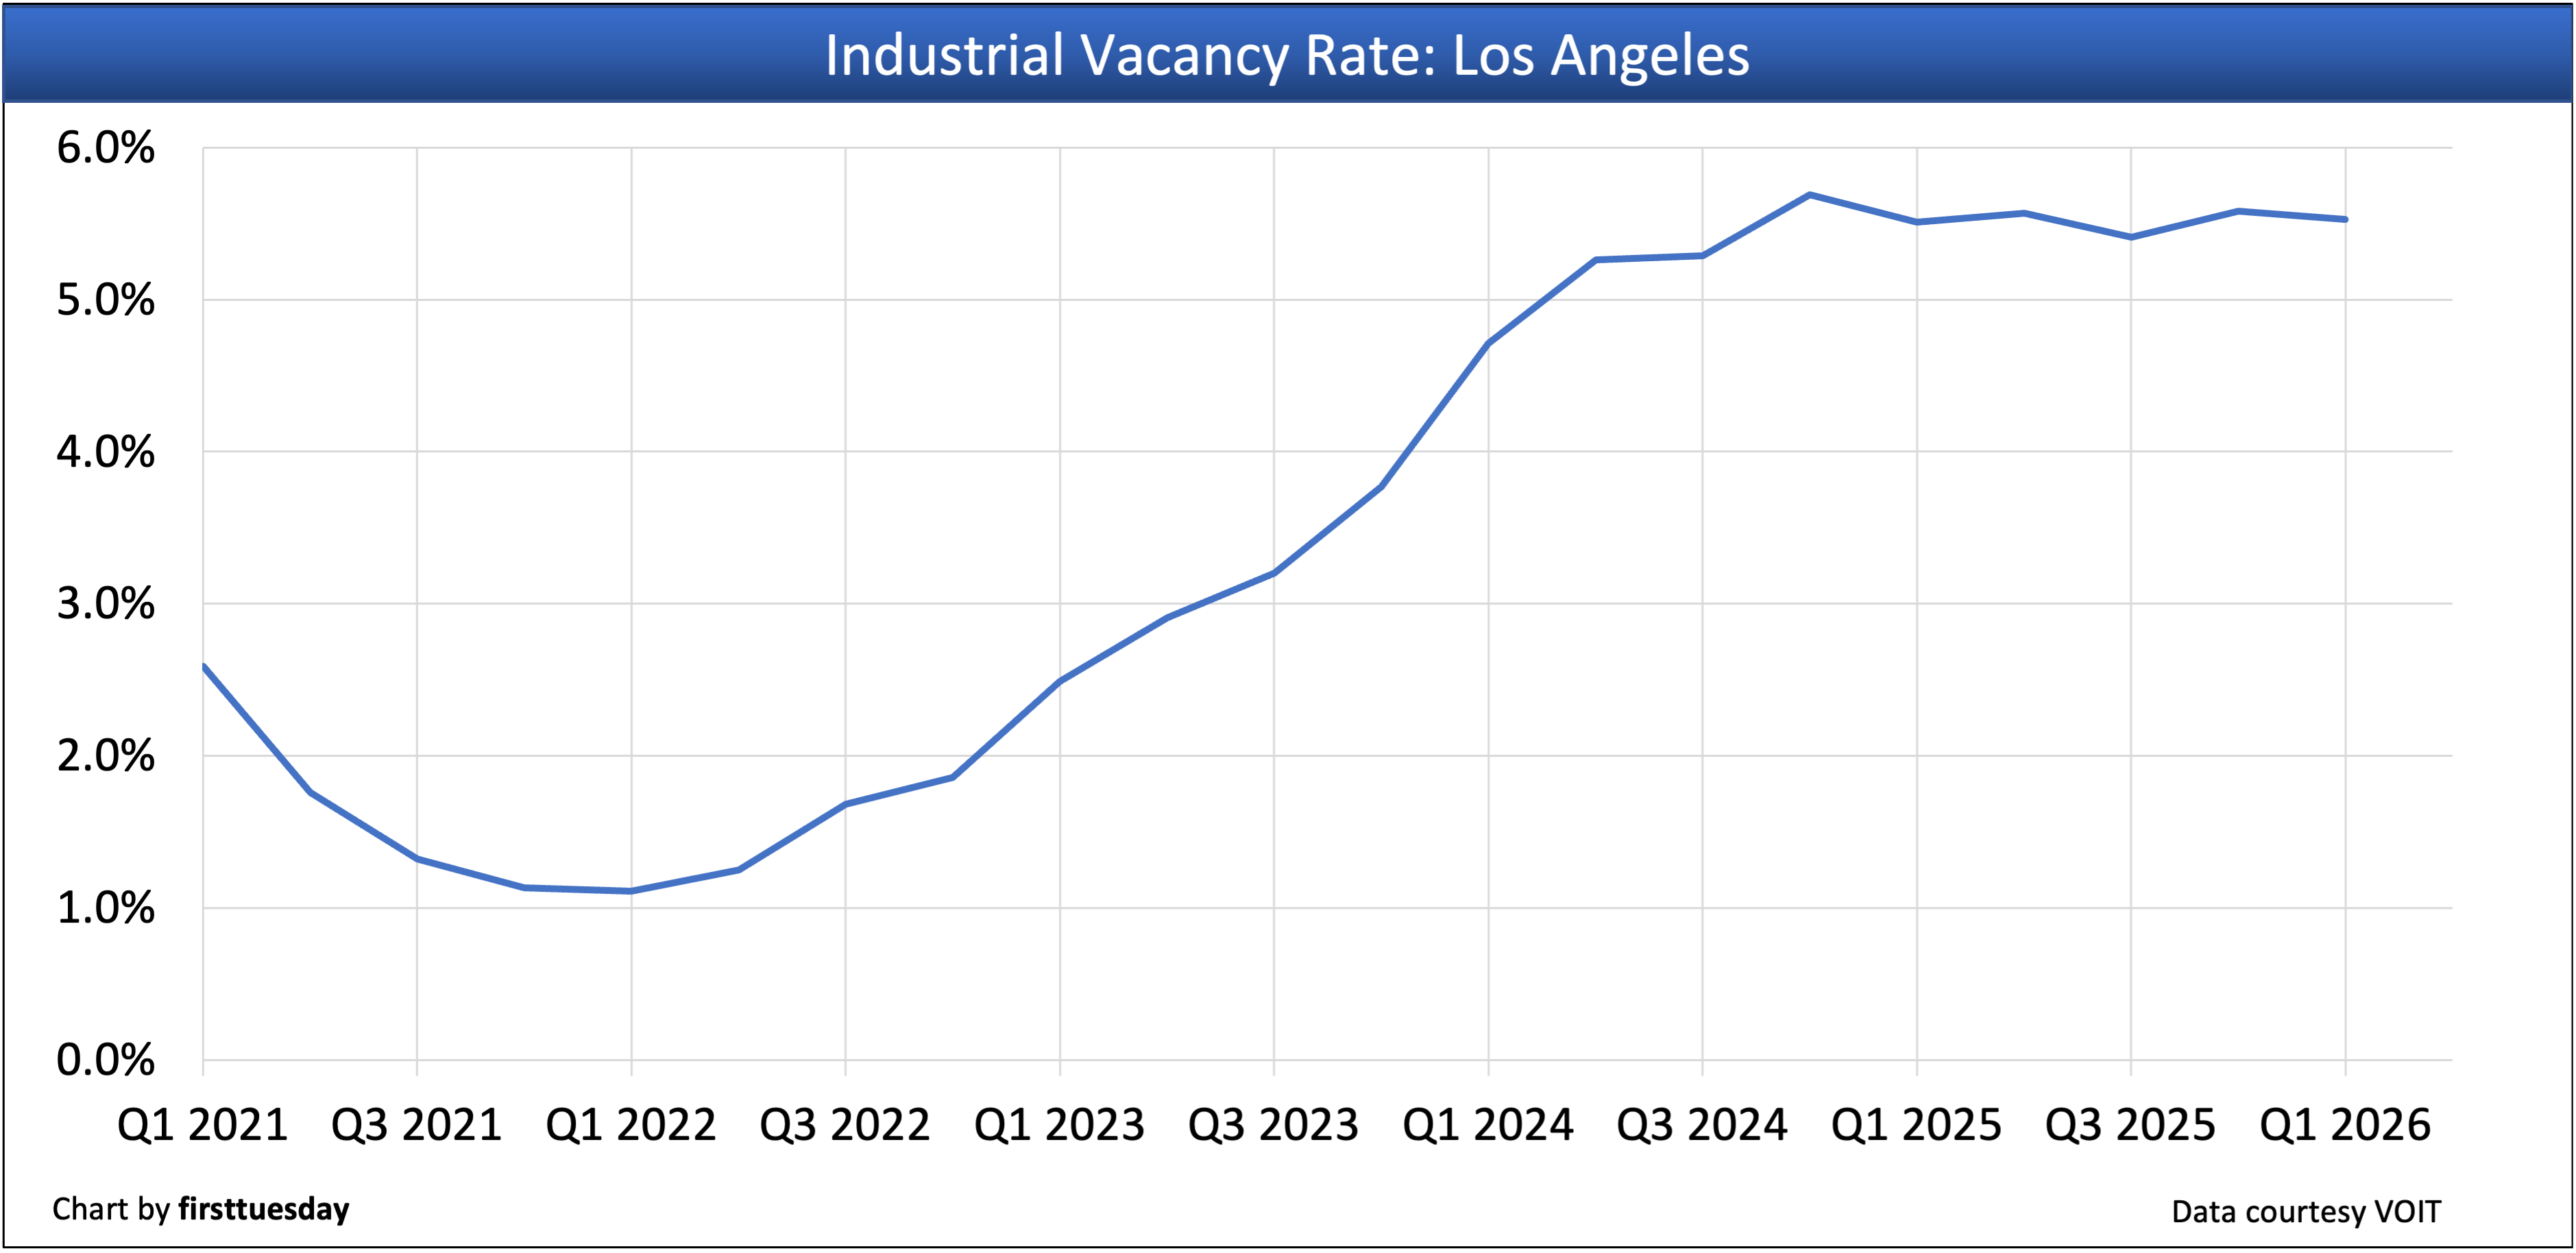
Los Angeles County’s industrial vacancy rate is:
- 5.53% in Q1 2026;
- down from 5.58% in Q4 2025; and
- up slightly from 5.51% in Q1 2025.
Conclusion: Los Angeles vacancy rates are leveling off from their 5.69% peak in Q4 2024 but remain elevated above the pre-pandemic standard of 2.20% in 2019. Space for distribution is the current rush, but old buildings in the inventory will suffer vacancies unless brought up to today’s building codes.
Los Angeles County’s industrial net absorption rate is:
- +540,615 square feet in Q1 2026;
- up from +204,595 square feet in Q4 2025; and
- down from +664,113 square feet in Q1 2025.
Conclusion: 1.1 million square feet of positive net absorption was recorded for 2025 in Los Angeles following 9.4 million square feet of negative net absorption for 2024. This drama change was nearly all the result of either tariff avoidance by distributors or increased demand for distribution brought on by online commerce growth.
Inland Empire — industrial
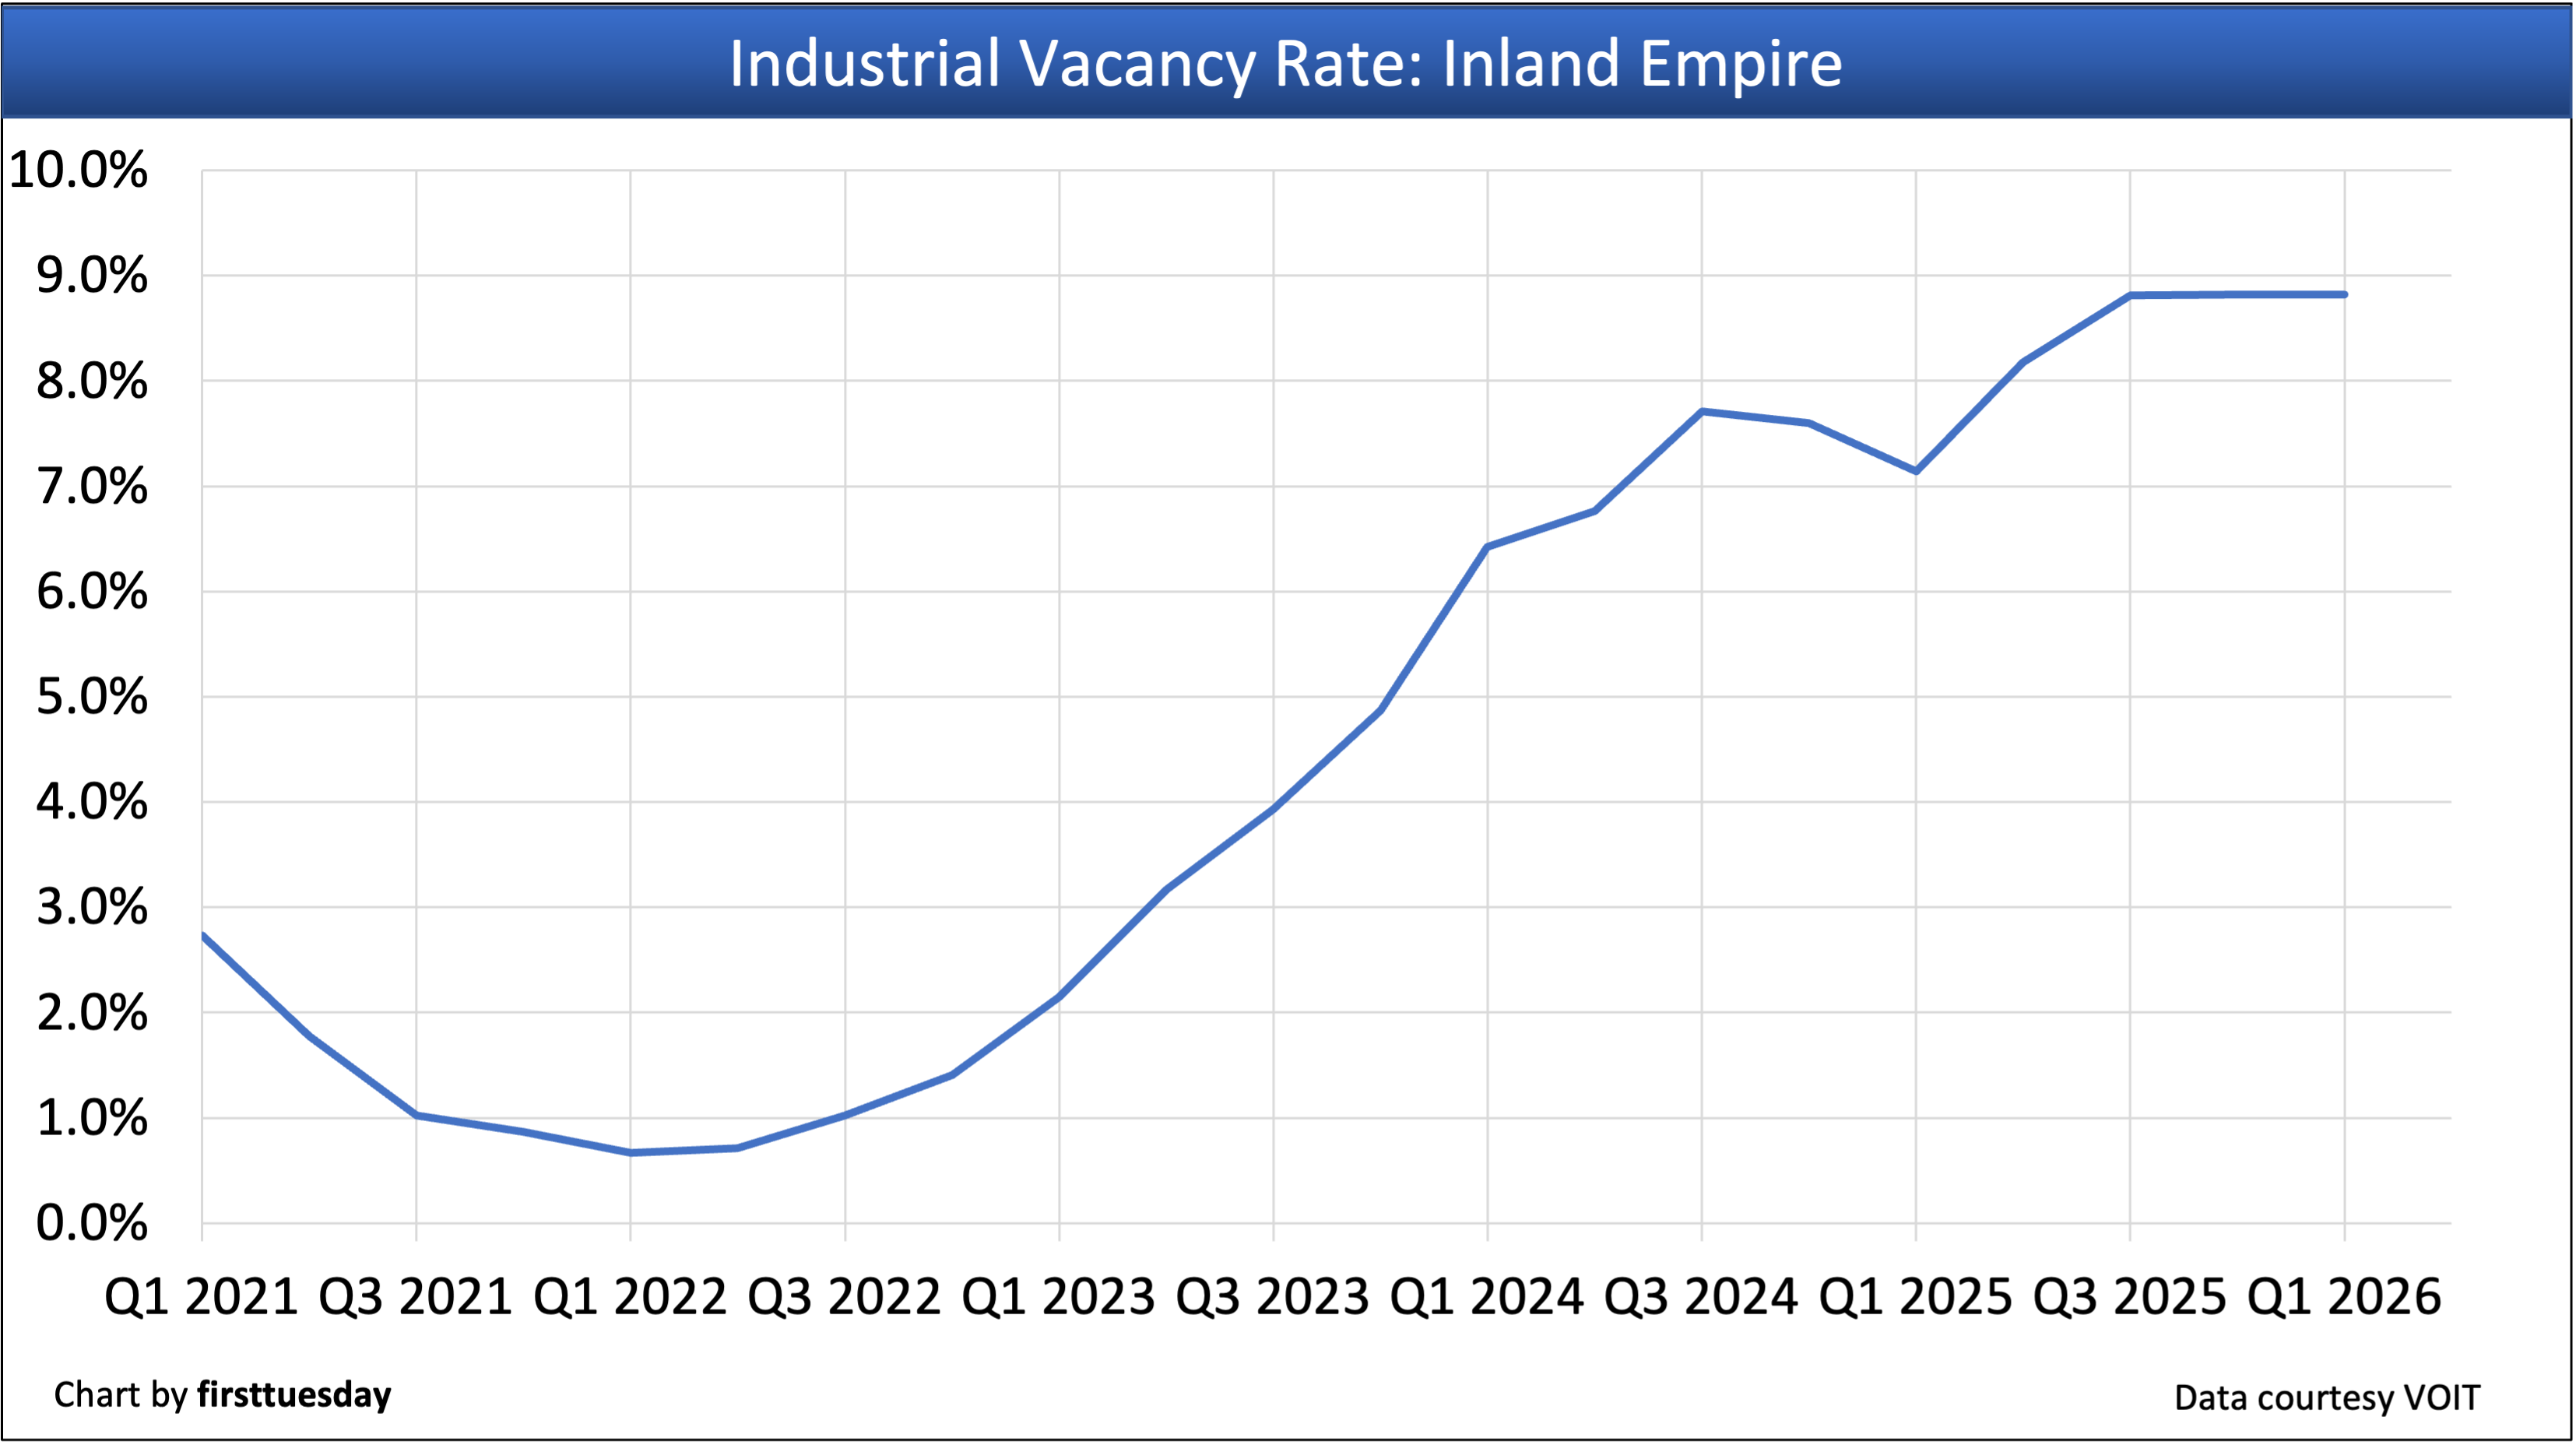
The Inland Empire’s industrial vacancy rate is:
- 8.82% in Q1 2026;
- flat from 8.84% in Q4 2025; and
- up from 7.57% in Q1 2025.
Conclusion: After the 1% vacancy rate trough Inland Empire industrial experienced in 2022, new supply to the market has pushed vacancy rates higher.
The Inland Empire’s industrial net absorption rate is:
- +1,587,049 square feet in Q1 2026;
- down from +2,917,134 square feet in Q4 2025; and
- down from +2,782,602 square feet in Q1 2025.
Conclusion: The total net absorption from 2022 through 2025 was 13 million square feet, one-fifth of the 65 million square feet during 2018 through 2021.
Related articles:
The widening level of vacant commercial space available in SoCal — Q1 2025


To what extent are large companies like Amazon masking the effects of smaller business closures on the industrial market?