
Why this matters: Informed brokers and agents are better prepared to serve their clients and represent themselves as experts in their community when available data gives direction to their practice, especially during times of uncertainty within their local real estate market.
Homeownership set to stumble
Riverside’s housing market in 2026 is gradually entering a more consistent but slowing economic phase, drifting on the ripples left behind by the chaotic pandemic-era real estate market.
In 2026, inventory has begun to level out, reflecting restrained demand from homebuyers and reduced sales volume. Prices have given indication they are going to slip in 2026, setting aside a minor cyclical spring bounce.
Expect sales volume for all types of property to continue its level trend in 2026, the trend in sales volume since the mid-2022 peak. When property prices next bottom, it will likely be around 2027 or 2028, followed quickly by an initial arrival of speculators and investors providing a short term pick up in sales volume and a price bump.
Only then as prices again start to rise will buyer-occupants sense a bottom to prices has developed and return to buy, as they do in every recovery period.
Mortgage rates are expected to trend upward in the decade ahead, putting downward pressure on prices as rates rise. Home sales volume follows the pace of price decline when mortgage rates remain high or trend higher. Thus, the long-term price outlook for Riverside mirrors the rest of the state, with home prices finally having found stability in 2025.
View the Riverside regional charts below for details on current activity and forecasts for its housing market.
Updated June 25, 2026.
Home sales volume slows
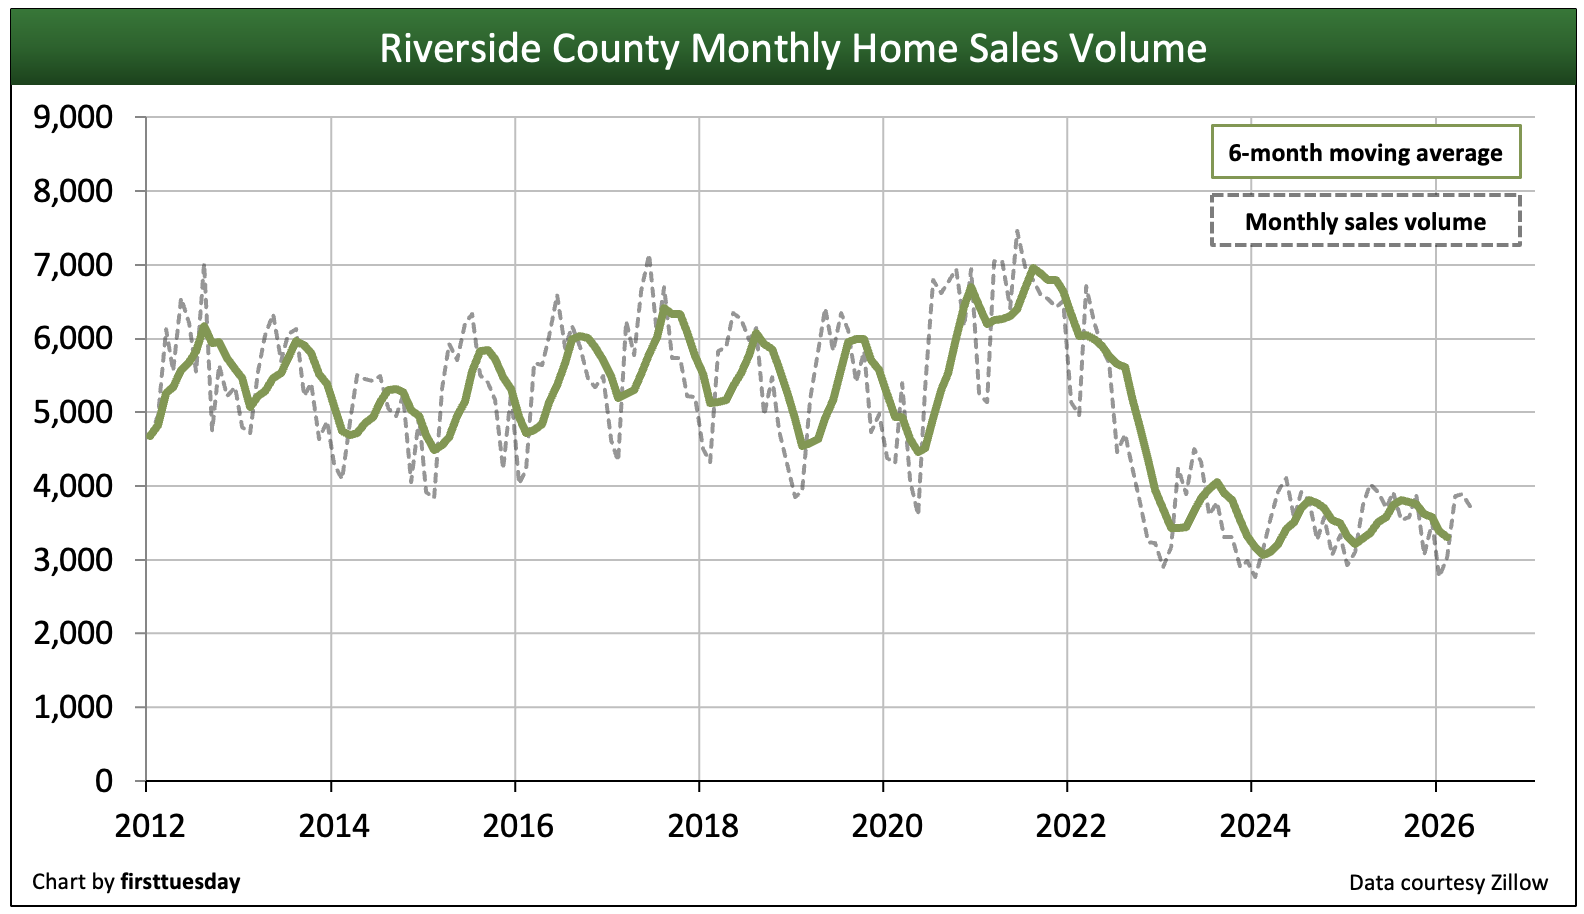 Chart update 06/25/26
| 2025 | 2024 | 2005: Peak Year | |
| Riverside County home sales volume | 25,100 | 25,000 | 68,100 |
Home sales volume in Riverside County is stuck around 3/4th the heights seen in 2019 during the last normal year before the pandemic recession.
Home sales volume in 2025 was roughly level with a year earlier. Worse, compared to the pre-pandemic peak of 2019, sales volume is 28% lower in Riverside.
Today, sales volume is trending flat with a downward influence for 2026, with year-to-date sales volume down 3% from a year earlier as of May 2026.
Builders facing increased trade taxes on materials and a reduction in the migratory labor force are not likely to get excited about building SFRs at any rate beyond completing starts underway and owner-contracted starts. The last experiment in trade war taxes suggests a steep drop this time in property sales of all types, together with a huge adjustment in pricing driven down by the declining need for property to house people and businesses. Bankruptcies, corporate and personal, with increase surprising last in 2026 to create more uncertainty about property sales volume and pricing.
The recovery will likely occur in the years following 2028, when user demand adjusts in Riverside County buttressed by a labor market recovery. Residential construction starts will increase dramatically to help fill buyer demand as cities within the county further open up the permit process in urban centers.
Inventory rises from historic lows
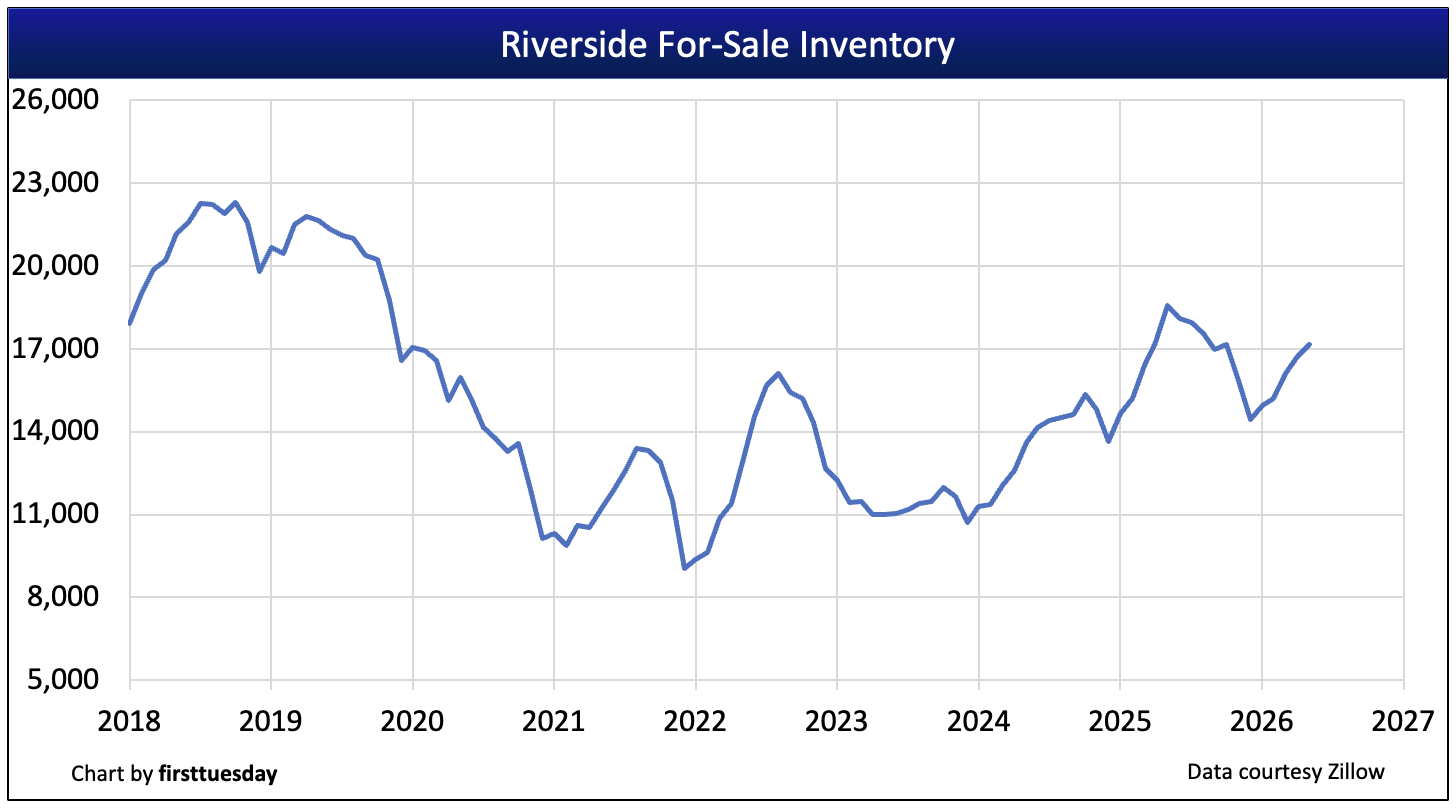 Chart update 06/25/26
| May 2026 | Feb 2025 | Annual change | |
| Riverside County for-sale inventory | 17,200 | 18,600 | -8% |
Multiple listing service (MLS) inventory has risen from the historic low reached at the end of 2021. After plateauing in 2023, for-sale inventory in Riverside in May 2026 was slightly below a year earlier. However, this number is gradually trending higher.
Looking forward, expect for-sale inventory to grow in 2026. As for-sale inventory increases due primarily to greater lengths of time on the market, sellers are forced to reduce pricing to bring mortgage-funded homebuyers back to the broker offices to acquire property.
As the Fed’s fight to reduce consumer inflation while maintaining current employment levels is now an irregular process, financial indicators point to a continuing downturn in the housing market until the 2028 period. Homebuyers seem well aware of the economics involved.
The seller’s market built up in the last recovery fully reversed by mid-2022. This shift is a process which began in 2013 with the beginning of the 30-year half cycle of generally rising long-term interest rates, the fixed rate mortgage issue. In today’s tumultuous markets, homebuyers increasingly take a wait-and-see approach to buying a home until they sense market conditions no longer reflect further home price reduction. Declining prices only expand the reservoir of ready and able buyers stalled by their wait-and-watch routine, until suddenly they all become willing to jump in once prices bottom and hold.
Turnover rates flounder following moratoriums
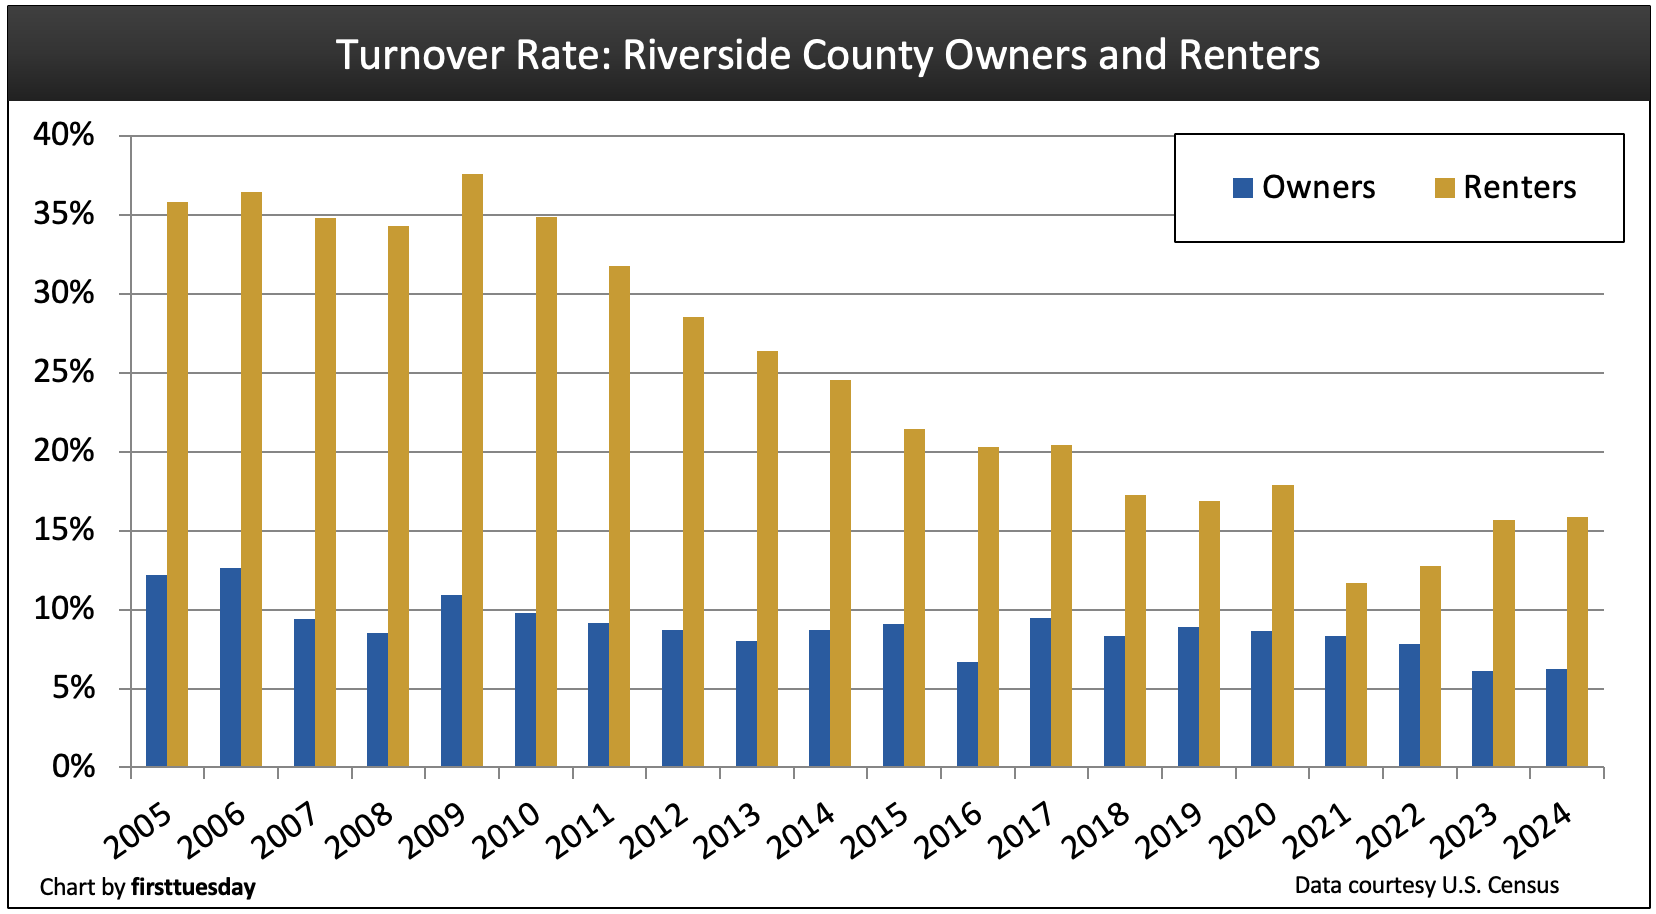 Chart update 12/30/25
| 2024 | 2023 | 2022 | |
| Riverside County homeowner turnover rate | 6.3% | 6.1% | 7.8% |
Riverside County renter turnover rate | 15.9% | 15.7% | 12.8% |
Home sales volume depends in large part on homeowner and renter turnover.
The number of people moving from their residence each year is indicative of both the willingness and ability of homeowners and renters to relocate. Turnover rates are highest when jobs are abundant and wages are rising faster than consumer inflation. Then housing starts increase and employee confidence in the economy moves higher. 2025 did not provide forward resilience for any of these factors.
The homeowner turnover rate inched higher to 6.3% in 2024, still below the level needed for a full recovery in home sales volume. The renter annual turnover rate also grew slightly to 15.9% in 2024 from the previous year’s 15.7%. The 2024 rate of 15.9% is still well below the 26% turnover of a decade prior in 2013.
Despite bounces in both sales volume and prices in 2021, much of this activity was fueled by absentee homebuyers – investors – rather than owner-occupants relocating. Thus, homeowner turnover decreased each year in 2022-2024.
Expect a consistent increase in the frequency of turnover to arrive in 2027-2028. Legislative efforts to force cities and counties to greatly increase the permitting of residential construction will eventually increase housing starts. Further, after we pass through the remainder of the current real estate recession, persisting since mid-2022 and likely to continue into 2027, Riverside will experience an economic recovery for real estate sales and leasing transactions for all types of property.
A strong contributing factor will be an increase in for-sale inventory generated primarily by foreclosure efforts and construction starts. Short sales and REO resales due to mortgage defaults will be in the mix as job losses set in. Domestic and international emigrants will continue to play a significant if not enhanced role in the county’s periphery housing — the suburbs.
Homeownership plummets
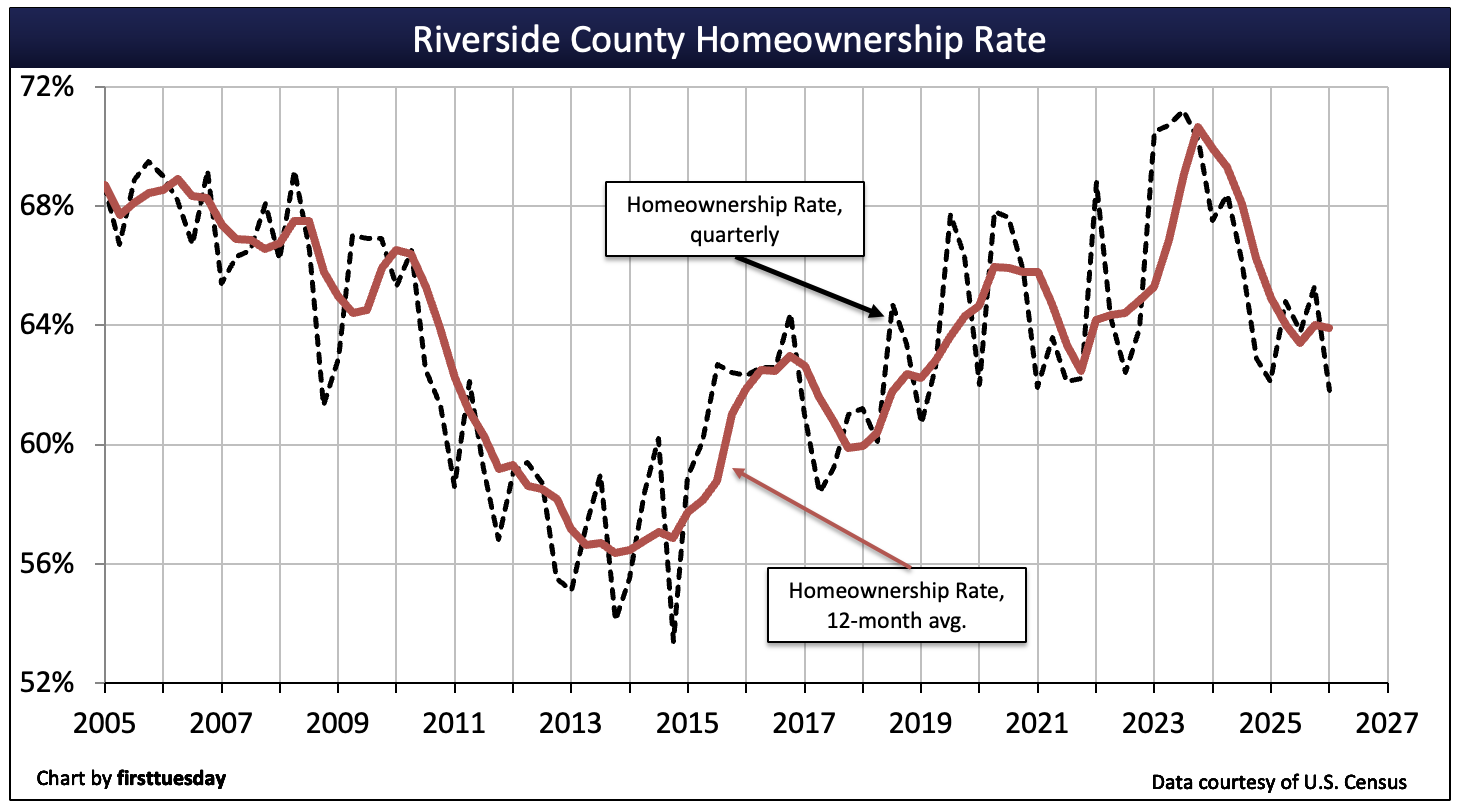 Chart update 06/25/26
| Q1 2026 | Q4 2025 | Q1 2025 | |
| Riverside County homeownership | 61.8% | 65.3% | 62.1% |
Riverside County’s homeownership rate fell steeply during the Great Recession of 2008. But the county achieved the rare status among California counties of briefly clawing its way back to Millennium Boom levels before the Pandemic economy took over.
As of Q1 2026, the homeownership rate is 61.8%, roughly the same as a year earlier. This is still significantly higher than the state average, which was 55.7% in Q1 2026. The rate will likely continue on its volatile path until the years following 2027.
In the meantime, high FRM rates and faltering prices will drive some owners into forced sales. Declining prices instill a wait-and-see attitude among buyer-occupants until prices stick to a bottom level. Riverside County’s homeownership rate has historically been higher than the state average. Riverside County has a larger share of homeowners since much of the county is considered a bedroom community of less expensive housing. Today’s homeownership rate is slightly below what is considered a “normal” rate for the region of around 65%.
Residential construction mixed
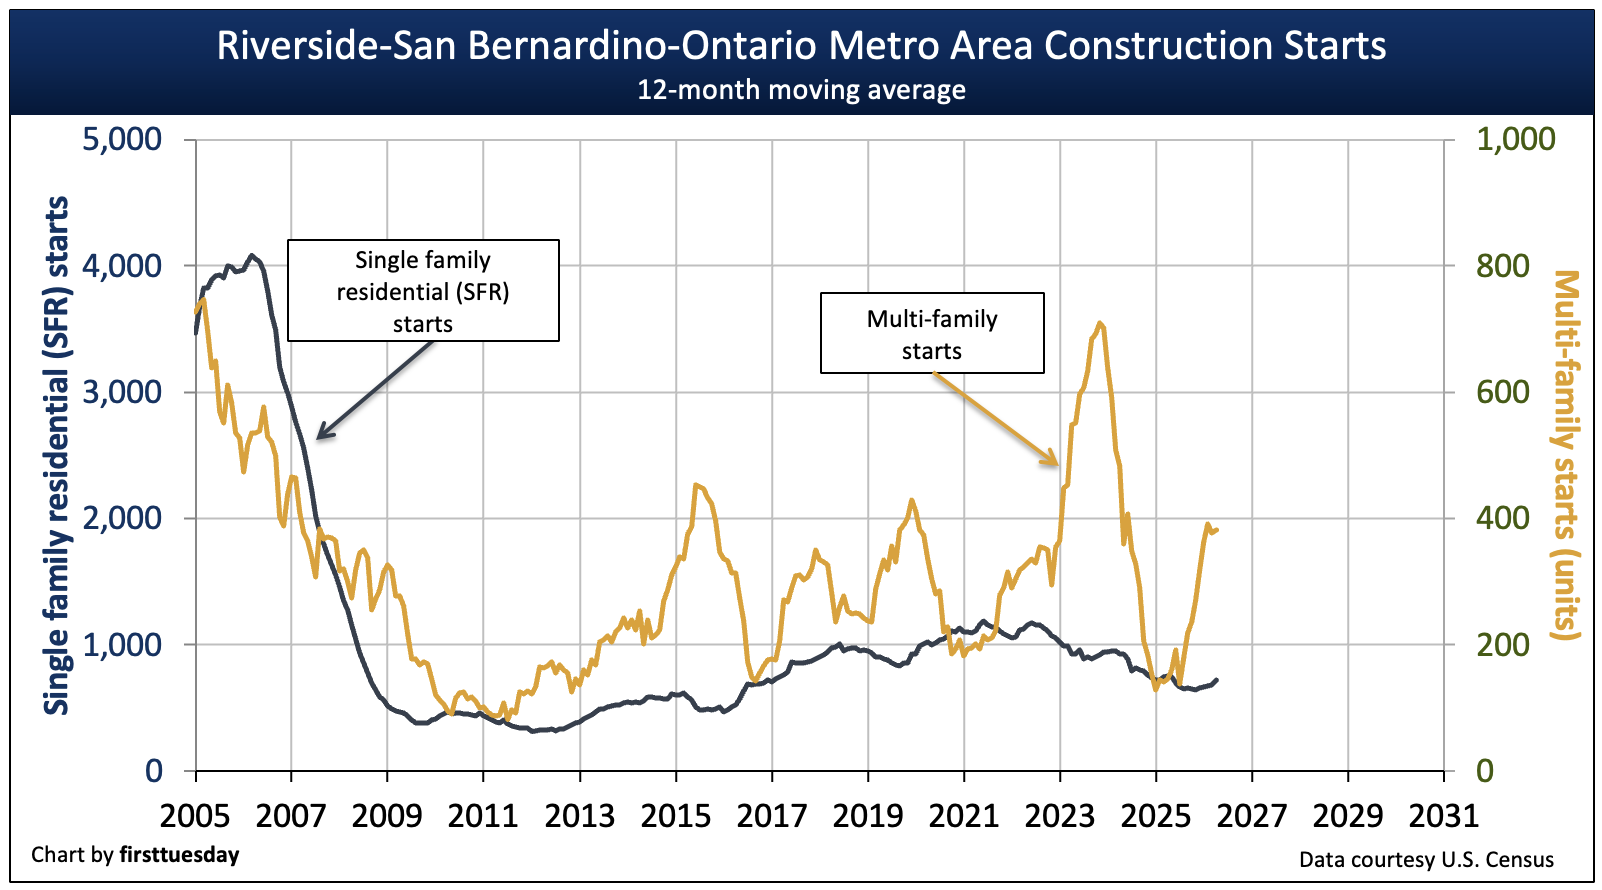 Chart update 06/25/26
| 2025 | 2024 | 2023 | |
| Riverside County single family residential (SFR) starts | 7,200 | 8,100 | 10,700 |
Riverside County multi-family starts | 3,800 | 1,500 | 7,400 |
Residential construction starts have become volatile in recent years. During the current upturn in the housing cycle beginning in 2011, multi-family starts peaked in 2023. In this elongated recovery period ending with the pandemic economy flameout, multi-family starts have fluctuated greatly every two or three years.
Multi-family starts number 2,800 units in 2025, a significant increase from the 1,500 units starts in the prior year. In Riverside County, the focus on multi-family construction is far less pronounced than in regions closer to the coast, as its lower land cost keeps the costs of SFRs within reach of more households.
Meanwhile, single family residential (SFR) starts declined to 7,200 new SFRs in 2025, down from 8,100 in the prior year.
The next peak in SFR construction starts will likely occur in the post-2027 period due to a boost from state legislation and an expected upturn in jobs and thus transactions – both sales and rentals. Even then, SFR starts will not return to the mortgage-driven peak experienced during the Millennium Boom.
Looking forward, multi-family housing starts in the next upturn will experience higher levels as last seen in the mid-1980s with the arrival of Baby Boomers to the home ownership market. This time, the need for multi-family housing, as well as SFRs, will be fueled by their Gen Y children — Millennials. Their income will accelerate as they age and over run their student debts. Then they will belatedly upgrade their housing accommodations, no differently than did the Baby Boomers at a younger age in the early 1990s.
Jobs near a peak after 20 years
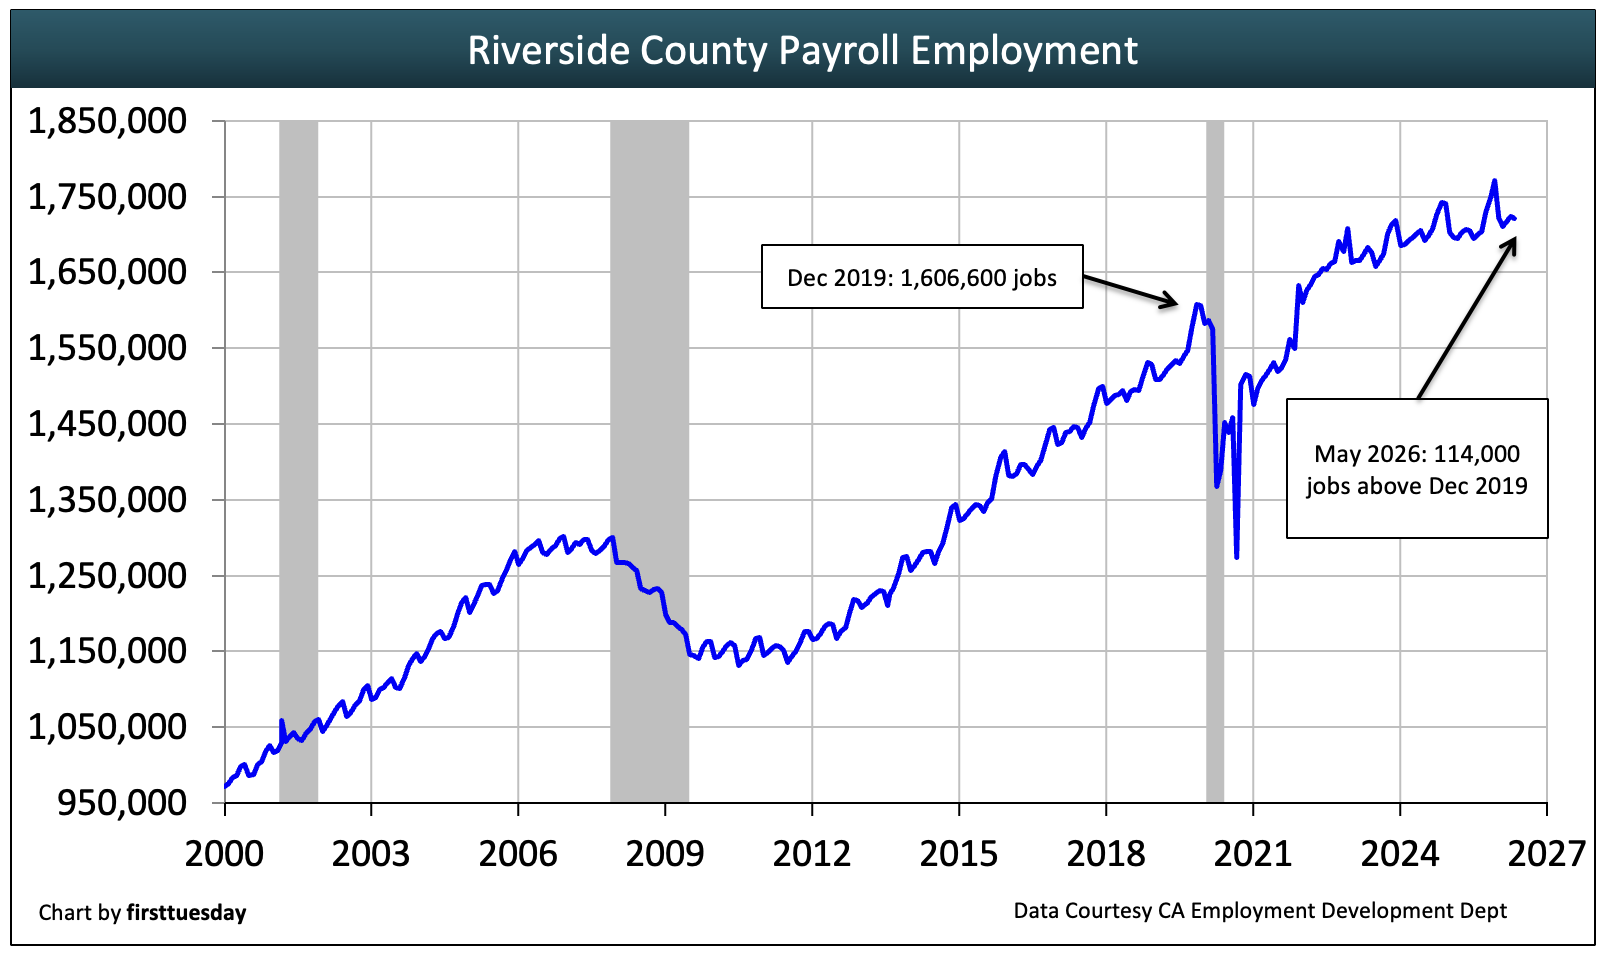
Chart update 12/30/25
| May 2026 | May 2025 | annual change | |
| Riverside County jobs | 1,720,600 | 1,706,200 | +0.8% |
Before occupying end users can provide support for the housing market, they need reasonable assurance of a sustainable income source — i.e., jobs with wages trending in excess of the rate of consumer inflation.
The number of individuals employed in Riverside County finally surpassed its December 2007 peak at the end of 2014, barely catching up by 2020 when factoring in the jobs needed for the region’s population gain.
But the recovery from the 2020 pandemic economy was much swifter due to massive fiscal and monetary stimulus widely spread across the population. Riverside was one of California’s first major metros to achieve a jobs recovery following the pandemic.
As of May 2026, 114,000 more individuals were employed in Riverside compared to the 2019 jobs peak as the Covid pandemic hit. However, the recovery pace has since rapidly dwindled, with the number of jobs held today in Riverside just 0.8% above a year earlier. Expect the jobs recovery to continue its faltering progress, flat and falling, not to enter a true recovery until after property prices bottom and start to consistently rise.
Industry employment falls slowly
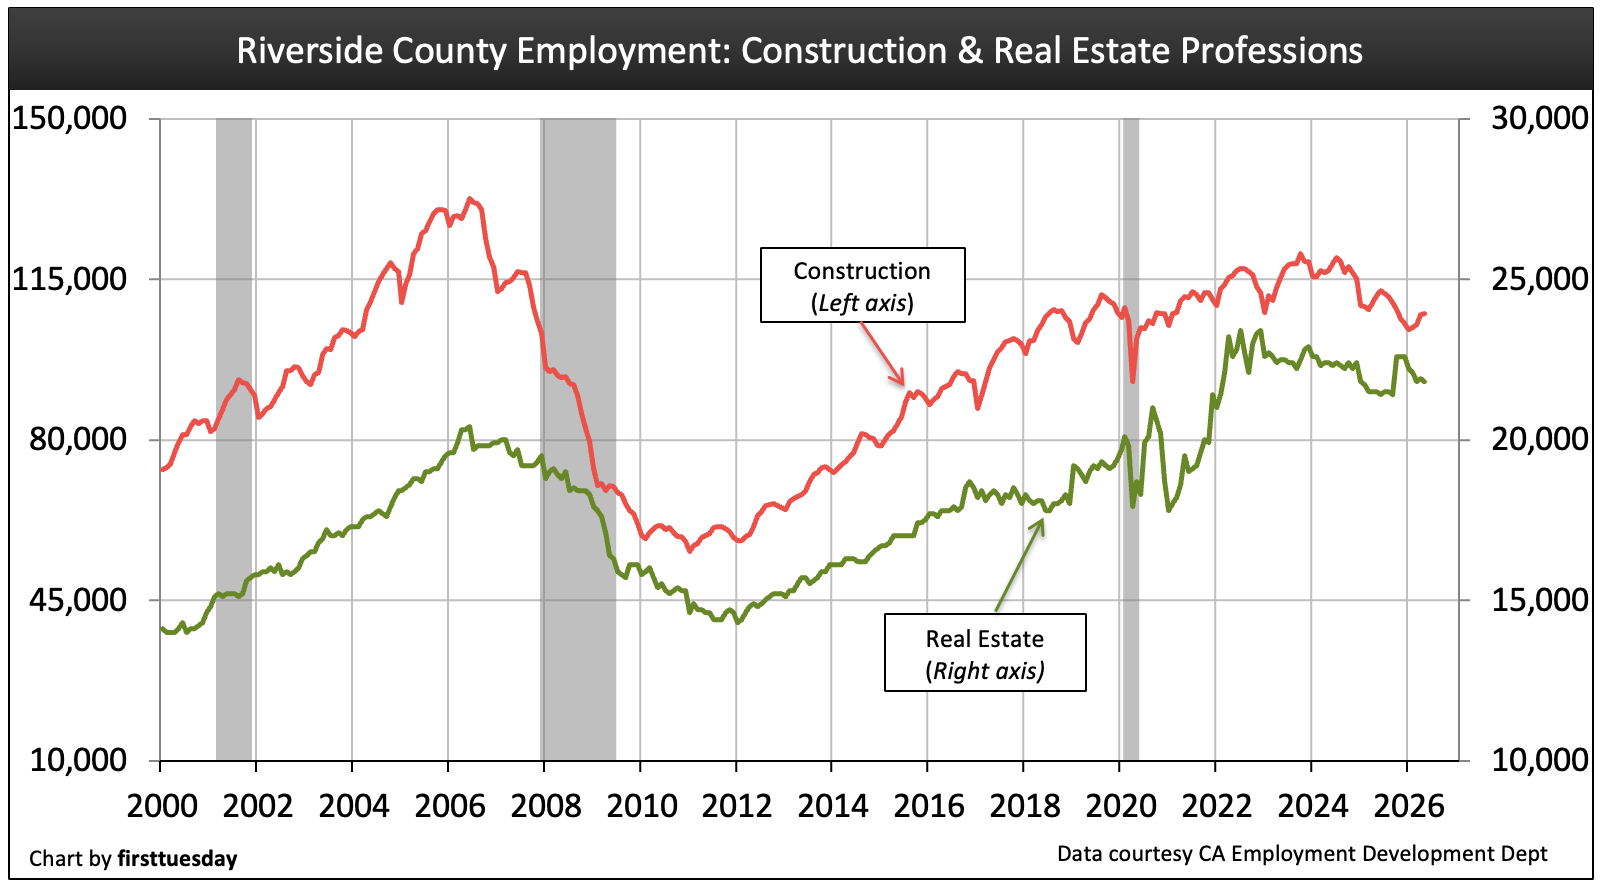 Chart update 12/17/25
| May 2026 | May 2025 | annual change | |
| Real estate | 21,800 | 21,500 | +1% |
| Construction | 107,500 | 111,400 | -4% |
While many of Riverside’s top employing industries have yet to recover from the tsunami pandemic economy, the period was far been less damaging to the real estate industry in Riverside compared to other parts of Southern California. The different circumstances are less expensive homes with less population per acre inhabited, the perennial cheaper land situation compared to property in coastal counties.
The number employed in the construction industry has gradually declined over the past year in Riverside. This figure continues an ongoing flat-to-down trend in the number of individuals employed in the real estate industry. Caution over a deep-rooted concern about anything real estate is on the minds of a constantly increasing percentage of Californians.
The real estate profession will not likely experience a sustained increase in hiring by brokers until the next confluence of buyers and renters (members of the Millennial, Generation Z and Baby Boomer generations) converge on the market in the years following 2026.
Per capita income now parallels consumer inflation
 Chart update 05/09/25
| 2023 | 2022 | Annual change | |
| Riverside County per capita income | $53,800 | $51,000 | +5.4% |
| California per capita income | $81,255 | $76,941 | +5.6% |
Per capita income in Riverside is one of the lowest in the state. Low per capita income holds down rents and, in turn, new multi-family starts. Annual income rose beyond 2008 peak year amounts in 2013 — and that’s before accounting for the lost purchasing power brought on by intervening consumer inflation exceeding wage increases at the time. For real estate, 2013 produced a huge asset inflation hit with prices jumping over 30% for the year. The rise in pricing was driven primarily by mortgage rates bottoming at their lowest level since rates peaked 30 years early in 1983. The average employed individual in Riverside earns just $53,800 according to the most recent Census reported year of 2023. The statewide average income is much higher than Riverside’s. Recently the annual income rise in Riverside was lower, 5.4% compared to the state average of 5.6% in 2023. However, the average resident of Riverside spends less of their income on housing expenses than those living in urban coastal cities. In fact, some of the Riverside income rise is attributed to high income-earners moving to the bedroom community of Riverside in search of cheaper housing. Jobs and the pay received by local residents is why homebuyer occupants ultimately determine selling prices. Buyers can only pay as much for an SFR (or apartment) as their savings, income and credit score qualify them to pay — nothing more, no matter the price demanded by sellers. Though still obscured by the fog of international trade chaos, look to 2028 for the starting point of the next rise in home sales volume and prices. When world trade issues remain in conflict as we are experiencing, expect job losses and in turn forced sales of property to avoid foreclosures which will hobble the housing market during 2026-2027. The next sustainable recovery period for real estate sales, leasing and mortgage originations will be driven by the more resilient shifting demographic trends of retiring Baby Boomers — as sellers — and their Millennial and Gen Z opposites — as buyers.


That phrase “ripples of the chaotic pandemic-era real estate market” captures the lingering uncertainty so well—it’s not a clean break but a slow, uneven settling.
Solid piece! Thoughtful analysis and great points throughout. This was definitely worth reading. Looking forward to more from you!
The truth is that what reigns nowadays here in California more than any other State is a disease called GREED! but that’s not all, there’s also a problem with the Morality of the people, it’s been decaying since many many years ago, thx to people that exaggerated their desires for pleasure and lust they also expose their wrath when envy invades their haughty way of slothy and gluttonous living.
greed is what ‘the church’ admonishes us about (while collecting its riches from us). The ‘disease’, the social structure, is capitalism. This is how capitalism works. It takes our minds, our lives, all our life is consumed with fitting into the for-profit schema. Church aids the state – as you know.
its not capitalism nor greed that caused these problems, its the opposite, the welfare state. government wanted everyone to own homes and some people aren’t responsible enough to own homes causing this vicious cycle of booms and busts. u either use it to ur advantage or u listen to daddy government and accept a expensive handout. learn supply and demand along with fluctuating interest rates.
Maybe I live in a different riverside then the posters above. When I was in college working part time at T-Mobile, I was making close to 50k… Now that I have graduated I work in newport beach which is a 45 minute drive from riverside through till roads …. I had the option to buy a condo in OC for 400k or buy a big house with RV parking for 380k… So guess what I ended up buying in riverside. Most of my co workers are moving into riverside for same reason. That’s why the home prices are going up. Home prices are not made for entry level workers or single individuals…it is fairly easy to make 50 to 60k with few years of experience….combine that with your spouse 60k you can easily afford up to 480k since the interest rates are so low…. So to prospective buyers out there, don’t pay much attention to naysayers …..
to Jay and everyone: this is rent – owned by our Owners – controlling our lives. The need to make profit. For one thing if we don’t have ‘enough’ we’ll be out on the streets with the other dis-housed people – especially in our old age. Try paying rent on social security.
What the Author of this article has not included is the TOTAL PICTURE of what is on the HORIZON. For example it was disclosed that California will once again SHUT DOWN OIL in the SANTA BARBARA CHANNEL where currently receive 33% of all of California’s oil, plus the fact that Congress just approved the ability of Oil Companies exporting oil for the first time in FOUR DECADES. That and the mere fact that the current occupant of Sacramento as the Governor,(Jerry Brown), will not change the fact that California charges the most for gas in the U.S. and even though he favors FRACKING for OIL (on his 2,500 acre ranch only) and the fact that California will be increasing minimum wage and the fact that California will be increasing the price of gas next year to $4.50 a gallon for Regular and the fact that Obamacare will be causing the unemployment rate to increase as well and the fact that interest rates will be increasing next year for real estate loans, I do not see how the economy will be improving for at least the next 3 plus years at the earliest.
I agree whole heartedly with your assessment. Until income increases, there will be NO real recovery. Furthermore nobody’s addressing the back door property tax increases that are being called ” special assessments ” (an end around to prop 13).
My wife and I have recently been window shopping at all the new construction homes for sale, and noticed that with the property tax and special assessment fees that a buyer could pay in ezcess of 2% in taxes. If you factor in HOA’s your looking at upwards of 1000.00 a month above the mortgage. Then factor in the 50k plus premium the builders are placing on new construction, I’m not sure how a person with an average salary of 36k in this county can afford it. So what I see is lower down payment programs, lower FICO rate qualifications. .. in short we’re opening up ourselves to another bust. Albeit not as large as 05-06, but most definitely sure to happen.
The officials in this state have put so much downward pressure on the middle class with high utility costs, fuel costs, “special assessments “… they can’t afford to live here, let alone retire here. The mega rich can endure this , the poor can’t even contribute to the tax base , so you will see a collapse in our local economy. Already I’ve seen a drop in resale prices of 10k-20k just in the past month. The other major factor to consider is job growth and traffic congestion. Jobs being created in the IE for the most part are not high wage jobs. The high wages jobs are primarily in OC, SD & LA and as we all well all know, those commute times have increased substantially in the past few years.
To all you Gen Y’ers & Boomers out there, my advice is plan on getting the heck out of this place within the next 10 years. There are much more beautiful and better places to retire then California. Ask yourself what kind of quality of life will you have. Good luck and GOD Bless.
Well said!
The job growth in the IE is due to minimum wage job increase. Why would you need to write an article stating the obvious – that home sale volume is directly tied to job growth, and job growth with real income growth, not minimum wage income. It was the NINJA subprime lenders that created the home boom/bust. The INSTITUIONAL cash buyers like Blackstone, wealthy Arabs and Chinese that were able to buy the distressed properties and REOs and they purchased them in bulk in the IE around 2010 thru 2012, Now they have put them on the market at double (or more) the purchase price. But wage growth is not able to support these listing prices. This is a sellers market for all tiers the problem is the low tier group dont have the wage growth to buy in the IE. The game is rigged I’m afraid….get out of CA as quick as you can!
I believe that sam’s comment is clarifying whats really going on in short. And the authors, who spent so much time writing this article, fail to take a moment to speak to his comment; which would help readers.
The article says Riverside County per capita income $33,278 per yr. According to Zillow’s qualifying calculator this income would only qualify a buyer for $107,000 house that is with a $20,000 dn payment. And your debt level can only be $250.00 a month.
At an annual income of $33,278 divided by 40 hrs a wk x 52=, 1,920 hrs per yr. Equaling $17.34 per hr for one person. Or divided by 2 = $8.66 per hr for two. This looks a little like minimum wage to me.
So it would take two minimum wagers to qualify for a $107,000 house. But there are no $107k houses. One can use these numbers and juggle them around anyway they want. You could double the income from $17.34 per hr to $34.68 per hr or $66,556 a yr and you still could only afford a $214,000 house. But houses are ranging around $250,000 house your income would have to be $60,000. It begs the question(s). Who’s buying these houses? Two nurses living together or who. How can these price arranges be?
What we have is a squeeze play. Interest rates will have to remain low in order to sell houses that are already to high. There aren’t enough high productivity jobs to support the high price homes. This is a consequence of sending productive jobs to China and Mexico, etc.,and the allowing of illegal aliens/Mexicans and their Babies to do the massive numbers of minimum wage jobs created by corporations, once they found out they could control the government, which allows the illegal aliens into our country.
one of the things that has been done is that the money in our country is no longer circulated in our country.
What we are experiancing
To summarize prices are over priced. Who can afford them? Are interest rates set low so that people can have a better chance of buying? Is a crash in the works again.
All this said, whats the purpose of this article?
The article should be emphasizing that the price of housing way to high. And the next question is who is responsible? Will there be another housing crash?
The whole thing is a viscous cycle, whereby China, Mexico, corporations, businesses, illegal aliens, (who make a fortune in our country as compared to Mexico), and other 3rd worlders all make money while true American Citizens are driven down! If I’m wrong please explain why so that I can see the “light”.
Your information is helpful. It only, really, raises more important questions, thoughts and ideas as I’ve posed above.
Technology is putting people out of jobs not people that want low wage jobs and come here. Just look around you at the tech that can do part or all of what people were doing. The other factor is 80 million boomers that companies feel are paid too much and want them replaced with younger cheaper workers and those same boomers will off load houses as the face retirement and health issues. There will be more renters than home buyers.
If you buy a house in Riverside county especially in rural ar es as you better be aware of every detail of that property. RIP Off Riverside county doesn’t even know where property lines are, they dont know if the land is developed or not. They are CLUELESS. We recieved a tax bill for undeveloped land, and wanting to do the right thing we advised the assessor that there was a house on this land. To make a long story short $10,000 later we had to 2nd our house. Now as we are trying to sell the county says our address doesn’t exist and that our property lines are all wrong. Of course we have to pay to find them. AVOID RIVERSIDE COUNTY LIKE THE PLAGUE.
Unfortunately you are right. Technology is replacing some jobs but not the ones being filled by immigrants. Construction, Landscaping, Food Service, Maid Service, just to name a few. Low cost immigrants have been taking these jobs at a pretty good clip for the last 30 years. Not just in California but the entire Southern States and Midwest. Lawn mowing and fast food jobs were primarily filled by young kids willing to work for extra money 30 years ago. Now these jobs are filled by adult immigrants who need money to live. This is why housing prices are outpacing wages. We are filling jobs with people who will work for less than a living wage. The divide between poor and rich is growing as a result. Liberals typically do not understand this dynamic in our economy and that is why it is getting worse. To talk like this will label you a racist or a bigot. Although there is nothing racist about it, Liberals like to use name calling and labeling as a weapon to make their points rather than relying on sound evidence for their arguments or listen to other viewpoints. Their answer is to legislate a “Living Wage” for our minimum wage. It sounds good except that it will increase prices 2 fold, if not more, which will further widen the gap between rich and poor. The problem is simple supply and demand. There are too many low wage and or low skilled workers in the labor force and more on the way. The only benefits are that Corporations profit and increase their bottom line which makes their stocks go up, and Government is adding a new tax base and voter block to vote for and pay for future Government dept. Only in America.
yeah – they don’t have vicious cycles in Cuba – didn’t in USSR. That’s why our Owners keep attacking them. If people get to understand that the for-the-people social set-up is beneficial, our Owners are out of business – as they were in those states. US attacks any-everywhere people rise up – to take their property out of Owners’ – profiteers’ – hands.
You know Cuba would long have gotten itself into better shape if the US hadn’t kept invading it –
Is there a way to separate out retirement communities from the overall residential real estate market? It seems to me that retirees are a market unto themselves and that buying group is growing very fast. I own a property in Heritage Palms.