
Why this matters: SoCal’s commercial real estate market on entering 2025 is fully destabilized with industrial vacancy rates elevated across all SoCal markets and office vacancy rates even higher. The present deteriorating condition began in mid-2022 with no indication it will bottom in the immediate future. Financial readiness of all participants is now the challenge.
The first quarter (Q1) 2025 reports on the Southern California (SoCal) commercial property market are in from VOIT Real Estate Services.
In 2025, SoCal’s commercial market — comprised of San Diego, Orange County, Los Angeles and the Inland Empire — slips further into unstable territory.
Uncertainty over tariffs levied against foreign nations leaves tenants cautious, or worse, especially those with ties to our ports and borders.
Industrial property vacancy rates — the percentage of space available for rent — is above 5% in all SoCal markets and rising, the latter as the financial problem. All evidence points to a market struggling to retain or locate tenants. Both pricing of space and reduced need for space dictate vacancy levels with one county up, another flat or down.
Office vacancy rates for San Diego and Orange County are even more elevated, 14% and 15%, respectively. As this occupancy condition continues, expect action toward converting office space for other uses to generate rental income or sales proceeds.
Tenant brokers in 2025, now by mandate of legislation, need to consider the beneficial attitudes among tenants when the tenant broker negotiates fees and representation agreements with their tenant-clients.
A risk-mitigating brokerage office analysis is that price-fixing of brokerage fees as set exclusively by the owner’s broker, then split with the tenant broker, has always been illegal. Now, to end this fee-setting arrangement, California codes mandate a separate representation agreement by each broker expecting a fee on a transaction with their client.
The legislative objective is to force brokers to conduct fee negotiations, always in writing, with their clients under penalty of Department of Real Estate (DRE) enforcement and review of licensee status. The codes apply to all types of property, commercial as well as residential.
The tenant representation agreement published by Realty Publications, Inc. (RPI) is now available for tenant brokers to use for a tenant to retain the broker and negotiate a fee the broker expects to earn. And, of course, who pays the fee when it is earned. [See RPI Form 105.1 and 105.2]
Related article:
San Diego County — industrial, office and retail
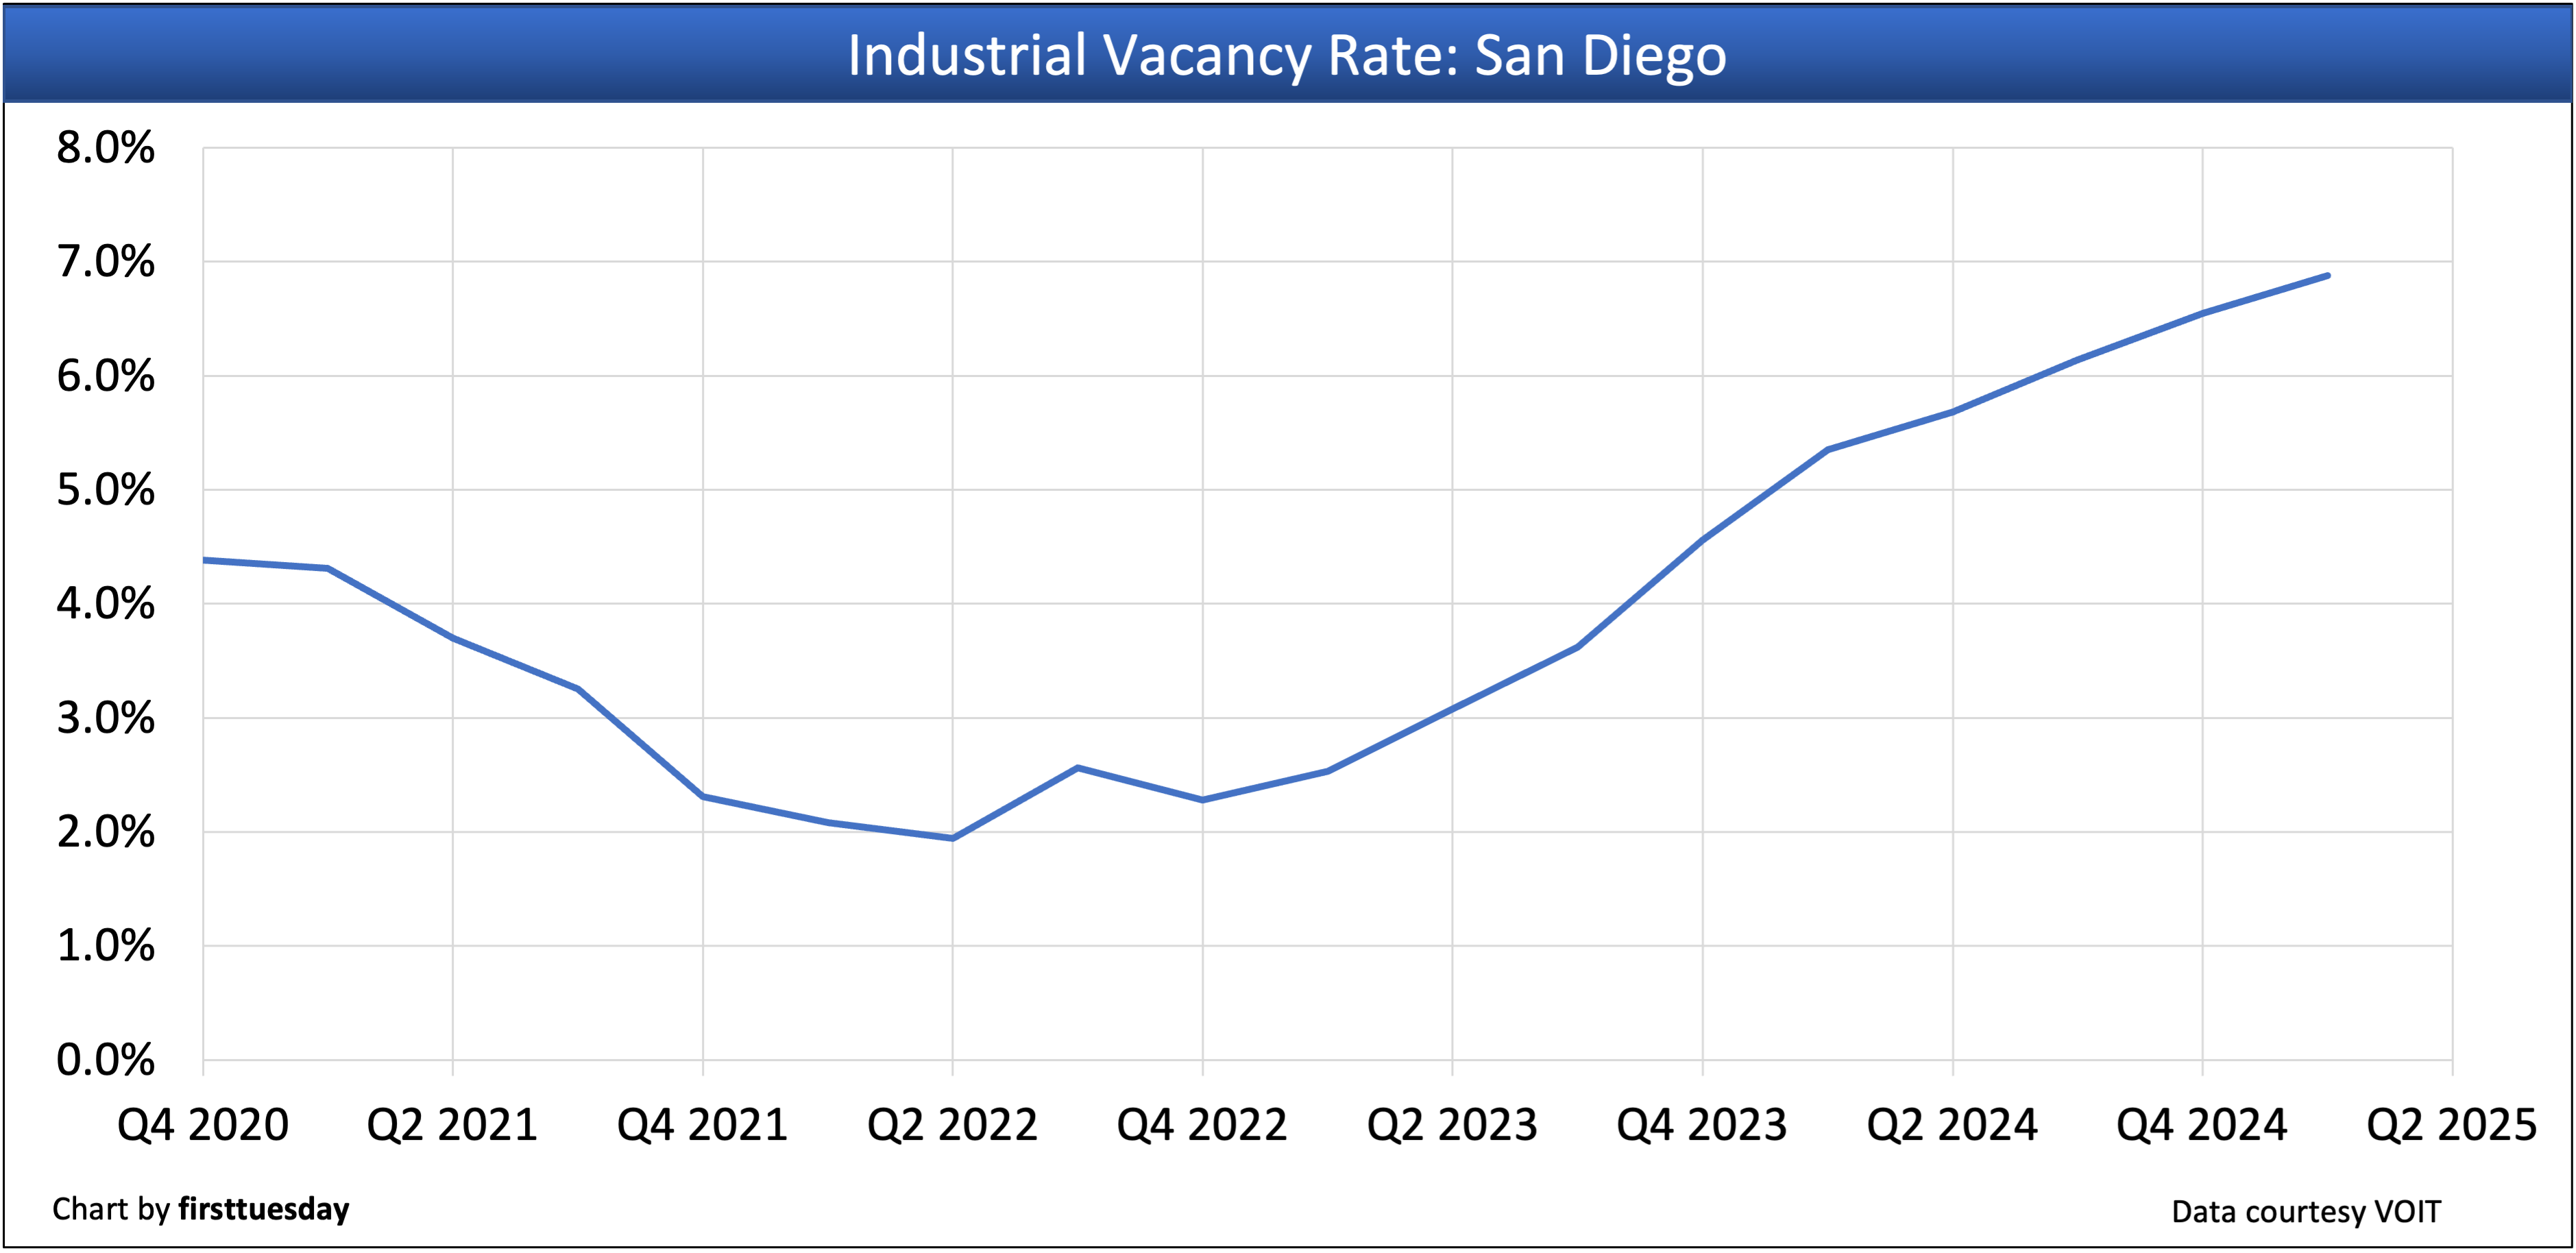
San Diego County’s industrial vacancy rate is:
- 6.88% in Q1 2025;
- up from 6.56% in Q4 2024; and
- above the vacancy rate of 5.38% in Q1 2024.
Conclusion: Vacancies are jumping from a year ago and tenants are not likely to make long-term decisions amid a global trade war. Worse, a return to international normalcy is not possible.
San Diego County’s industrial net absorption rate — the total change in occupied industrial space during the quarter — is:
- -210,779 square feet in Q1 2025;
- up from -266,289 square feet in Q4 2024; and
- up from -647,742 square feet in Q1 2024.
Conclusion: The pace of declining occupancy has steadied, and likely to mostly hold that level.
San Diego County’s office vacancy rate is:
- 13.83% in Q1 2025;
- up from 12.89% in Q4 2024; and
- above the vacancy rate of 12.23% in Q1 2024.
Conclusion: Notice that the pace of vacancies has accelerated.
San Diego County’s office net absorption rate — the total change in occupied office space during the quarter — is:
- +66,142 square feet in Q1 2025;
- up from -82,931 square feet in Q4 2024; and
- up from -498,780 square feet in Q1 2024.
Conclusion: Vacancies have not worsened recently.
San Diego County’s retail vacancy rate is:
- 4.17% in Q1 2025;
- up from 4.00% in Q4 2024; and
- slightly below the vacancy rate of 4.29% in Q1 2024.
Conclusion: The vacancy trend plateaued, but has the economy? Nope.
San Diego County’s retail net absorption rate — the total change in occupied retail space during the quarter — is:
- -356,079 square feet in Q1 2025;
- down from +229,001 square feet in Q4 2024; and
- up from -465,048 square feet in Q1 2024.
Conclusion: Volatilities are amazingly confusing for the future outlook. San Diego is highly dependent on federal stability.
Orange County — industrial and office
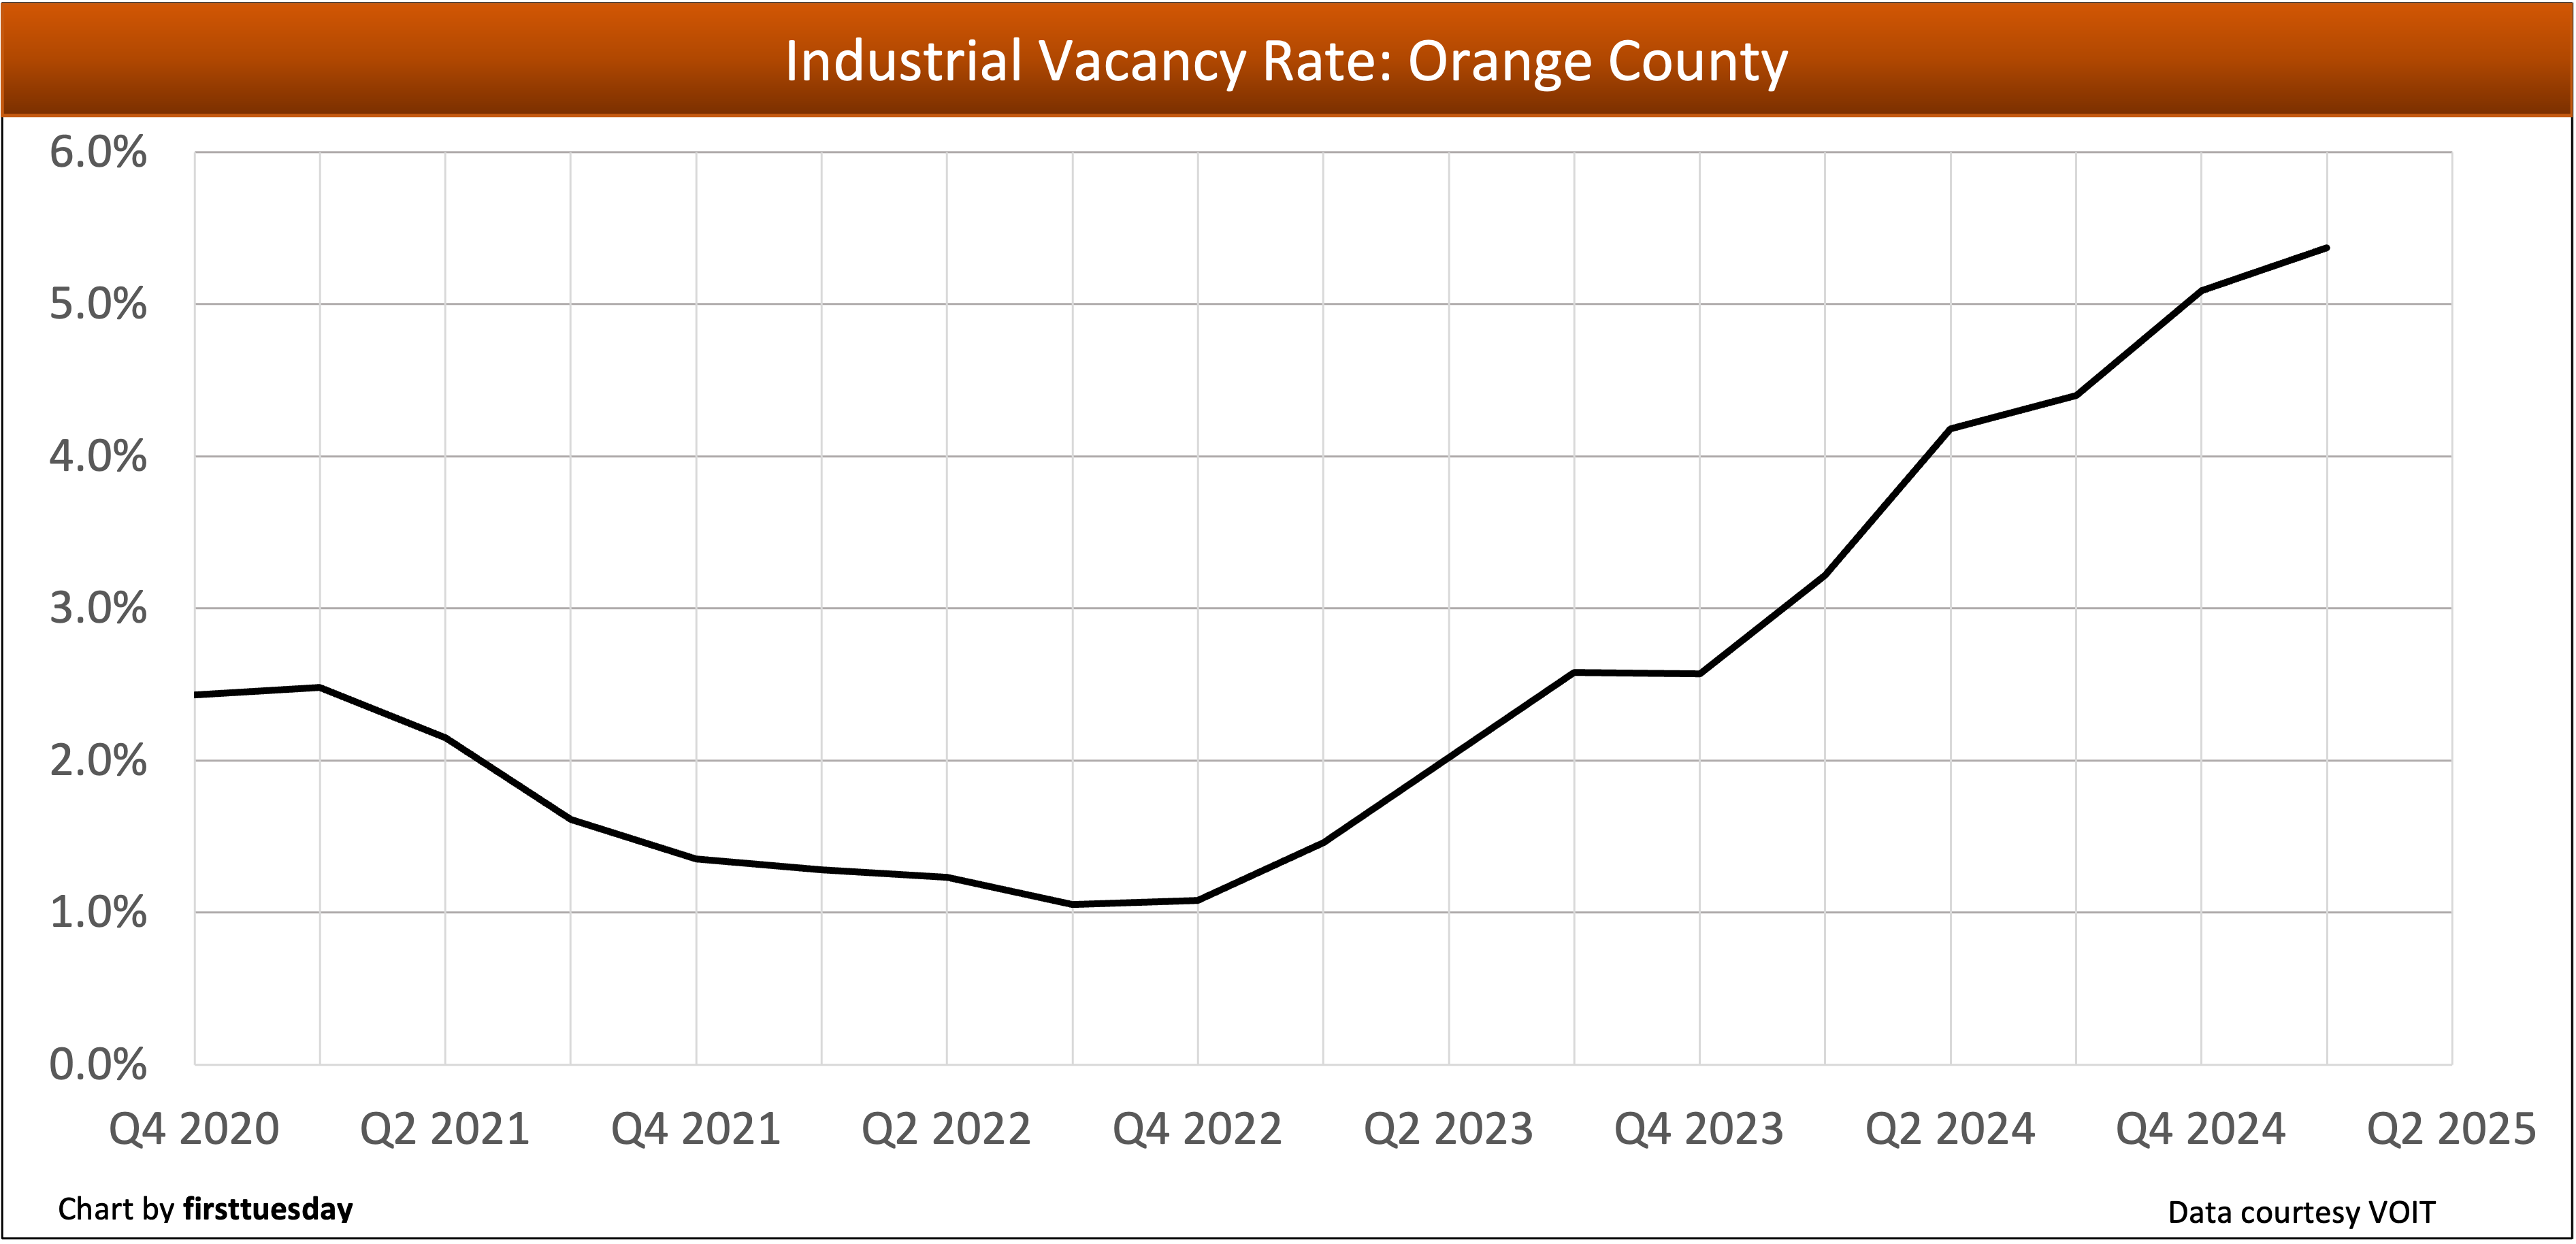
Orange County’s industrial vacancy rate is:
- 5.37% in Q1 2025;
- up from 5.09% in Q1 2025; and
- above the vacancy rate of 3.22% in Q1 2024.
Conclusion: Rising vacancies prompt rapid adjustments to curb exodus.
Orange County’s industrial net absorption rate is:
- -272,207 square feet in Q1 2025;
- up from -1,042,116 square feet in Q4 2024; and
- up from -949,396 square feet in Q1 2024.
Conclusion: More space is sought after but net absorption remains negative, showing uncertainty.
Orange County’s office vacancy rate is:
- 15.48% in Q1 2025;
- down from 16.07% in Q4 2024; and
- below the vacancy rate of 16.83% in Q1 2024.
Conclusion: Improvement in reduced vacancies now underway.
Orange County’s office net absorption rate is:
- -333,333 square feet in Q1 2025;
- down from -47,400 square feet in Q4 2024; and
- down from -207,467 square feet in Q1 2024.
Conclusion: Significant accumulating decrease in demand for Orange County space, a pricing issue.
Los Angeles County — industrial
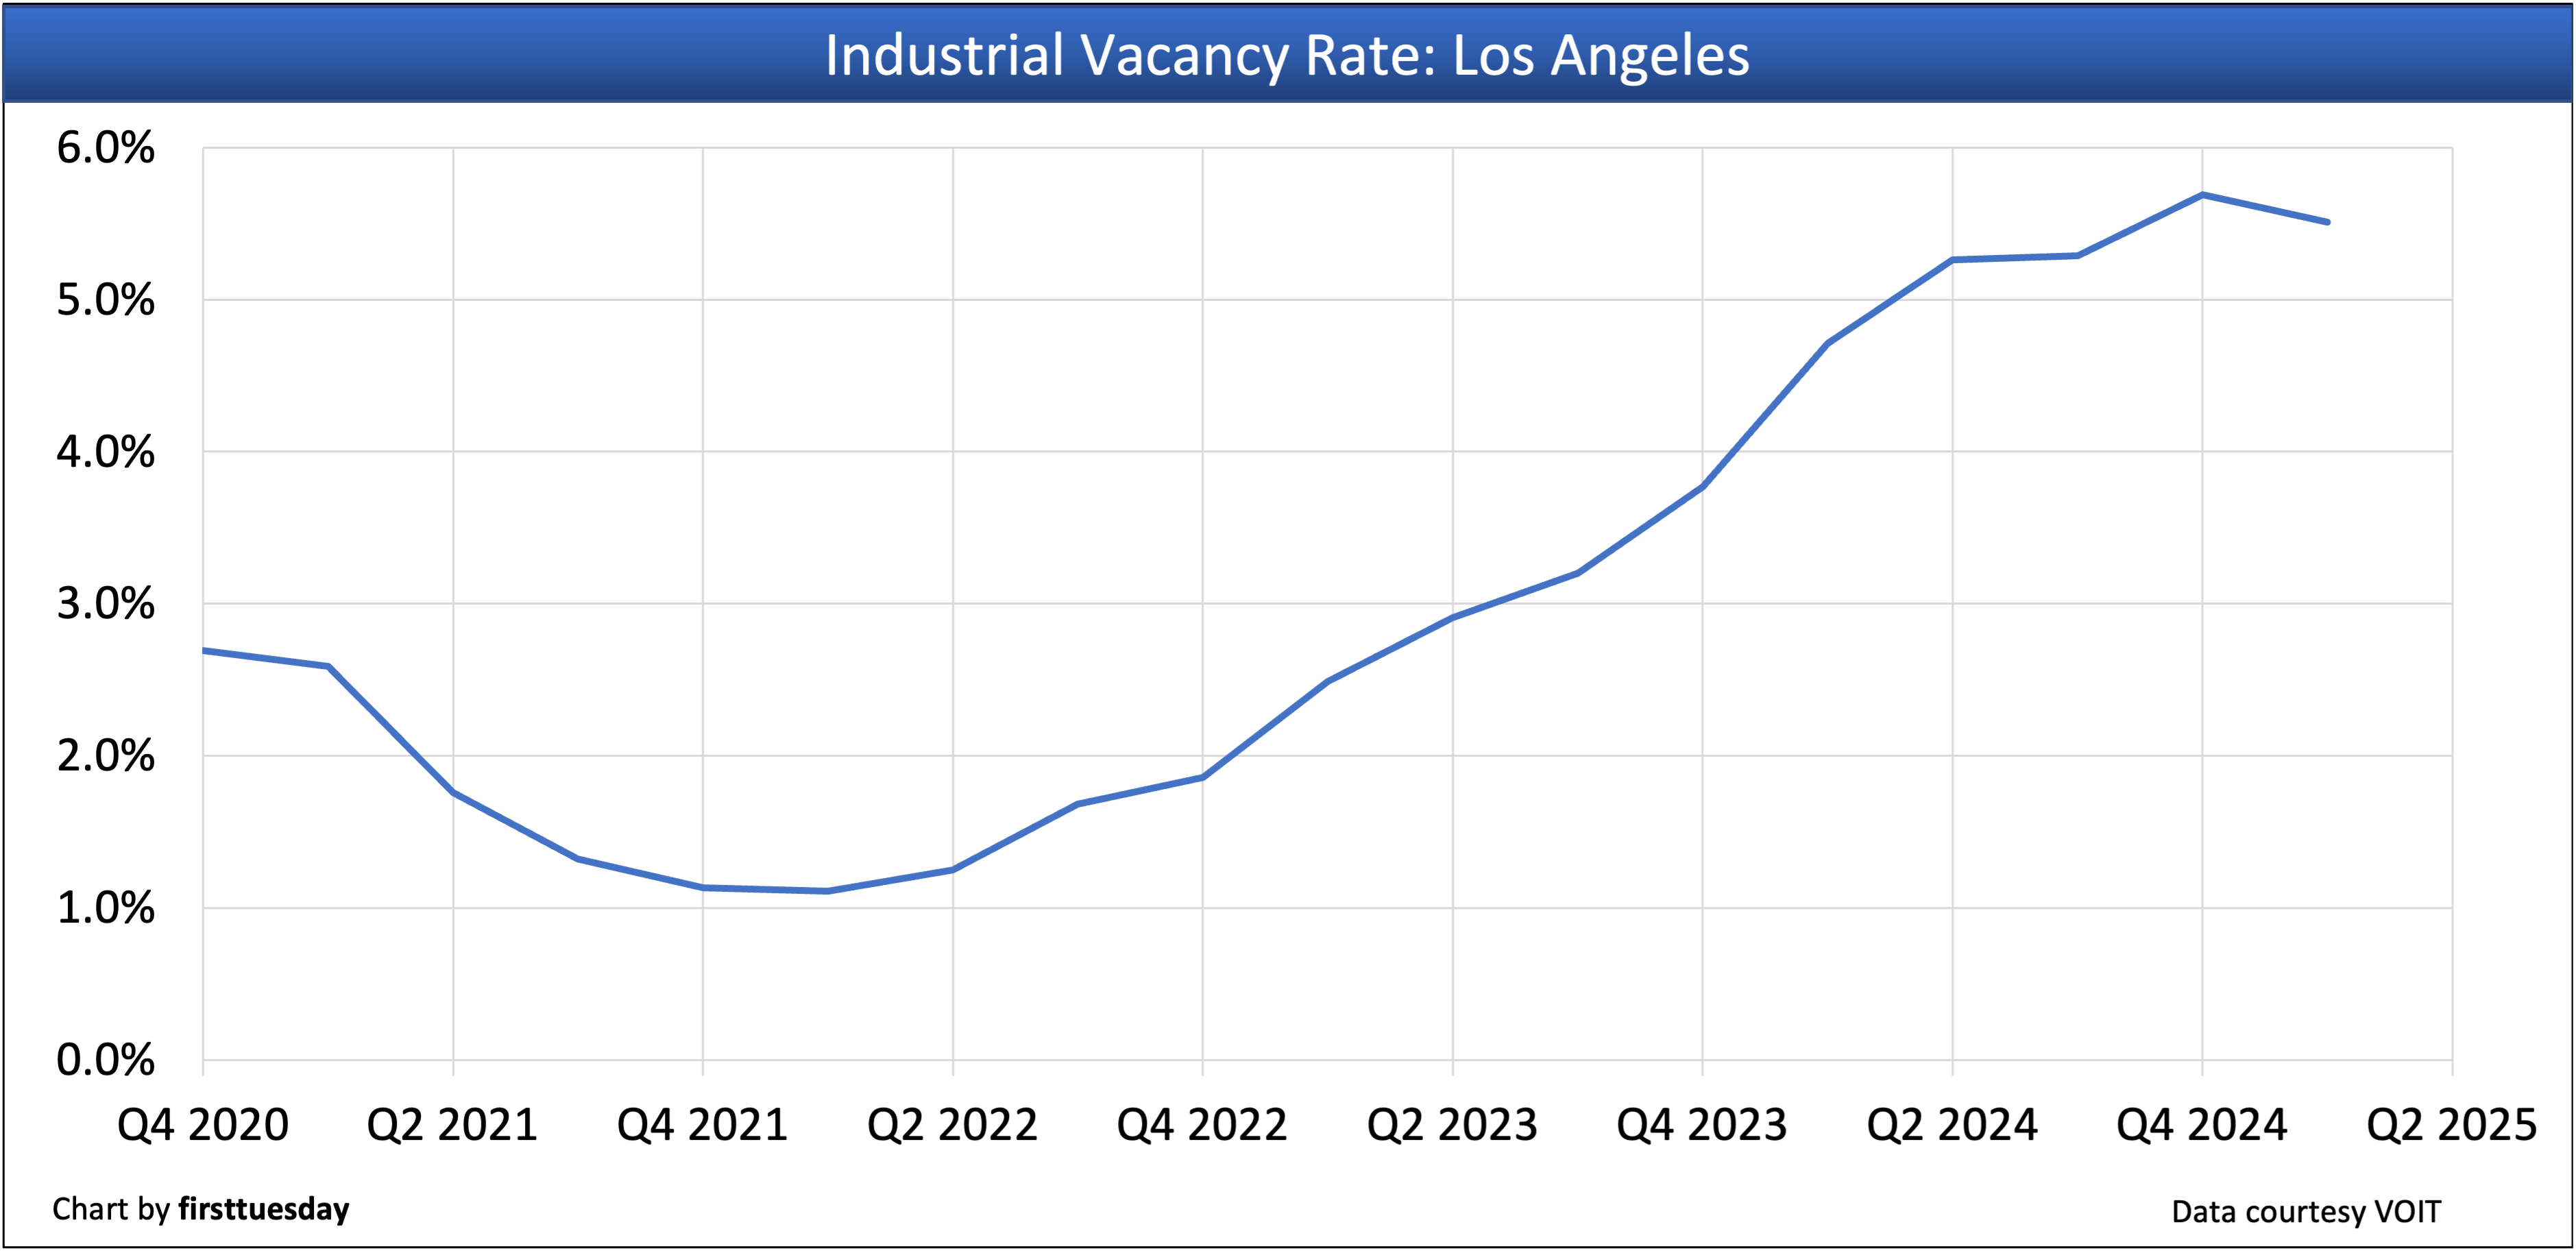
Los Angeles County’s industrial vacancy rate is:
- 5.51% in Q1 2025;
- down slightly from 5.69% in Q4 2024; and
- up from 4.71% in Q1 2024.
Conclusion: The plateau level is anticipated to change, as it represents a singular trade occurrence. It is likely to reflect future activities at the Port of Los Angeles.
Los Angeles County’s industrial net absorption rate is:
- +856,329 square feet in Q1 2025;
- up greatly from -1,671,492 square feet in Q4 2024; and
- up greatly from -3,870,528 square feet in Q1 2024.
Conclusion: Huge Q1 demand for vast inventory buildup, pre-tariff and temporary.
Inland Empire — industrial
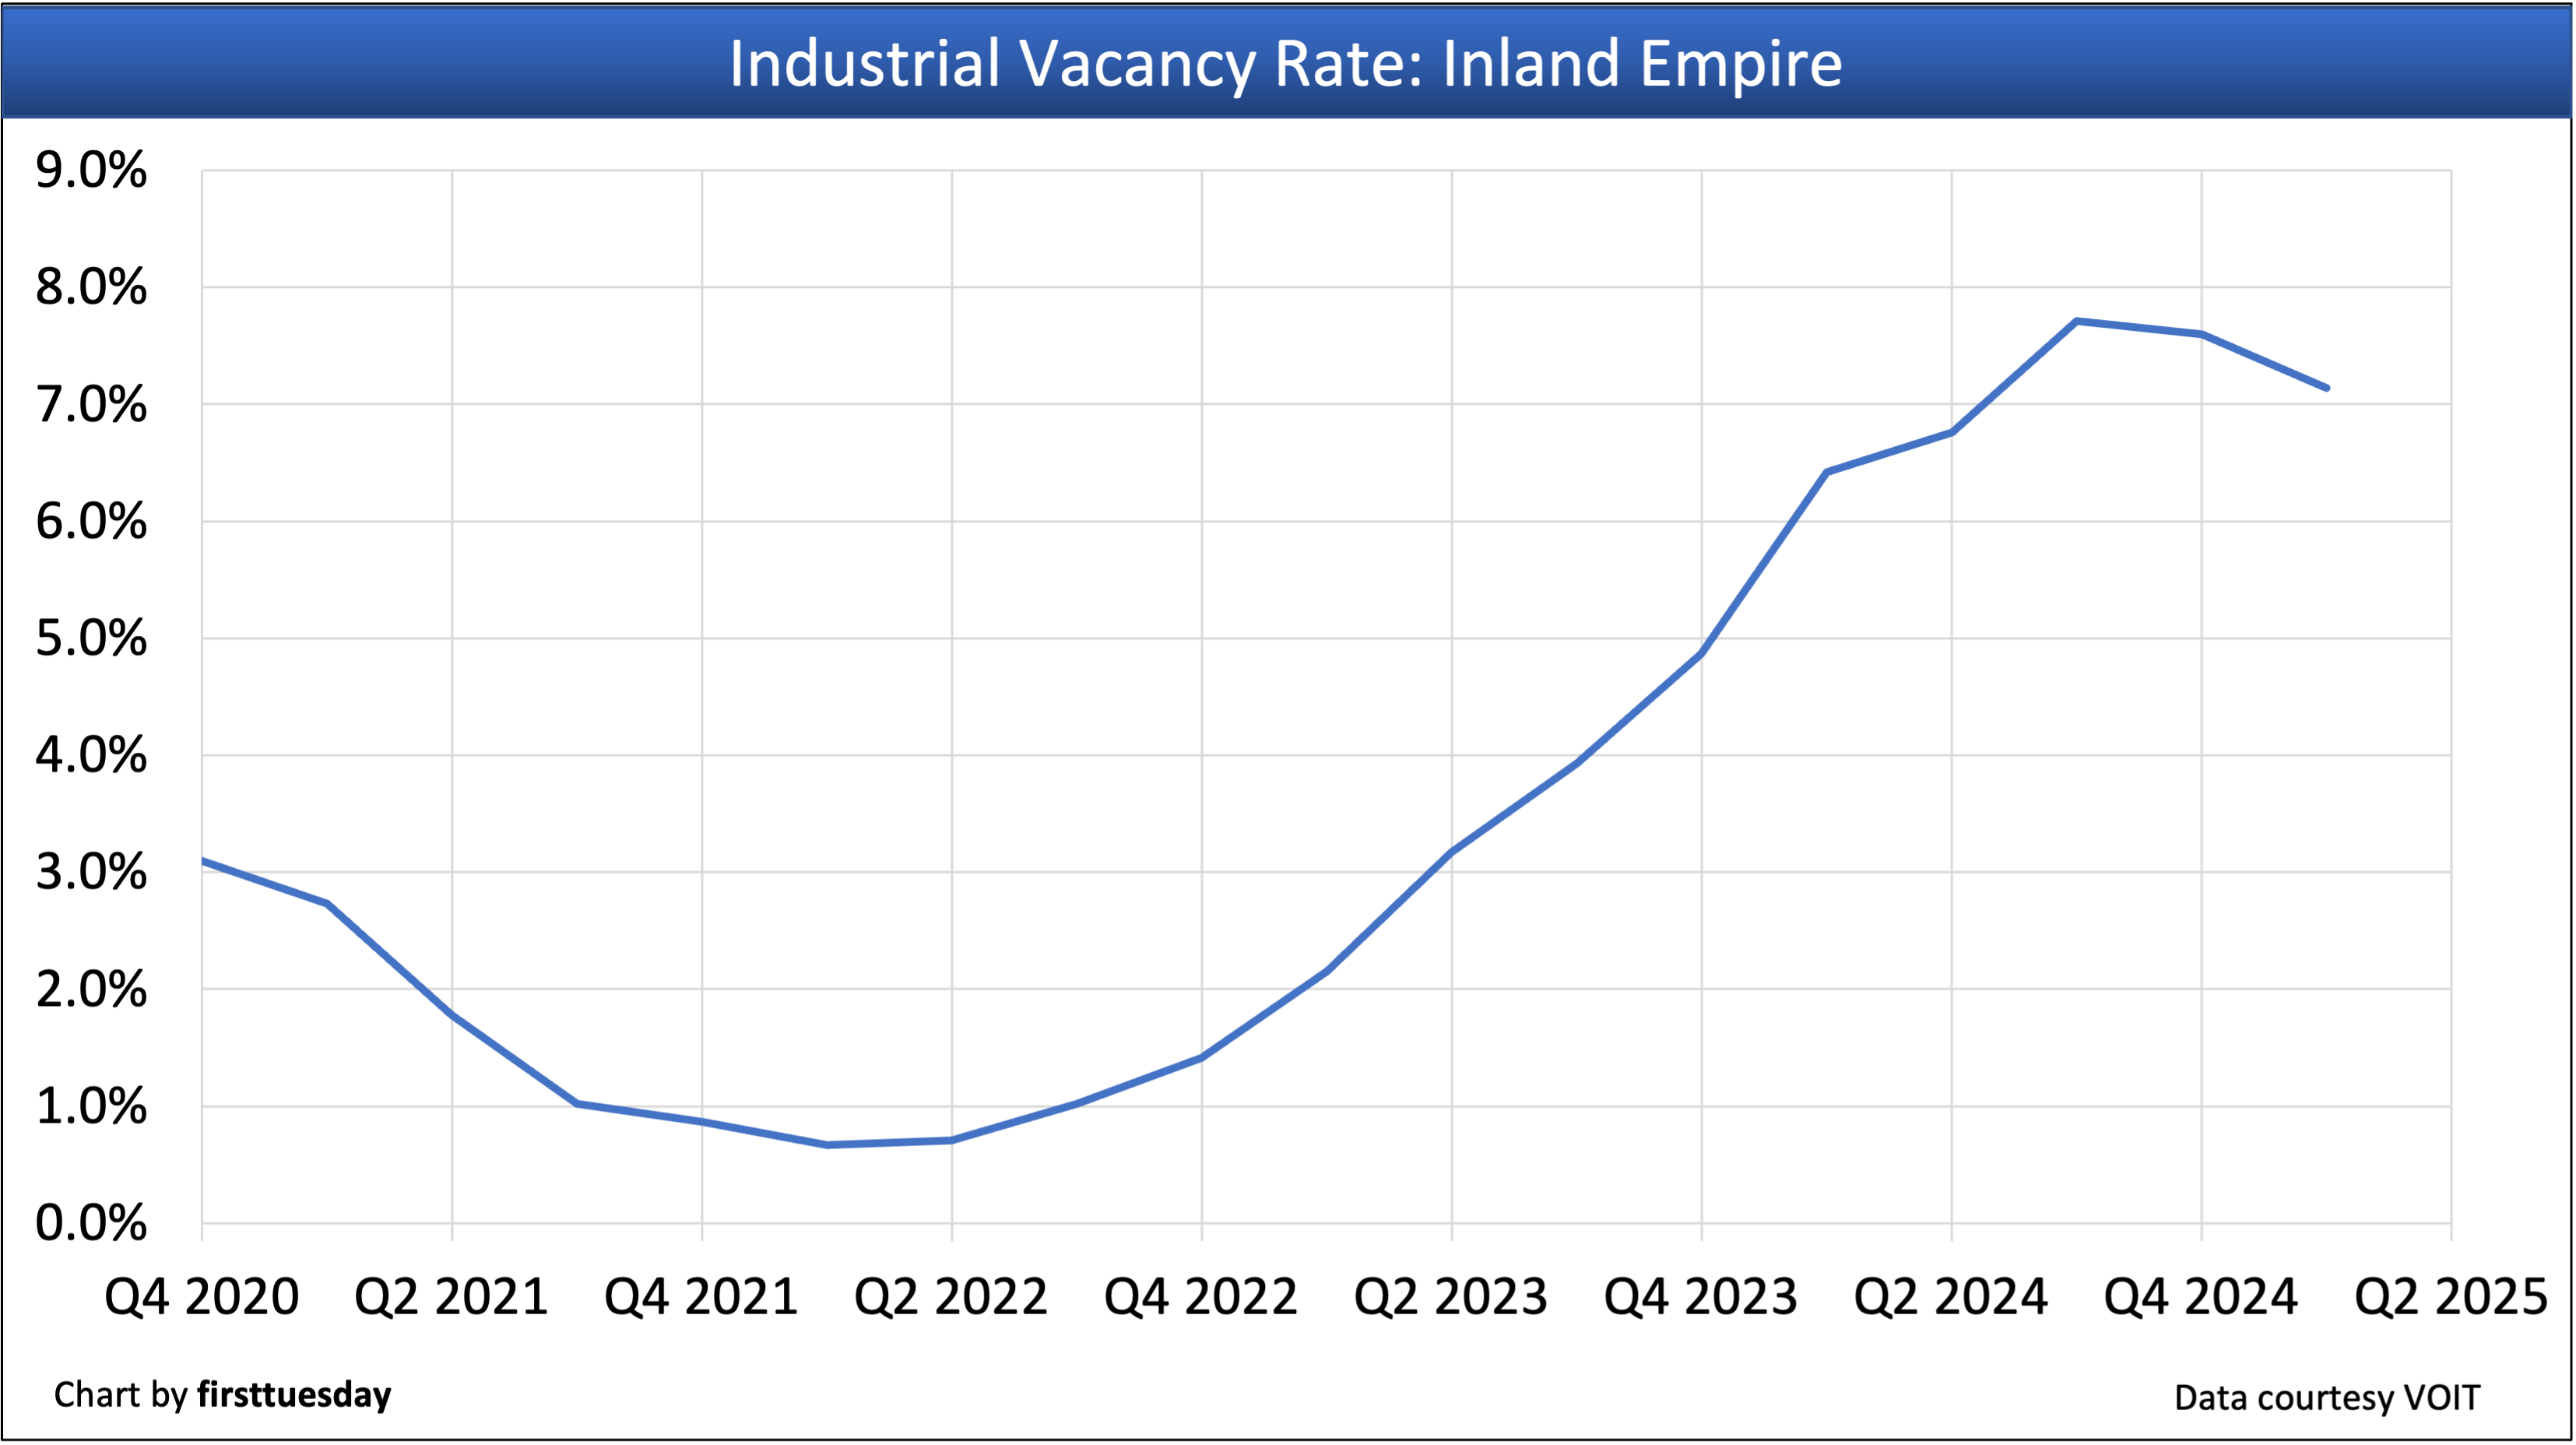
The Inland Empire’s industrial vacancy rate is:
- 7.14% in Q1 2025;
- down from 7.60% in Q4 2024; and
- above the vacancy rate of 6.92% in Q1 2024.
Conclusion: Competitive pricing achieved, but an issue with tariffs on Asia points to reduced need for space in SoCal.
The Inland Empire’s industrial net absorption rate is:
- +4,210,051 square feet in Q1 2025;
- down from +4,411,587 square feet in Q4 2024; and
- up greatly from -1,489,364 square feet in Q1 2024.
Conclusion: Pricing and space available filled a massive need as distributors built up inventories pre-tariffs.
Related articles:


