
California’s housing market in 2026 is gradually entering a more consistent but slowing economic phase on exiting the chaotic pandemic-era real estate market. However, it is important to note Los Angeles’s housing market never fully recovered from the 2008 recession. Home sales volume remained low throughout the elongated recovery of the 2010’s to present, alongside modest job creation.
As a catalyst for occupant turnover needed for fee generating transactions, a full jobs recovery based on population gain in LA was finally achieved in 2019, just in time for the pandemic upheaval to hit in 2020.
But in 2020, the pandemic economy overran what was to be a recession for curing excesses in the prior years, blocking out the caution, efficiencies and creativity a recession induces in most business. Mortgage rates plunged to historic lows as the Federal Reserve stepped up to fund the entire mortgage-backed bond market. Readily abundant low-cost mortgage funds provided rocket fuel for home sales — and prices — until the pandemic economy was ended as abruptly as it began. Mortgage rates doubled and then some in early 2022 from the prior year as funding returned to Wall Street bond market managers.
In light of pandemic-era job losses and extensive uncertainty about the direction of the economy, low mortgage rates and fast rising prices in 2020 and 2021 did not induce homeowners to sell, as expected. A legitimate caution swept the real estate market out of concern for finding a replacement home as turnover of ownership dwindled and new construction lagged badly.
This resulted in a strangled MLS inventory which accelerated property prices to even greater unsustainable heights. By 2026, inventory was at its highest since the 2020 recession, reflecting slowing demand and reduced sales as owners chose to continue selling. Prices have given indication they are going to slip in 2026, except for the cyclical spring bounce in homebuyer demand.
Expect sales volume for all types of property to continue to slip annually, the trend in sales volume since the peak in mid-2022. When declining prices next bottom, it will likely be around 2027 or 2028, followed quickly by an initial arrival of speculators and investors providing a short term pick up in sales volume and a price bump. Only then as prices again start to rise will buyer-occupants sense a bottom to prices has developed and return to buy, as they do in every recovery period.
Mortgage rates are expected to trend upward in the decade ahead, putting downward pressure on prices as rates rise. Home sales volume follows the pace of price decline when mortgage rates remain high or trend higher. Thus, the long-term price outlook for Los Angeles mirrors the rest of the state, with the price inflation of 2020-21 induced by artificially low mortgage rates now long past.
View the Los Angeles regional charts below for details on current activity and forecasts for its housing market.
Updated June 24, 2026. Original copy posted March 2013.
Home sales volume remains low
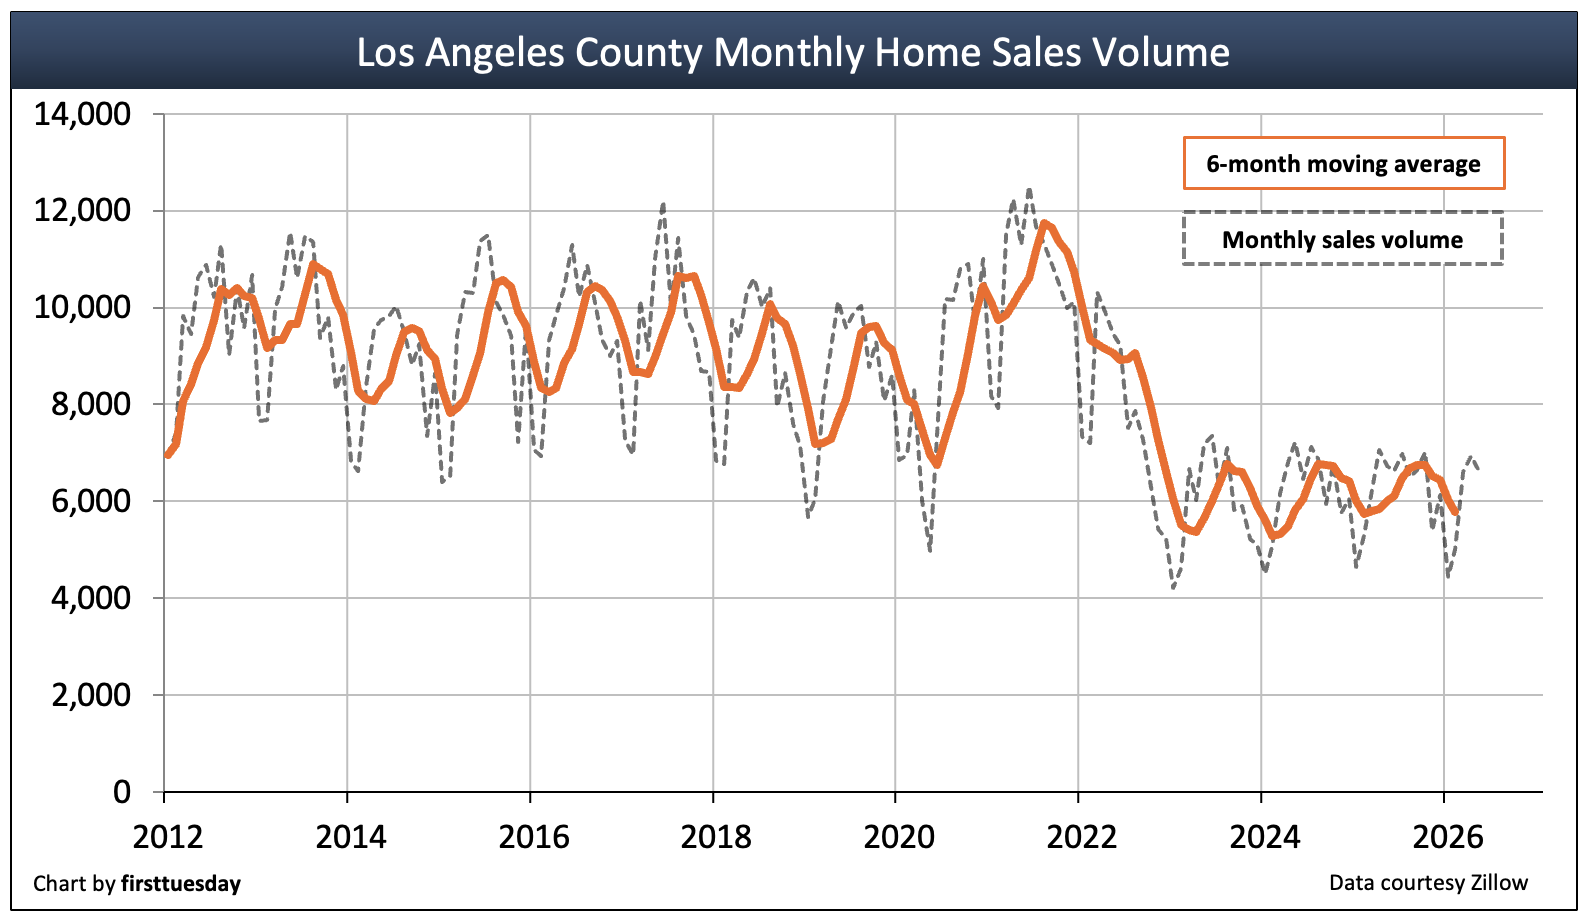
Chart update 06/24/26
| 2025 | 2024 | 2003: Peak Year | |
| Los Angeles County home sales volume | 50,000 | 49,900 | 125,900 |
Los Angeles County home sales volume received a boost in 2020 from record-low mortgage interest rates, which propped up buyer interest, as well as home prices. Buyer fear of missing out (FOMO) on an acquisition in a fast-reducing inventory of property available for sale further propelled home sales volume during 2021. In total, 2021 home sales volume leaped a whopping 26% above the prior year. The excess buyers in 2021 were mostly cannibalized from the population who were positioned to buy in 2022.
Thus, the rising trend quickly reversed course in 2022, ending the year 25% below 2021’s sales volume. Dragged down by rapidly rising mortgage rates and waning enthusiasm from homebuyers over sky high pricing, sales volume remained flat in 2025, now trending flat-to-down in 2026. Compared to the last “normal” year for home sales volume, 2025 was 27.5% below 2019.
Year-to-date, sales volume in LA County is down 1% from 2025 as of May 2026.
A complete recovery for LA county of around 110,000 annual home sales will likely occur in the years following 2028, when user demand in Los Angeles County will be buttressed by a full labor market recovery. Residential construction starts will increase dramatically to help fill buyer demand as cities within the county finally open up the permit process in urban centers.
Inventory climbs
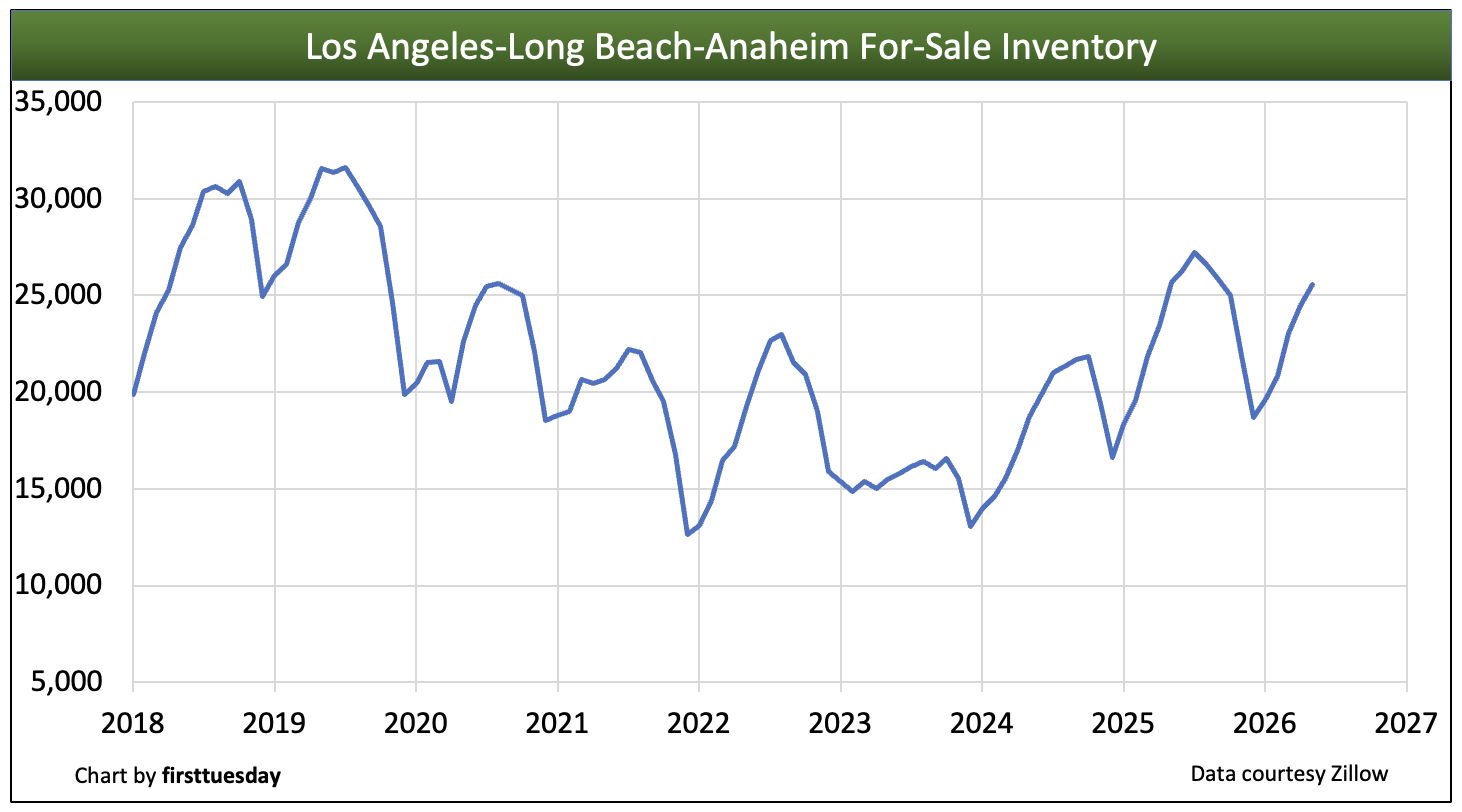
Chart update 06/24/26
| May 2026 | May 2025 | Annual change | |
| LA County for-sale inventory | 25,600 | 25,700 | -0.4% |
Inventory of homes available for sale has risen from the historic low reached at the end of 2021. After plateauing in 2023, for-sale inventory in the Los Angeles metro area increased 28% in 2024 and another 12% in 2025. The winter months typically see the lowest inventory of homes for sale, peaking around mid-year.
Looking forward, expect for-sale inventory to continue to grow in the remainder of 2026 and into 2027. As for-sale inventory increases due primarily to greater lengths of time on the market, sellers are forced to reduce pricing to bring mortgage-funded homebuyers back to the broker offices to acquire property.
As the Fed’s fight to reduce consumer inflation while maintaining current employment levels is now an irregular process, indicators point to a continuing downturn in the housing market until the 2028 period, a condition homebuyers seem well aware of. The seller’s market built up in the last recovery fully reversed by mid-2022, a process which began in 2013 with the beginning of the 30-year half cycle of generally rising long-term interest rates such as charged on fixed rate mortgages.
In today’s tumultuous markets, homebuyers increasingly take a wait-and-see approach to buying a home until they determine market conditions reflect no further home price reduction. Declining prices only expand the reservoir of ready and able buyers stalled by their wait-and-watch routine, until suddenly they all become willing to jump in once prices bottom and hold.
Related article:
Turnover is down
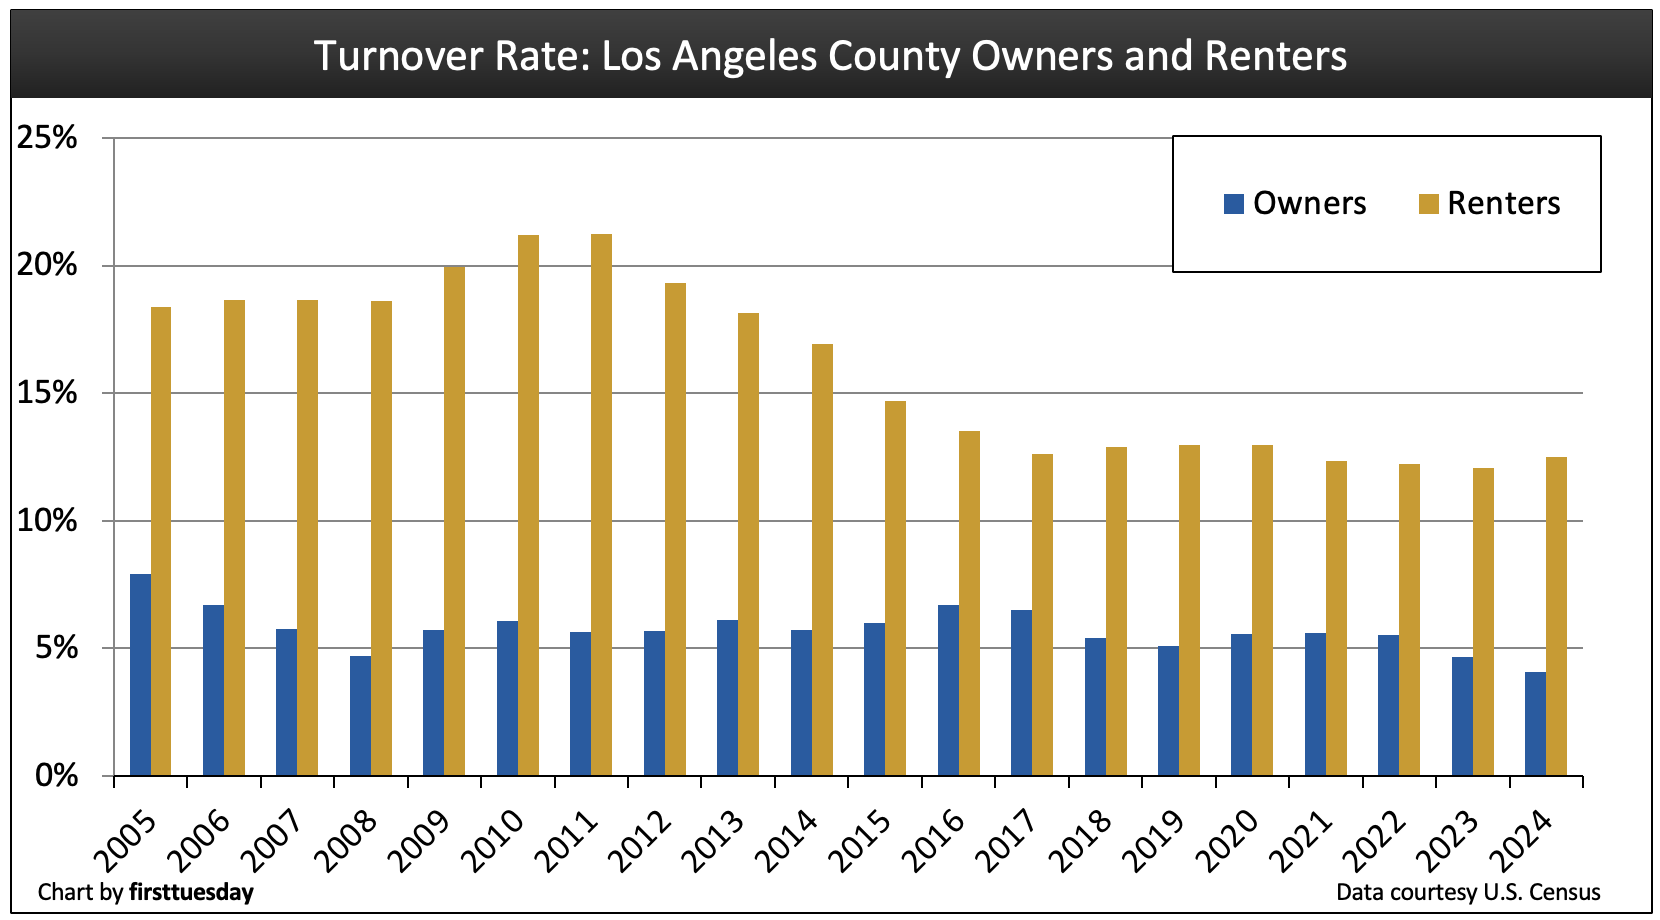
Chart update 12/29/25
| 2024 | 2023 | 2022 | |
| Los Angeles County homeowner turnover rate | 4.1% | 4.7% | 5.5% |
Los Angeles County renter turnover rate | 12.5% | 12.1% | 12.2% |
Home sales volume depends in large part on homeowner and renter turnover. The number of people moving from their residence each year is indicative of both the willingness and ability of homeowners and renters to relocate. Turnover rates are highest when jobs are abundant, wages are rising faster than consumer inflation, housing starts are increasing and employee confidence in the economy is high. 2025 is not providing forward resilience for any of these factors.
The most recent trough in Los Angeles’ homeowner turnover rate was during 2008, when California was at the depths of the Great Recession. The number of homeowners relocating increased in the immediately following years, mostly due to turnover brought on by foreclosures and short sales.
LA homeowner turnover was relatively high in 2021 with one in 18 homes selling annually. Still, this is below the peak year of 2005 when one in 12 homes sold. Today’s home sales turnover rate is once every 22 years, and the ownership period before selling is edging longer.
Despite bounces in both sales volume and prices in 2021, much of this activity was fueled by absentee homeowners – investors – rather than owner-occupants relocating. Thus, homeowner turnover decreased each year from 2022-2024.
Expect a consistent increase in the frequency of turnover to arrive in 2027-2028. Legislative efforts to force cities and counties to greatly increase the permitting of residential construction will eventually increase housing starts. Further, after we pass through the remainder of the current real estate recession, which started in mid-2022 and persists in 2025, and is likely to continue into 2027, LA will experience an economic recovery for real estate sales and leasing transactions for all types of property.
This upturn will also be fueled by a Great Convergence of first-time homebuyers (Millennials and members of Generation Z forming households), retiring Boomers buying replacement homes and increased for-sale inventory generated primarily by construction starts. Short sales and REO resales due to mortgage defaults will be in the mix as job losses set in. Domestic and international emigrants will continue to play a significant if not enhanced role in the county’s periphery housing — the suburbs.
Homeownership bottoms as home starts falter
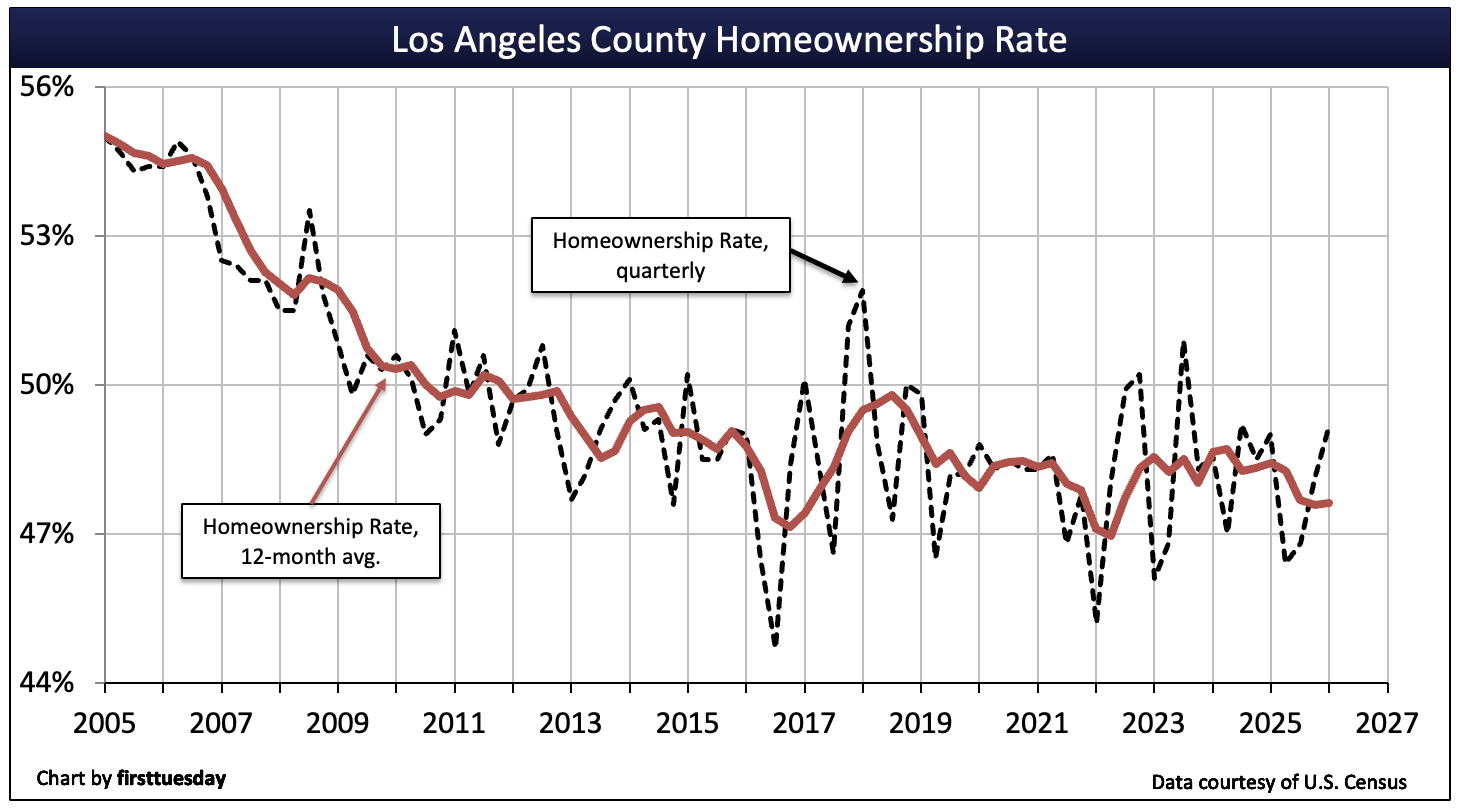
Chart update 06/24/26
| Q1 2026 | Q4 2025 | Q1 2026 | |
| Los Angeles County homeownership | 49.2% | 48.1% | 49.0% |
The homeownership rate in Los Angeles County trended downward from the time the Millennium Boom ended in 2007 to its lowest point of 45% in Q3 2016. As of Q1 2026, Los Angeles County’s low homeownership rate continues to falter, now at 49.2%.
The rate will likely remain low, varying slightly from quarter-to-quarter, until the years following 2027. In the meantime, high FRM rates and faltering prices will drive some owners into forced sales, instilling a wait-and-see attitude among buyer-occupants.
LA County’s homeownership rate has historically been lower than the state average, which was 55.7% in Q1 2026. LA County has a smaller share of homeowners since much of the county is urbanized. Renting is a convenience necessary for job mobility of the skilled and educated, if not a financial necessity. While low for the state, LA’s homeownership rate today is roughly level with what may be considered a “normal” rate for the region, of around 48%.
The rise and fall of home pricing
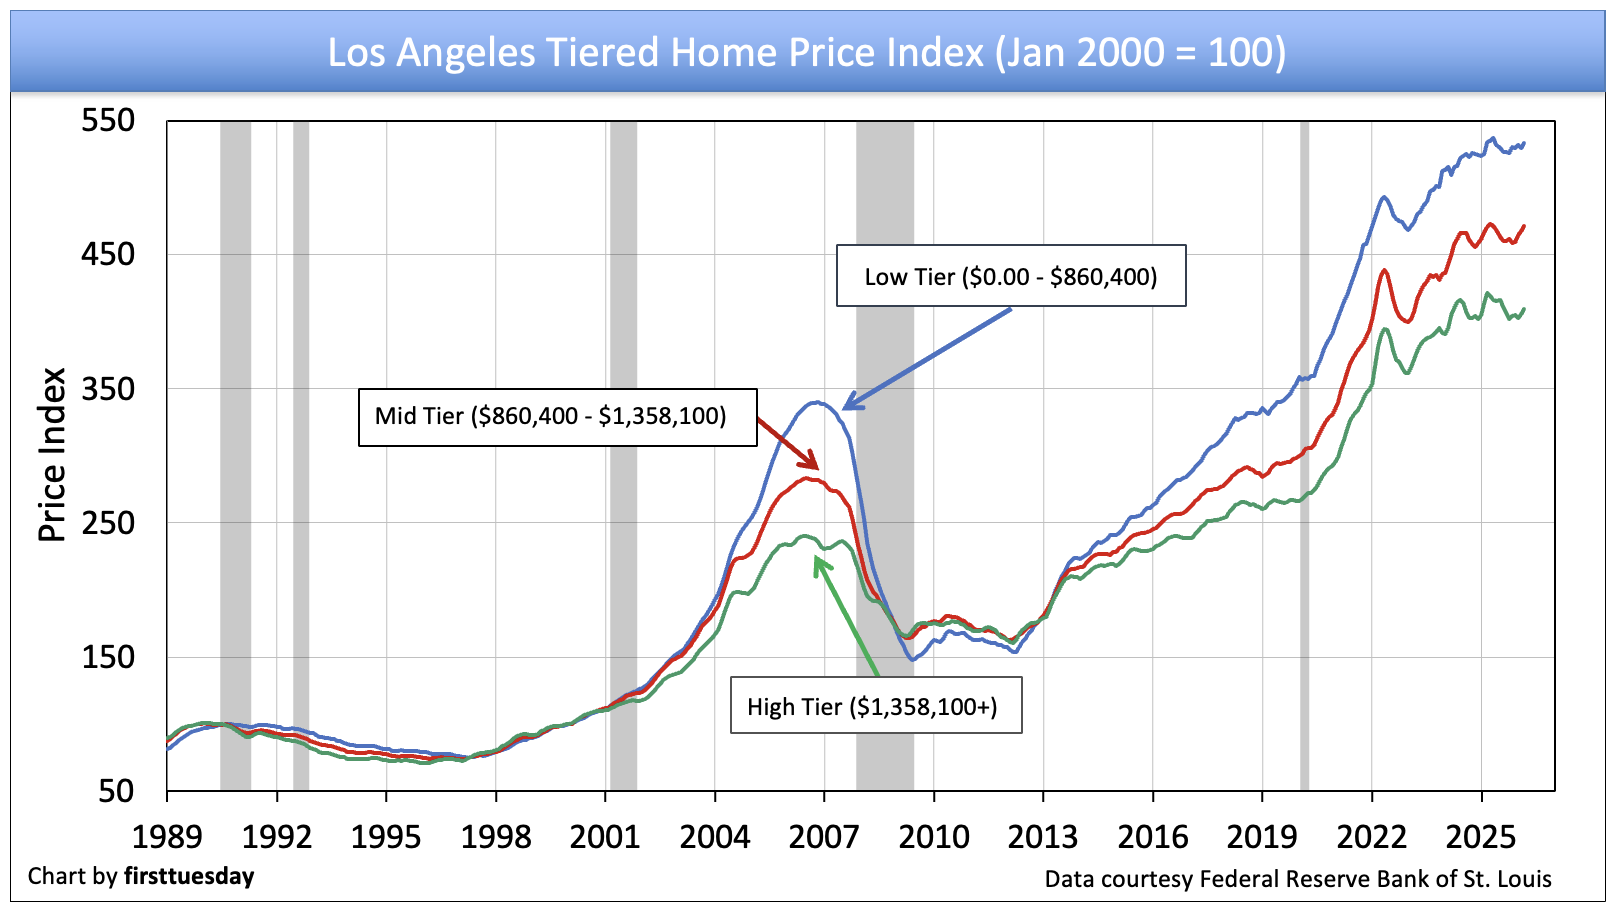
Chart update 06/24/26
| Low-tier annual change | Mid-tier annual change | High-tier annual change | |
| Los Angeles County home pricing index: Mar 2026 | -0.3% | +0.2% | -2.8% |
Home prices increased rapidly in Los Angeles during the fast-moving pandemic market of 2020-2021. However, while prices rose quickly, they fell nearly as fast after peaking in May 2022. However, this steep 2022 price drop was interrupted in 2023 as a brief spring bounce plateaued prices. The remainder of 2023 and throughout 2024, home prices experienced a slow steady rise as inventory for sale declined. As of March 2026, home prices had declined to roughly level with a year earlier in the low- and mid-tiers, and slightly lower in the high tier.
In 2020-2021, historically low mortgage rates, roughly equivalent to the trough of cyclically low mortgage rates in 2013, provided a boost for buyer purchasing power. Artificially low interest rates, along with competition for a dwindling inventory of homes for sale for lack of owner turnover, inflated home prices and sales volume in 2020-2021. Then mortgage rates jumped, doubling by mid-2022, causing a debilitating cut to buyer purchasing power and downward pressure on home prices.
A forecast of price expectations in 2026 is a risky call due to the lack of any certainty about economic conditions in California, the U.S. and globally.
That said, sales volume will likely diminish as caution sets in over the uncertainty surrounding financial decisions in the foreseeable future. All markets are nonplused and running with abandonment of fundamentals, which will reinstate themselves eventually. For real estate, price movement will depend on the quantity of owners needing to sell their property, which generally depends on the level of jobs. Since the economic factors in play, as managed by state and national governments, suggest a recession-like turndown in 2026 due to a decline in jobs, expect property prices to follow and fall.
Construction starts feed on rental demand
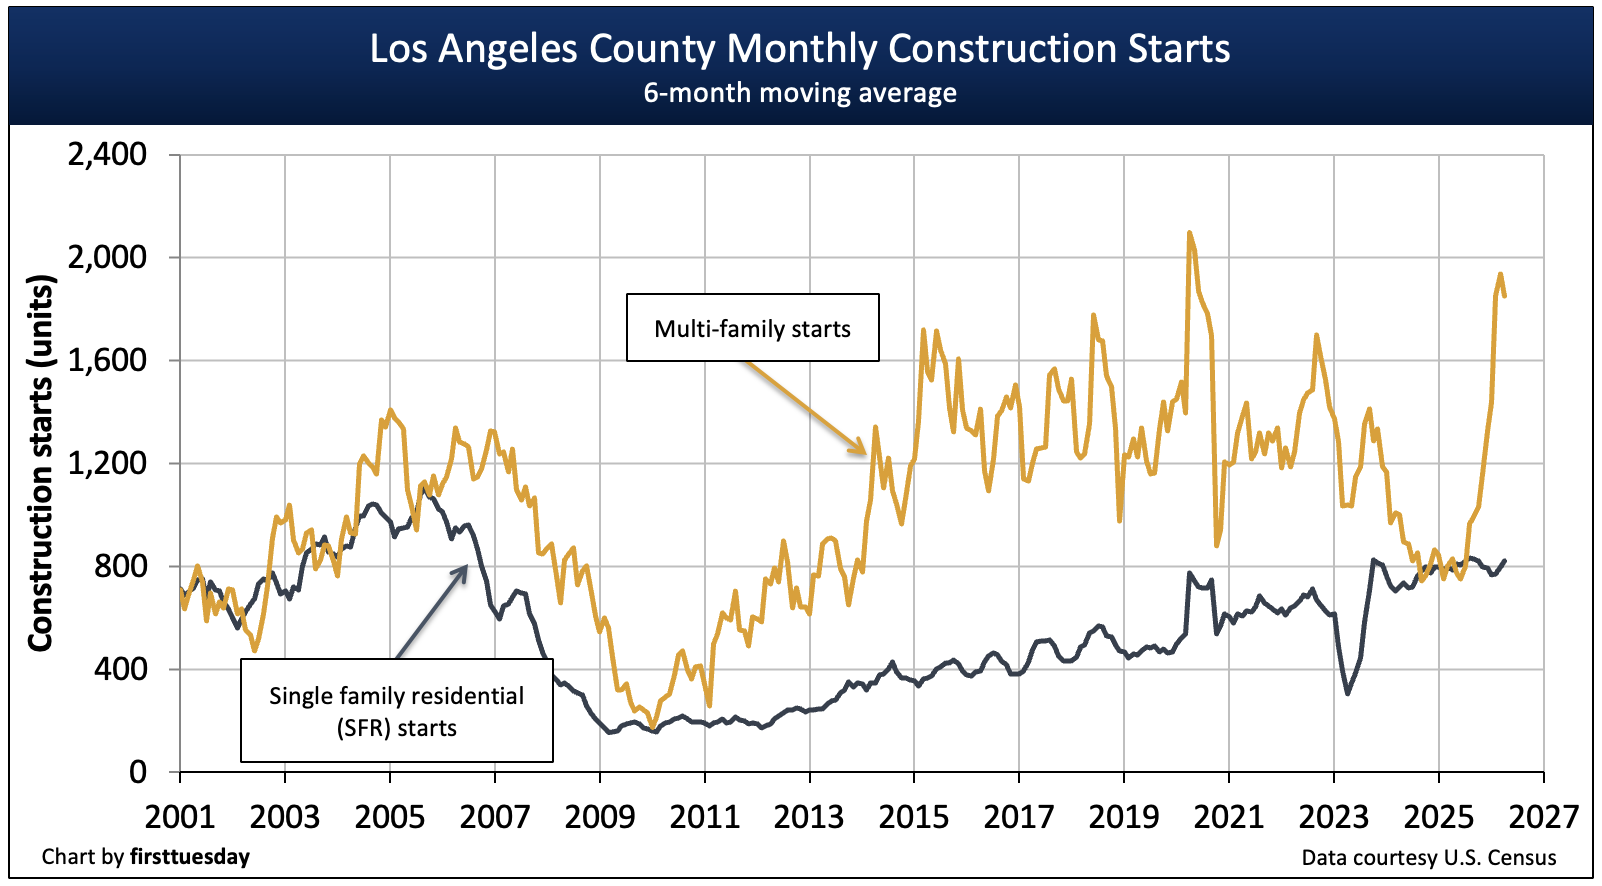
Chart update 06/24/26
| 2025 | 2024 | 2023 | |
| Los Angeles County single family residential (SFR) starts | 9,600 | 9,100 | 7,100 |
Los Angeles County multi-family starts | 12,500 | 10,500 | 14,000 |
Single family residential (SFR) construction starts increased during 2025 in Los Angeles while multi-family construction starts plummeted. SFR starts increased 6% over the prior year while multi-family increased 19%. While SFR starts continue a long upward trend since bottoming in 2009, multi-family starts are more volatile, experiencing wide swings from month to month.
Looking back, multi-family construction starts jumped significantly in Los Angeles County at the outset of the recovery following the 2008 recession, far outpacing the near-flat trend in single family residential (SFR) starts. This was due to the increased demand for rental housing, evidenced by the steep rise in rents, especially in the urban city-center areas of Los Angeles County. Builders know this, the City of Los Angeles is accommodating and lenders are catching on.
However, the multi-family recovery ended in 2020, falling dramatically heading into 2021. This steep decline was partly the result of shelter-in-place orders in response to the COVID-19 pandemic, and also due to cautious lenders and builders. The fall back in new residential construction continued in 2021, held back by labor and supply shortages, with a steep drop in early 2023.
The next peak in SFR construction starts will likely occur in the post-2027 period due to a boost from state legislation and an expected upturn in transactions – both sales and rentals. Even then, SFR starts will not return to the mortgage-driven peak experienced during the Millennium Boom. However, multi-family housing starts in the next upturn will experience higher levels as last seen in the mid-1980s, which then accommodated the arrival of Baby Boomers to the home ownership market.
This time, the need for multi-family housing, as well as SFRs, will be fueled by their Gen Y children — Millennials. Their income will accelerate as they age and they will upgrade their housing accommodations, no differently than did the Baby Boomers in the early 1990s.
More jobs needed
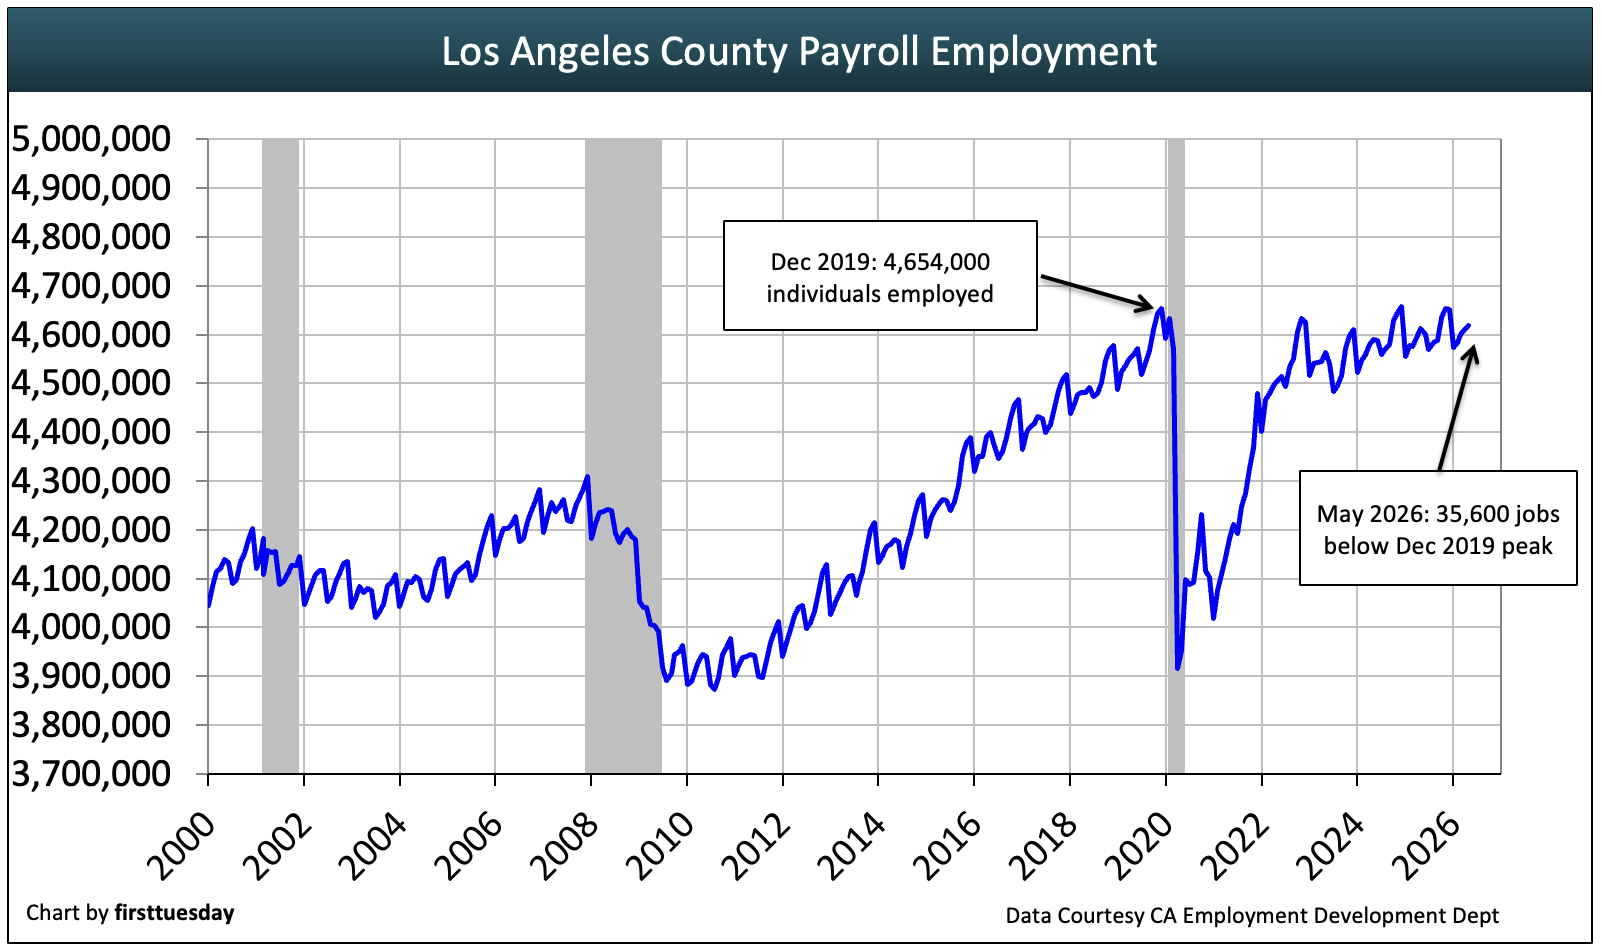
Chart update 06/24/26
| May 2026 | May 2025 | Annual change | |
| Los Angeles County employment | 4,618,4 | 4,611,500 | +0.2% |
Since homeowners and renters require employment to make housing payments (with wealth exceptions), a growth in job numbers is key to a starts-and-sales housing recovery. Over 4.6 million people were employed in Los Angeles County as of May 2026. This is very slightly higher than a year earlier, and just below LA’s December 2019 pre-recession/pandemic peak, with recovery progress continuing to wane monthly.
From the December 2019 peak to the April 2020 trough, Los Angeles lost 738,000 jobs. Since then, most jobs were recovered, though LA is still short over 3,000 jobs from the pre-pandemic peak. Los Angeles is the last major metro in California to achieve a full jobs recovery from the pandemic. Expect the jobs recovery to continue its faltering progress, rising and falling, not to enter a true recovery until after property prices bottom and start to consistently rise.
Jobs by top employing industry
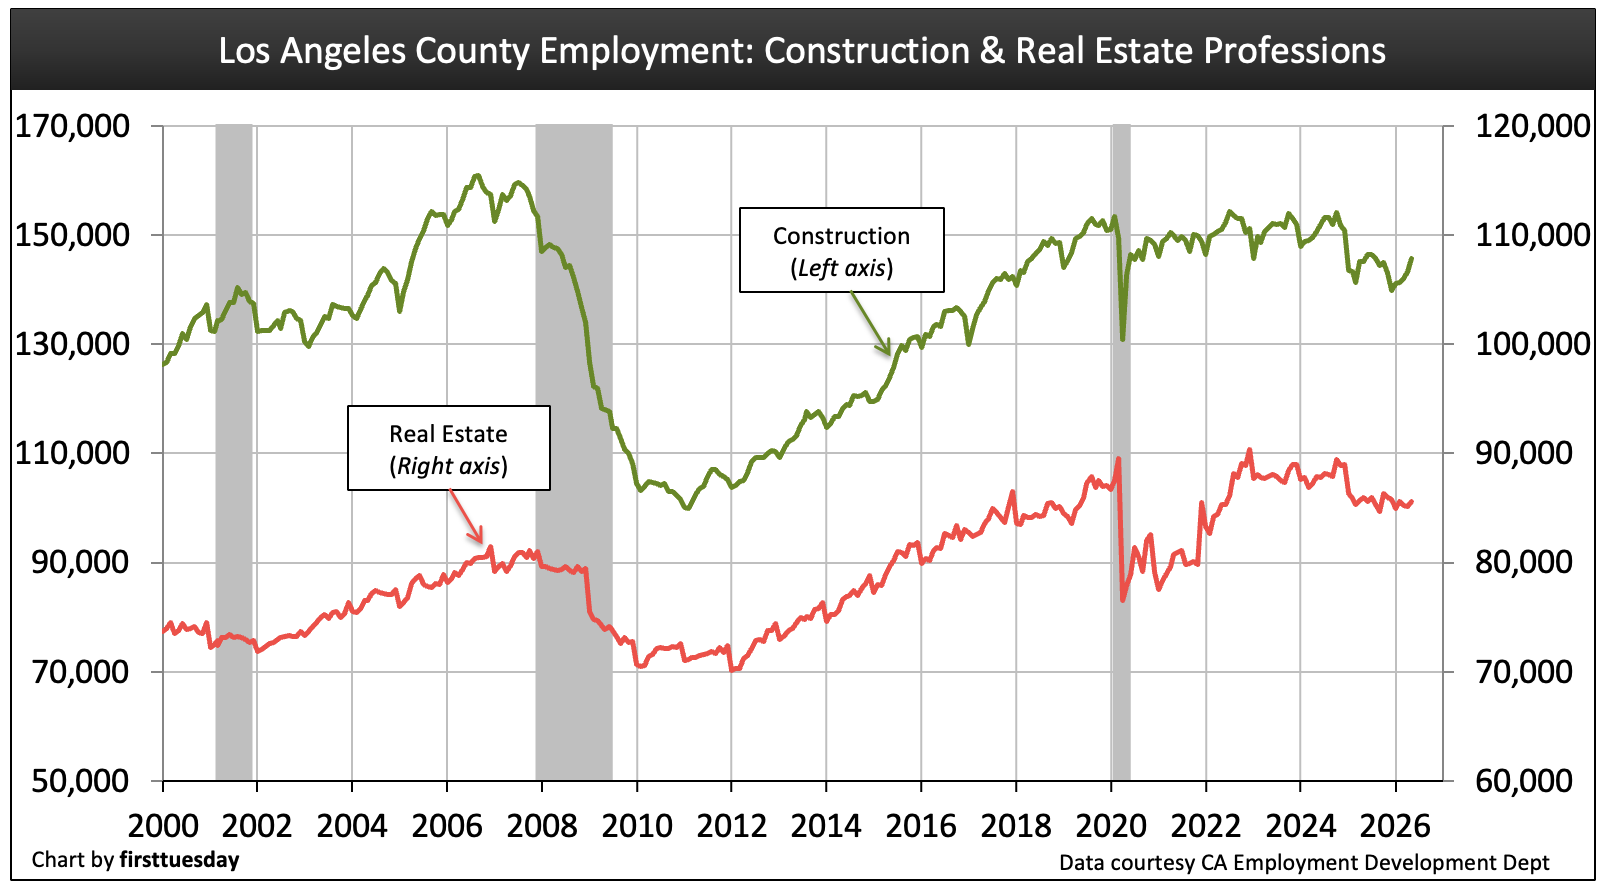
Chart update 06/24/26
| May 2026 | May 2025 | Annual change | |
| Construction | 145,700 | 145,200 | +0.3% |
Real Estate | 85,600 | 86,000 | -0.5% |
In the housing industry, construction jobs gradually regained numbers over the decade of recovery following the 2008 recession, reaching a full recovery just before the job losses of the 2020 recession. Likewise, the number of employed real estate professionals recovered gradually, cresting pre-2008 recession levels in 2016 and rising.
In 2020, both industries experienced a hit to job numbers, resulting in thousands of lost jobs. While construction continues to be buoyant due to the unmet demand for housing, real estate professionals saw a slower rebound as they contended with reduced transactions and leveling out of home prices beginning in 2022, but not the necessary drop in prices to cause a resurgence of willing buyers.
The real estate profession will not likely experience a sustained increase in hiring by brokers until the next confluence of buyers and renters (members of the Millennial, Generation Z and Baby Boomer generations) converge on the market in the years following 2026.
Everyone needs income to buy or rent
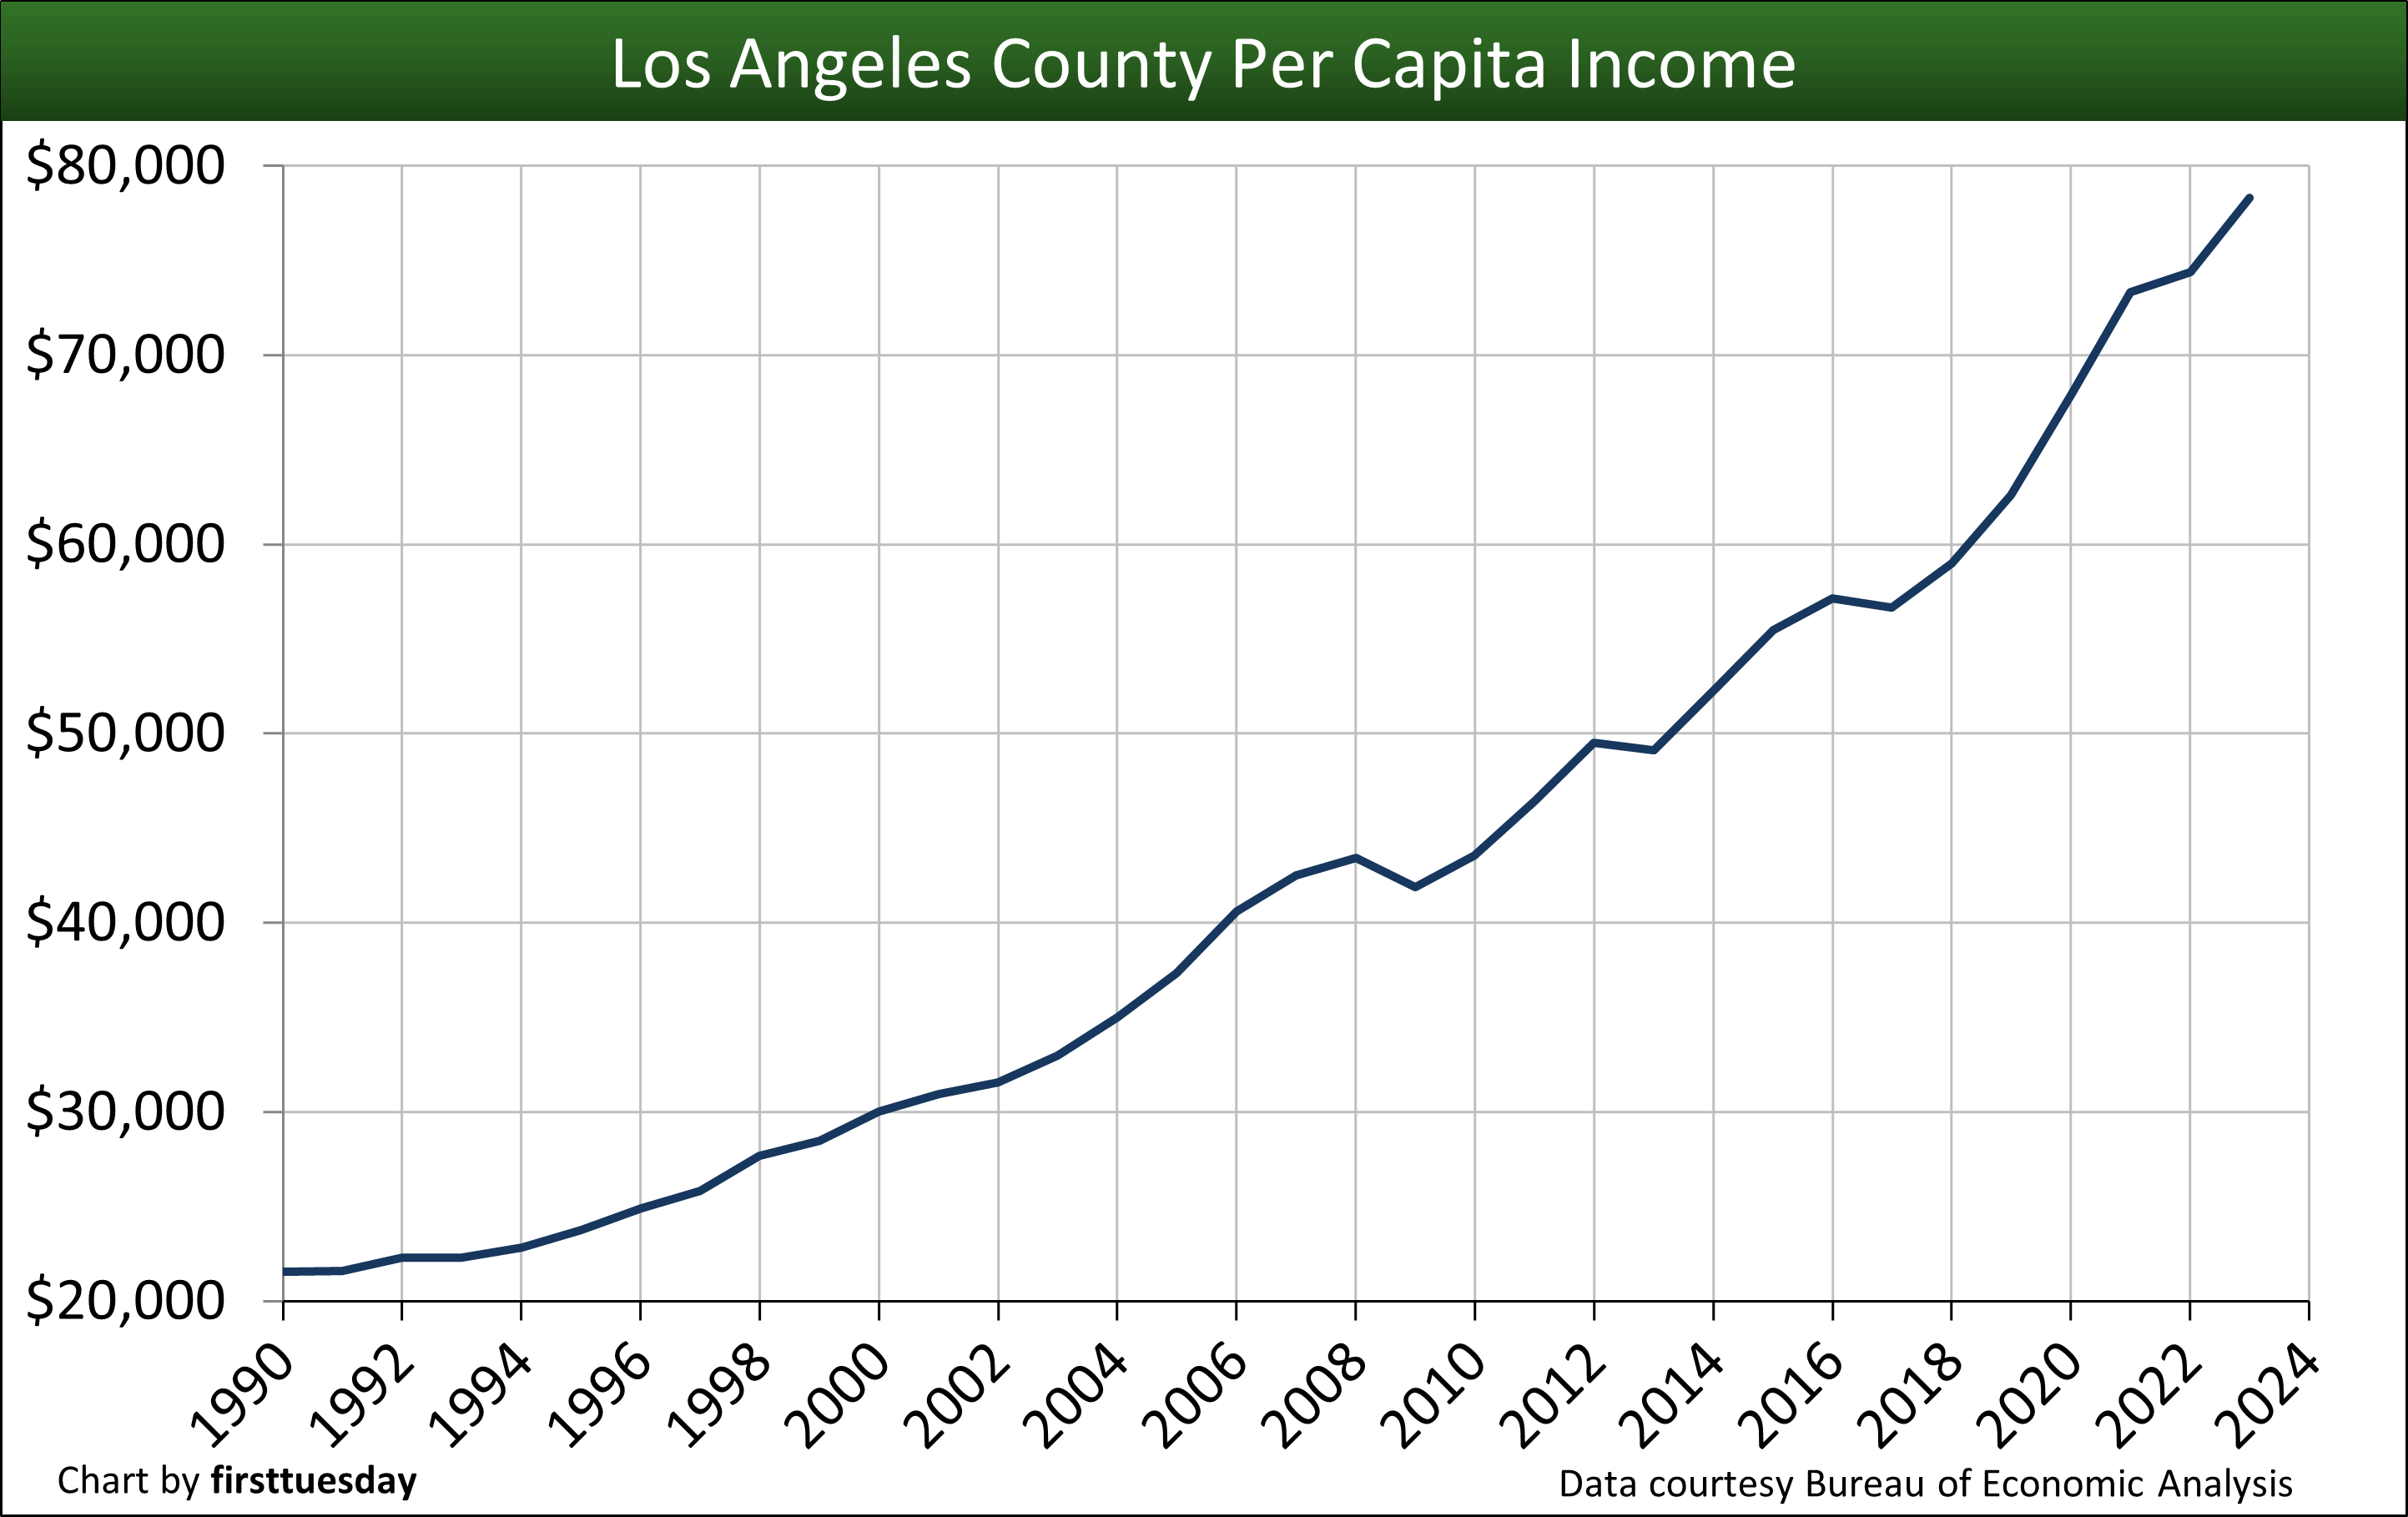
Chart update 12/29/25
| 2023 | 2022 | Annual change | |
| Los Angeles County per capita income | $78,300 | $74,400 | +5.3% |
| California per capita income | $81,250 | $77,000 | +5.6% |
The average income earner in Los Angeles County earned roughly $78,300 in 2023 (the most recently reported Census year). For perspective, this figure is slightly below the statewide per capita income.
While 2023’s 5.3% increase to per capita income is an effort to catch up with pandemic consumer inflation, home price increases still consistently exceed income increases. So long as prices rise faster than incomes across most job sectors, increases in home prices and rents are unsustainable and will eventually fall.
Buyers and tenants ultimately determine sales prices and rent amounts. Collectively, they can pay no more monthly to own or rent their shelter than their savings and income qualify them to pay.
The average Los Angeles resident with a mortgage paid 27.1% of their income on housing in 2021, according to the U.S. Census. Renters paid 33.8% of their income on housing costs. This drop during the pandemic-era from the previous high price for housing can’t be sustained at today’s incomes without a long-term drop in their standard of living and a rise in poverty and related homeless or relocation symptoms.
Though still obscured by the fog of international trade chaos, look to 2028 for the starting point of the next rise in home sales volume and prices. When world trade issues remain in conflict as we experienced in 2025, we will see job losses and in turn forced sales of property to avoid foreclosures for lack of personal income, resulting in a hobbled housing market during 2026-2027.
The next sustainable recovery period for real estate sales, leasing and mortgage originations will be driven by the more resilient shifting demographic trends of retiring Baby Boomers — as sellers — and their Millennial and Gen Z opposites — as buyers.


Hello,
Do you feel that the market will dip soon then? i was going to finance using an 7-1 ARM because i was buying a larger home and can not make the 30 year fixed. i am worried i overpaid for my purchase so I’m not sure if I should hold on to it or not.
Do you think we should wait and pass on this home? and wait until 2020 or 2021 when the downturn happens?
Why will you want to buy now knowing that so many people lost their jobs. When there is a big unemployment prices can only go down sure interest rates are low but people need jobs.
Great resource for Los Angeles real estate investors. Please continue to update.
This article covered until 2017. Why some comments was written in 2014?
This is an excellent analysis of exactly what has been occurring in the Los Angeles county real estate market. The one thing I would like to see is a comparison of bull versus bear market recoveries from other sectors of the economy. I believe we experienced the classic “dead cat bounce” in 2013-2014. Meaning prices dipped too low and then recovered due to investor activity. Once price equilibrium returned, the investors left the field and we were left with end users, resulting in the dramatic slow down second half of 2014. We now rise again, waiting for the next deflation dip to occur in 2016, after which the market rises again towards 2020. The recovery is a wiggly line, not a straight progression. I imagine there are some research stats from other financial sectors that demonstrate how our market will fare in this recovery. I would like to see that.
Would purchasing a home in the current market be a mistake?
If you are renting purchasing a home is a good move – you gain control over your monthly housing expense, realize tax deductions for property taxes and mortgage interest. Mortgage interest rates are still low by historic standards, making homes a good investment if you a planning to hold for at least five years or so. Talking with a real estate professional in your specific area would be the next step. In my market, Burbank – Pasadena, there will be no new housing construction of large scale. Your area may be different.
Excellent
Excellent Pod Casts! My complements!!! Fred… Good Job!
Miss you at Coco’s meetings….
Excellent analysis. I’m buying like mad from 2009-2013, bottom June2011.
Going to start selling from 2017 to 2021.
John,
I’m a realtor in the Los Angeles area. I had just happened to be interested in population and financial trends for this year and stumbled across this article.
Your predictions were spot on! I hear a lot of my colleagues claiming this as the “Year of the Seller” If you’re interested in selling some of your assets, I’d like to extend my services to you.
Give me a call 323-616-3388