
California’s 2026 housing market is gradually entering a more consistent but slowing economic phase on exiting the chaotic pandemic-era real estate market.
In light of 2020’s pandemic-era job losses and extensive uncertainty about the direction of the economy, low mortgage rates and fast rising prices in 2020 and 2021 did not induce homeowners to sell, as expected. A legitimate caution swept the real estate market out of concern for finding a replacement home as turnover of ownership dwindled and new construction lagged badly.
This resulted in a strangled MLS inventory which accelerated property prices to even greater unsustainable heights. In 2026, inventory is near its highest since the 2020 recession, reflecting slowing demand and reduced sales even as owners choose to continue selling. Thus, prices have leveled in 2026, reflecting buyer caution and a lack of access to mortgage funds.
Expect sales volume for all types of property to continue its flat-to-down trend, the story for sales volume since the peak in mid-2022. When prices next bottom, it will likely be around 2027 or 2028, followed quickly by an initial arrival of speculators and investors providing a short term pick up in sales volume and a price bump. Only then as prices again start to rise will buyer-occupants sense a bottom to prices has developed and return to buy, as they do in every recovery period.
Mortgage rates will continue to trend upward in the decade ahead, putting downward pressure on prices as rates rise. Home sales volume follows the pace of price decline when mortgage rates remain high or trend higher. Thus, the long-term price outlook for San Diego mirrors the rest of the state, with the price inflation of 2020-21 induced by artificially low mortgage rates now long gone.
View the charts below for current activity and forecasts for the San Diego housing market.
Updated June 25, 2026.
Home sales volume slows
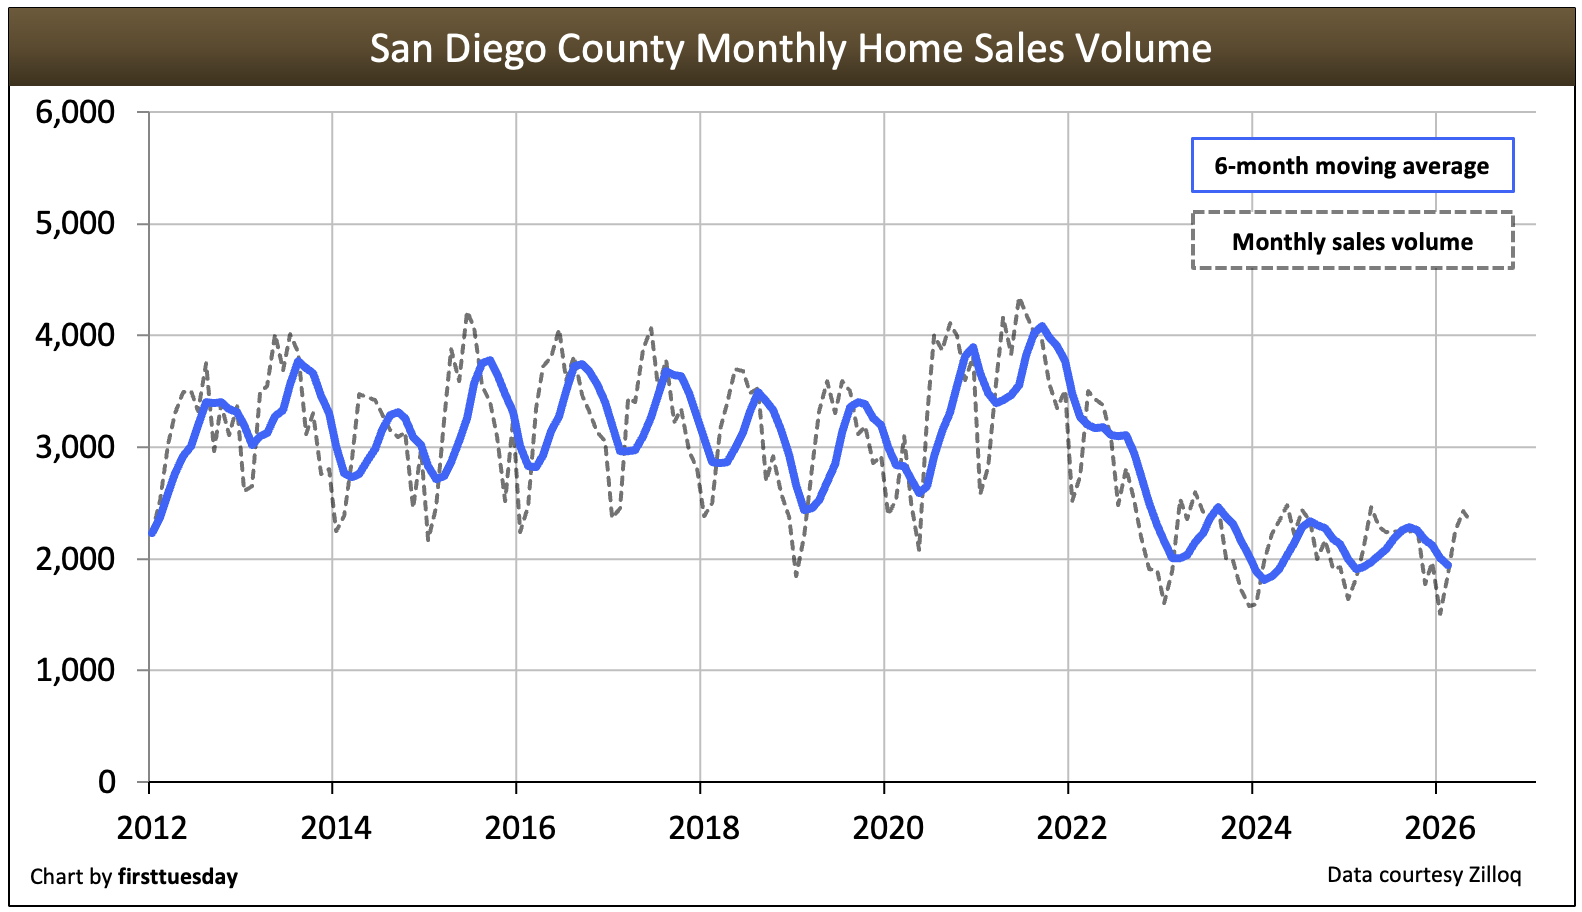
Chart update 06/25/26
| 2025 | 2024 | 2019 | 2003: Peak Year | |
| San Diego County home sales volume | 23,900 | 23,900 | 35,700 | 60,800 |
In 2025, San Diego home sales volume, now seriously weakened by the current international trade war, remained stuck at 2/3rds of the heights seen in 2019 during the last normal year before the pandemic recession.
Looking back, San Diego reflected a statewide decrease in total home sales volume in 2018-2019 as the Millennium Boom recovery lost momentum. Then in 2020, home sales volume instantly reversed course with the fiscal and monetary stimulus required for individuals and businesses to finance their way through the pandemic period.
But the rising action of the pandemic years ended with a sales volume crash in 2023.
In 2026, year-to-date sales as of May 2026 are a meager 1% higher than 2025. This continues the level trend in sales volume experienced since 2024.
Dragged down by the double whammy of rapidly rising mortgage rates and fast rising property prices, homebuyer enthusiasm waned significantly. Today, sales volume is trending flat with an additional downward influence for 2026 brought on by the uncertain economic picture held by homebuyers. Compared to the last “normal” year for home sales volume, 2025 was 33% below 2019.
A complete recovery will be reached only after end user demand is buttressed by an increase in the number of jobs paying a sufficient salary. Residential construction starts will increase dramatically to help fill buyer demand as cities within the county finally open up the permit process in urban centers. Expect 2028 to be the year for a recovery period to take California real estate out of the shadow real estate recession that commenced in 2022.
Related article:
Inventory rises from historic lows
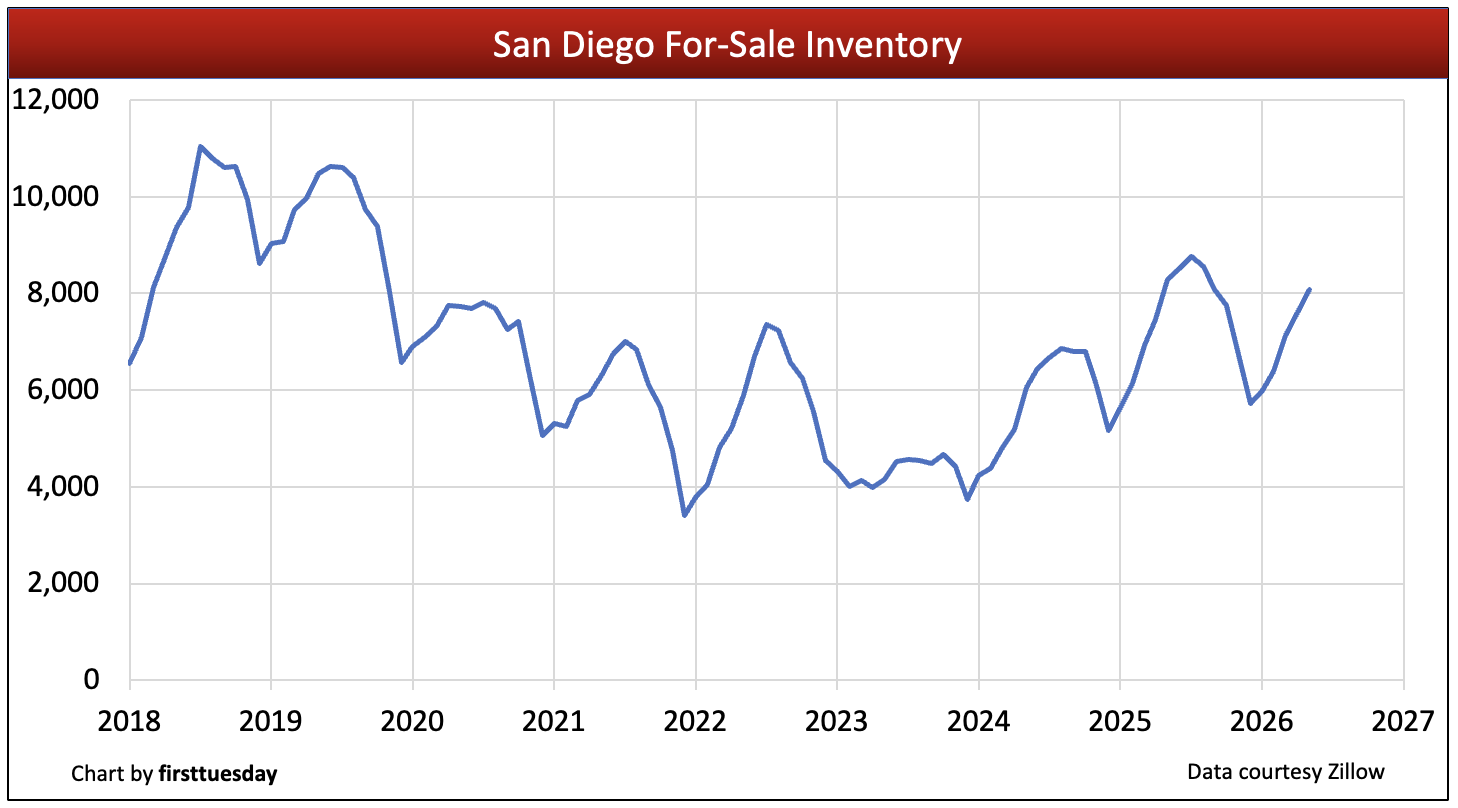
Chart update 06/25/26
| May 2026 | May 2025 | Annual change | |
| San Diego County for-sale inventory | 8,100 | 8,300 | -3% |
Multiple listing service (MLS) inventory has risen from the historic low reached at the end of 2021, stressing availability while driving prices up. After plateauing in 2023 following two years of steep decline (minus a brief bump in 2022 when supply briefly exceeded buyer demand), for-sale inventory in San Diego for May 2026 was a slight 3% below a year earlier.
Today, inventory has risen to 2020 levels, on track to reach 2019 levels later in 2026 as buyer reluctance takes hold.
The winter months typically see the lowest inventory of homes for sale, peaking around mid-year as the cyclical return of buyers takes place.
Looking forward, expect for-sale inventory to increase slightly in 2026. As for-sale inventory grows, extending the average length of time on the market, sellers are forced to reduce pricing to attract mortgage-funded homebuyers back to the broker offices to acquire property.
The Fed’s task to reduce consumer inflation while maintaining current employment levels is progressing irregularly. The current culprit is the chaotic trade war tariff disruption. As a result, indicators point to a continuing downturn in the housing market activity until around the 2028 period.
The seller’s market fully reversed into a buyer’s market by mid-2022. The process of shifting from a seller market to a buyer market was introduced by the beginning of a roughly 30-year half cycle of generally rising interest rates on all types of lending.
Today, homebuyers are responding with an increased reliance on a wait-and-see approach to buying. The present global disruptions in commerce have everyone’s attention. Thus, buyers are increasingly more aware of real estate market conditions and are becoming more financially cautious and less willing to buy without significant reduction in seller pricing or mortgage rates.
Turnover rates flounder following moratoriums
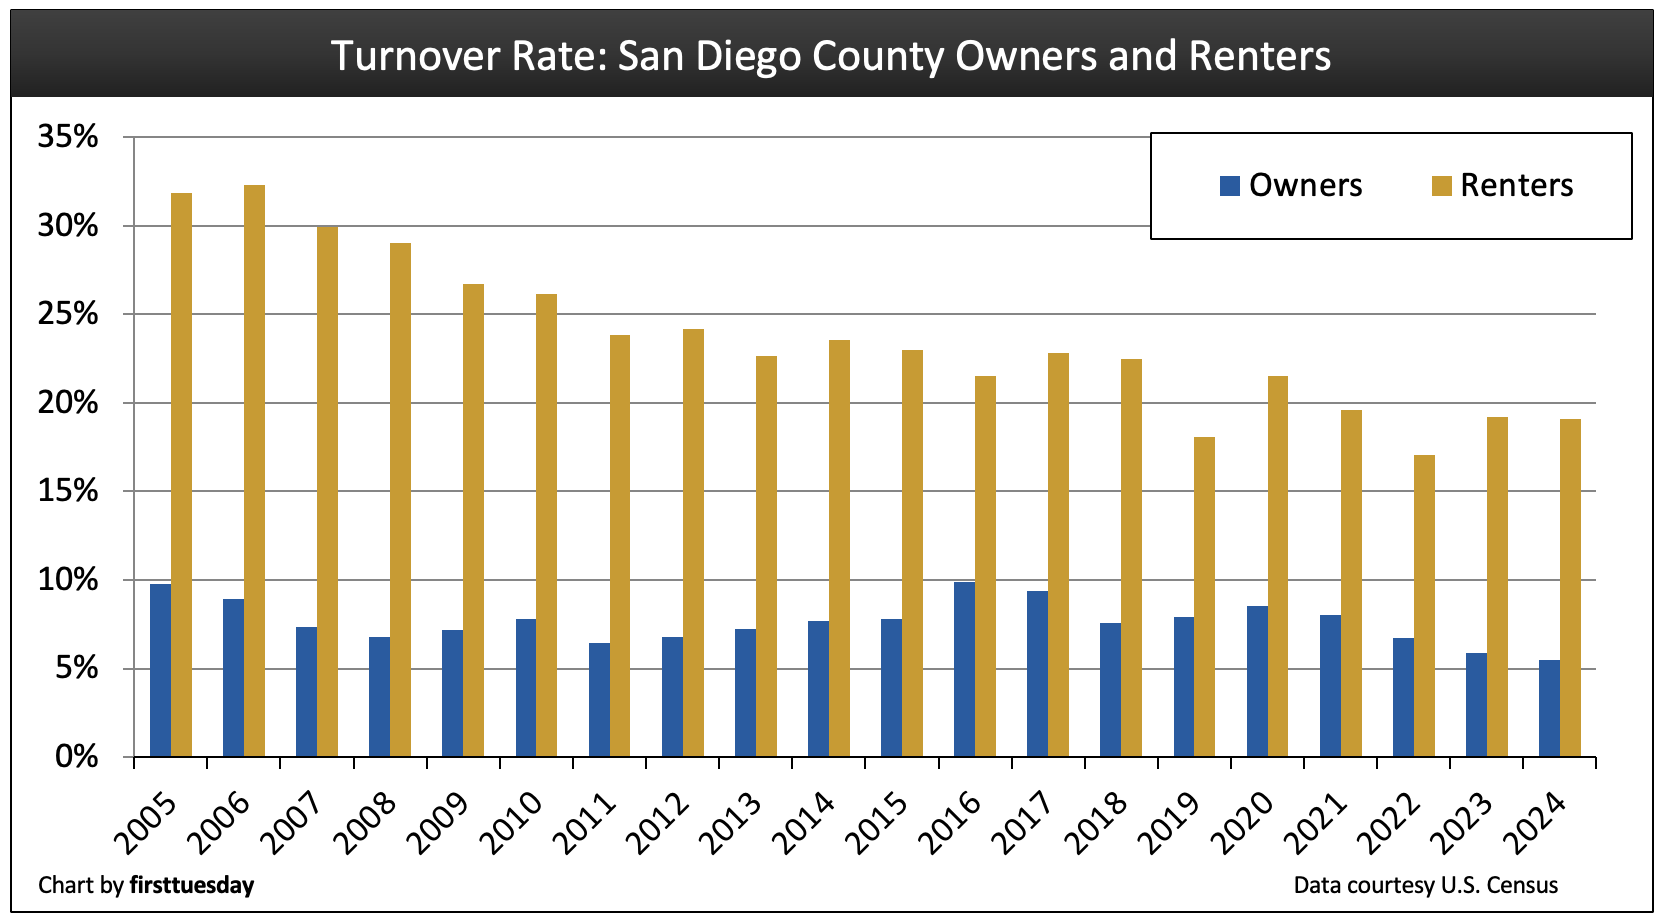
Chart update 01/02/26
| 2024 | 2023 | 2022 | |
| San Diego County homeowner turnover rate | 5.5% | 5.9% | 6.7% |
San Diego County renter turnover rate | 19.1% | 19.2% | 17.1% |
Home sales volume depends in large part on homeowner and renter turnover. The number of people moving from their residence each year is indicative of both the willingness and ability of homeowners and renters to relocate. Turnover rates are highest when jobs are abundant, wages are rising faster than consumer inflation, housing starts are increasing and employee confidence in the economy is high. 2025 is not providing forward resilience for any of these factors.
The percentage of San Diego County homeowners who moved in 2024, the most current figure, fell back to 5.5% to continue the downward slide following a peak in turnover in 2016. Increased mortgage rates in 2013 without a comparable drop in seller pricing caused most of the attitude shift away from relocating.
However, the percentage of renters who moved in 2024 was higher than in 2022 and 2019 due to a meaningful drop in home pricing by sellers and a plateauing of mortgage rates. Since 2006, when renter turnover peaked at 32% or an average renter turnover every three years, the rate of renter turnover has declined in a constant trend. With 2024 reaching a 19% turnover or once every five years, this downward trend will most likely continue on exiting the pandemic economy and entering the tariff trade wars economy.
Further, low and declining turnover rates are indicative of increasingly cash-strapped households that simply cannot afford to or are uncertain about moving, whether they are homeowners or renters. When turnover trends lower, home sales volume and service provider fees for transactions decrease.
While the trends in San Diego are similar to the rest of the state, the magnitude of decline in turnover rate in San Diego County has not suffered as much compared to the rest of Southern California. This is partly due to a better jobs outlook and San Diego’s large military population on which the trade wars will have a positive effect for San Diego and traditionally experiences high rates of turnover. Agents with mortgage training (MLOs) gain an “in” with this population as they are familiar with the various benefits available to military renters and homeowners such as Veteran’s Administration (VA)-guaranteed and CalVet mortgages, then can advertise their services as experts.
Expect a consistent increase in the frequency of turnover to likely arrive only after a recovery sets sometime after 2028. California OAG efforts to force cities and counties to greatly increase the permitting of residential construction as recently legislated (ADUs, parceling, planning) will eventually increase housing starts rapidly. Further, after we pass through the current real estate recession – which set in mid-2022 and persists in 2025 without an end in sight – San Diego will experience an economic recovery for real estate sales and leasing transactions for all types of property.
Related articles:
Servicers must assist underwater military members ordered to relocate
Foreclosure of service members’ property prohibited during nine months after service
Homeownership plummets
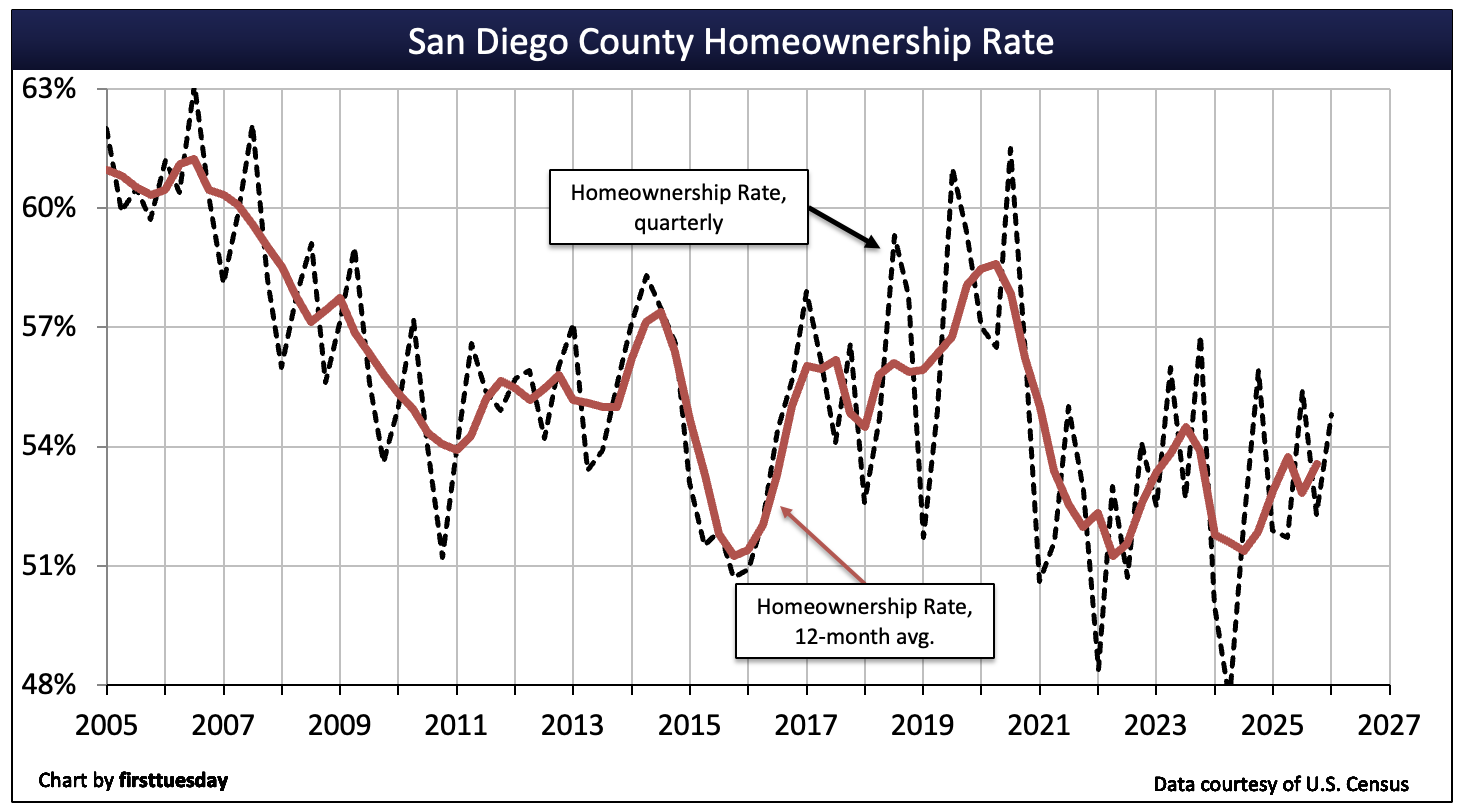
Chart update 04/12/26
| Q1 2026 | Q4 2025 | Q1 2025 | |
| San Diego County homeownership | 54.8% | 52.3% | 51.9% |
In the years following the Millennium Boom, San Diego County’s homeownership rate followed the general statewide and national trend of decline with no end to the decline able to be forecast. As of Q1 2026, San Diego’s homeownership rate is 54.8%, slightly below the statewide average of 55.7%.
The current post-pandemic rise in home prices due exclusively to a lack of property available for sale – resale or new construction – has forced a huge part of first-time homebuyers and turnover homeowner out of the market, giving cash-heavy investors and the few cash buyer-occupants the upper hand.
The housing market bounce back from the current real estate recession cannot be reliably forecast until the global trade wars settle down with durable tariff rates. Further, a loss of jobs is expected through the 2026 period, or later, due to uncertain business conditions, taxes on imported material for consumers and manufacturers, increased inability to export, etc.
Do not expect the rate of homeownership to fully return to the inflated heights seen in 2007 anytime soon. The rate was elevated by unfettered access to easy money resulting in the 2008 Great Recession. In response, mortgage regulations were reinstated in 2010 with enforcement of ability-to-repay (ATR) rules to protect society from destabilizing types of mortgage lending.
Home price’s seasonal bounce
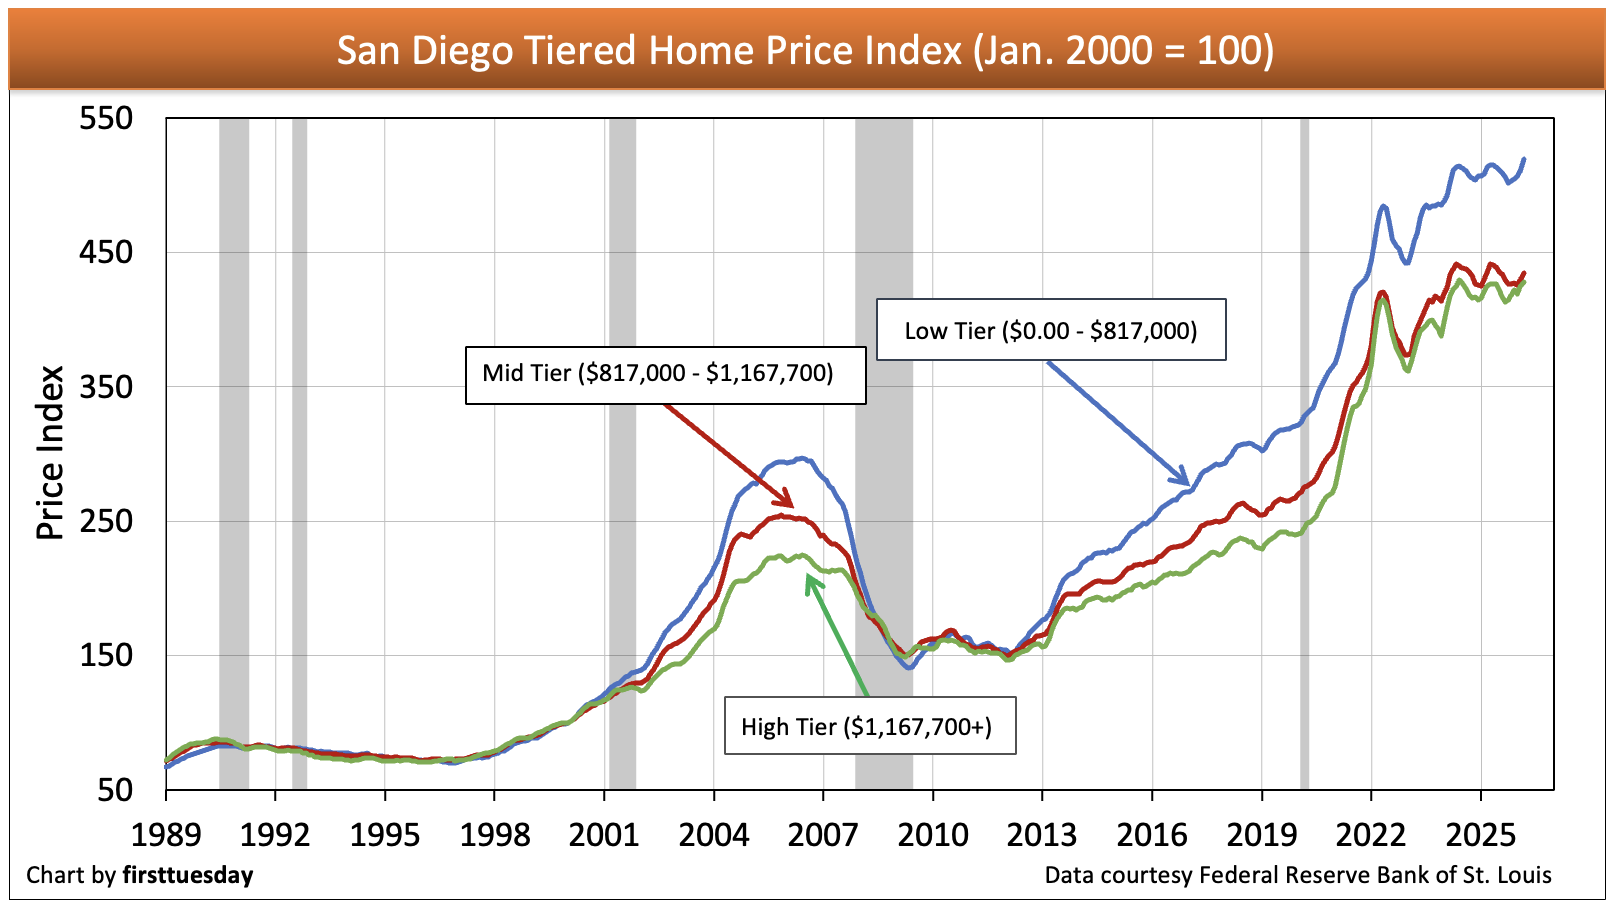
Chart update 06/25/26
| Low-tier annual change | Mid-tier annual change | High-tier annual change | |
| San Diego County home pricing index: Mar 2026 | +1% | 0% | +1% |
The price of housing in San Diego County began to plunge in mid-2022, down 2%-5% (depending on price-tier) by May 2023. However, throughout 2024 home prices experienced a slow steady rise as mortgage rates declined during the spring homebuying cycle. As of March 2026, home prices in San Diego were roughly level with a year earlier.
Watch for prices to continue to fall back in the months ahead following spring’s seasonal bounce, ending in July.
Sales volume will likely diminish as caution sets in among buyers and sellers over the uncertainty surrounding financial decisions in the foreseeable future. Price movement now depends on the quantity of owners who are willing or need to sell their property, which generally depends on the level of jobs. Since the economic factors in play as managed by the government suggest a recession-like turndown in 2026, expect property prices to follow and fall. Consumer inflation is a separate issue.
Multi-family construction leads the way
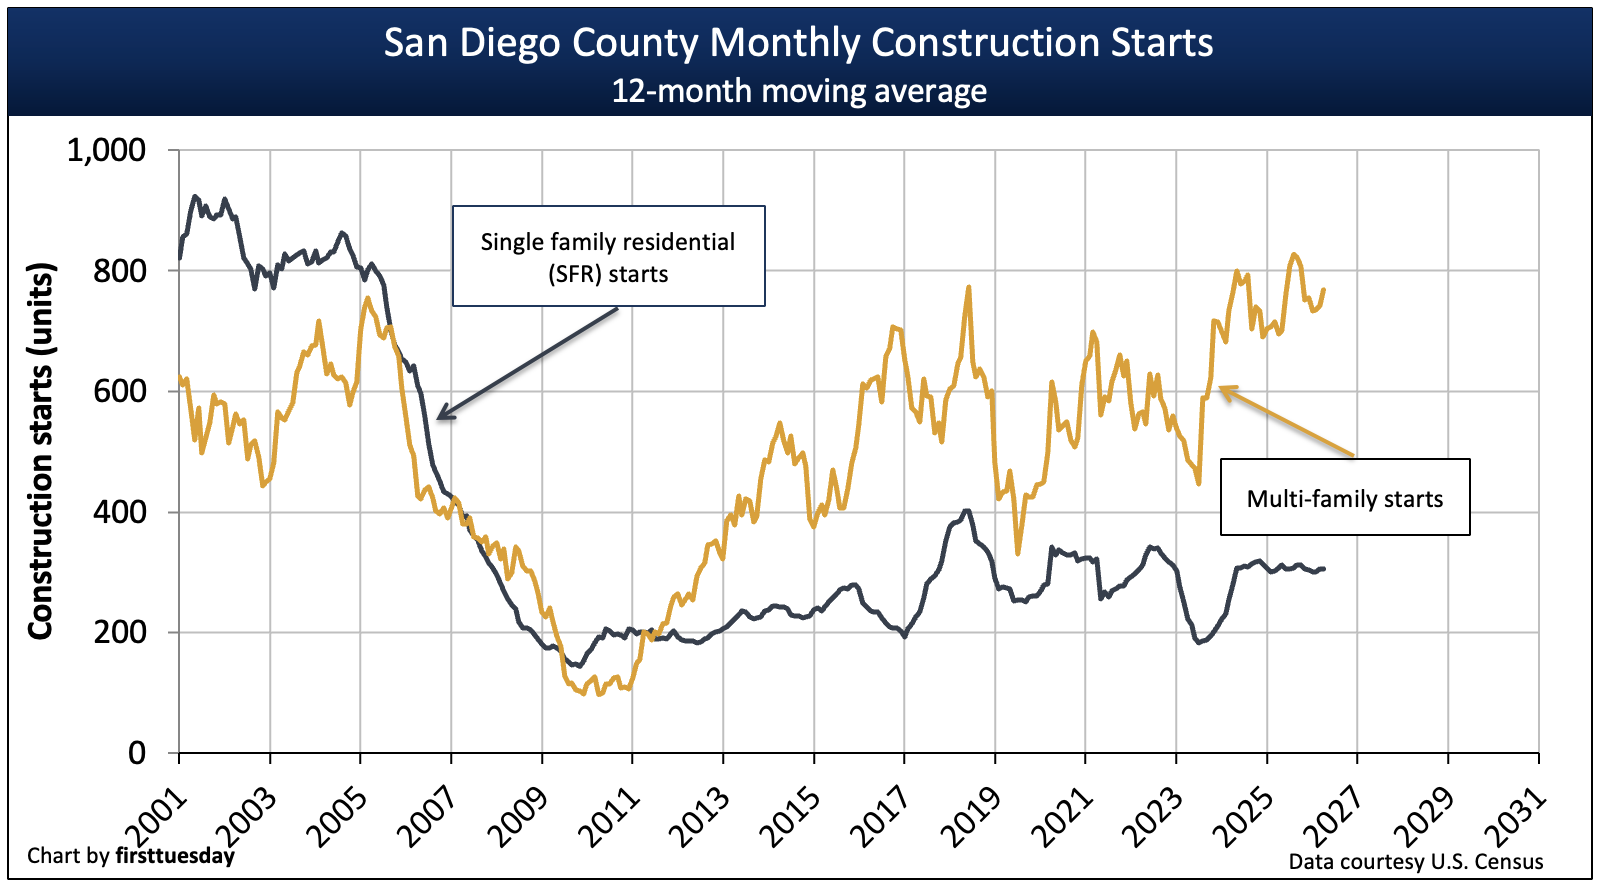
Chart update 06/25/26
| 2025 | 2024 | Annual change | |
| San Diego County single family residential (SFR) starts | 3,400 | 3,400 | 0% |
San Diego County multi-family starts | 8,200 | 8,100 | +1% |
Residential construction starts of all types were flat in 2025. This follows 2024’s 46% annual jump for single family residential (SFR) starts and continues another level year for multi-family starts. Until 2018, the recovery had been concentrated in multi-family starts, due to the increased demand for rental housing experienced during this recovery. Fueling this increased rental demand are:
- a demand shift from suburban living to city dwelling by the youngest generation of homebuyers, Millennials (Gen Y);
- an increased resistance to homeownership following the 2008 housing crash during which around 1.1 million California families lost or were forced to sell their homes due to foreclosure; and
- the higher barriers to homeownership due to the return of mortgage lending fundamentals which tightened standards for mortgage lending but eased the application process with MLOs.
Today, the general trend for SFR construction starts in San Diego County is still far below 2002-2004 numbers. The next peak in SFR construction starts depends on a return to certainty for costs of construction without the negative cost affect of the current trade wars taxing imports. When a return to stability in construction costs takes place, existing state legislation and OAG enforcement of public policy requiring cities to issue more permits will quickly accelerate housing starts.
However, multi-family housing starts in the next upturn will experience high levels as last seen in the mid-1980s, which then accommodated the arrival of Baby Boomers to the housing market.
Jobs struggle to rise
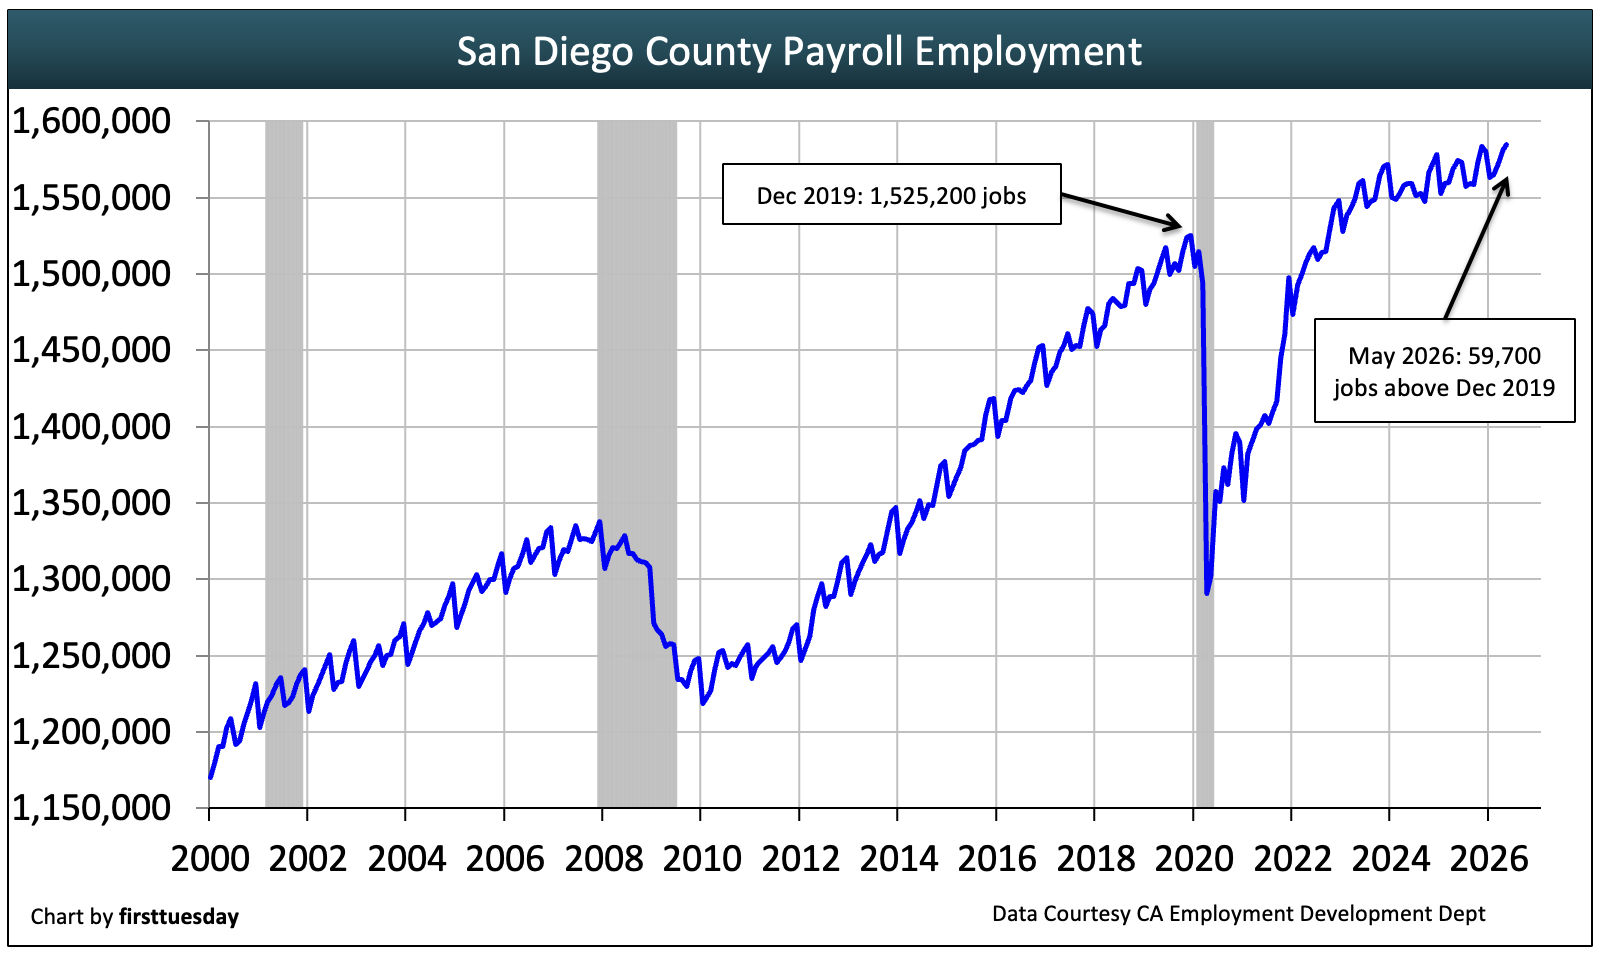
Chart update 06/25/26
| May 2026 | May 2026 | annual change | |
| San Diego County employment | 1,584,900 | 1,574,600 | +0.7% |
Before end users can provide sufficient buyer and renter support for a housing recovery, they need income in the form of jobs or wage increases. San Diego has outpaced the state’s jobs recovery since 2008, which is good news for San Diego’s housing industry.
Unlike other parts of the state with less stable employment markets, San Diego surpassed the level of jobs held prior to the 2008 recession well before the 2020 recession set in. Further, following 2020’s significant job losses and their recovery, jobs are now 59,700 above the pre-2020 recession peak as of May 2026.
However, the jobs recovery hit a wall in 2024, experiencing a leveling that continues in 2026. Looking forward, when jobs slip in the rest of the state, San Diego’s employment level will be somewhat shielded from losses due to the military employment stationed in the area.
Real estate industry employment levels out
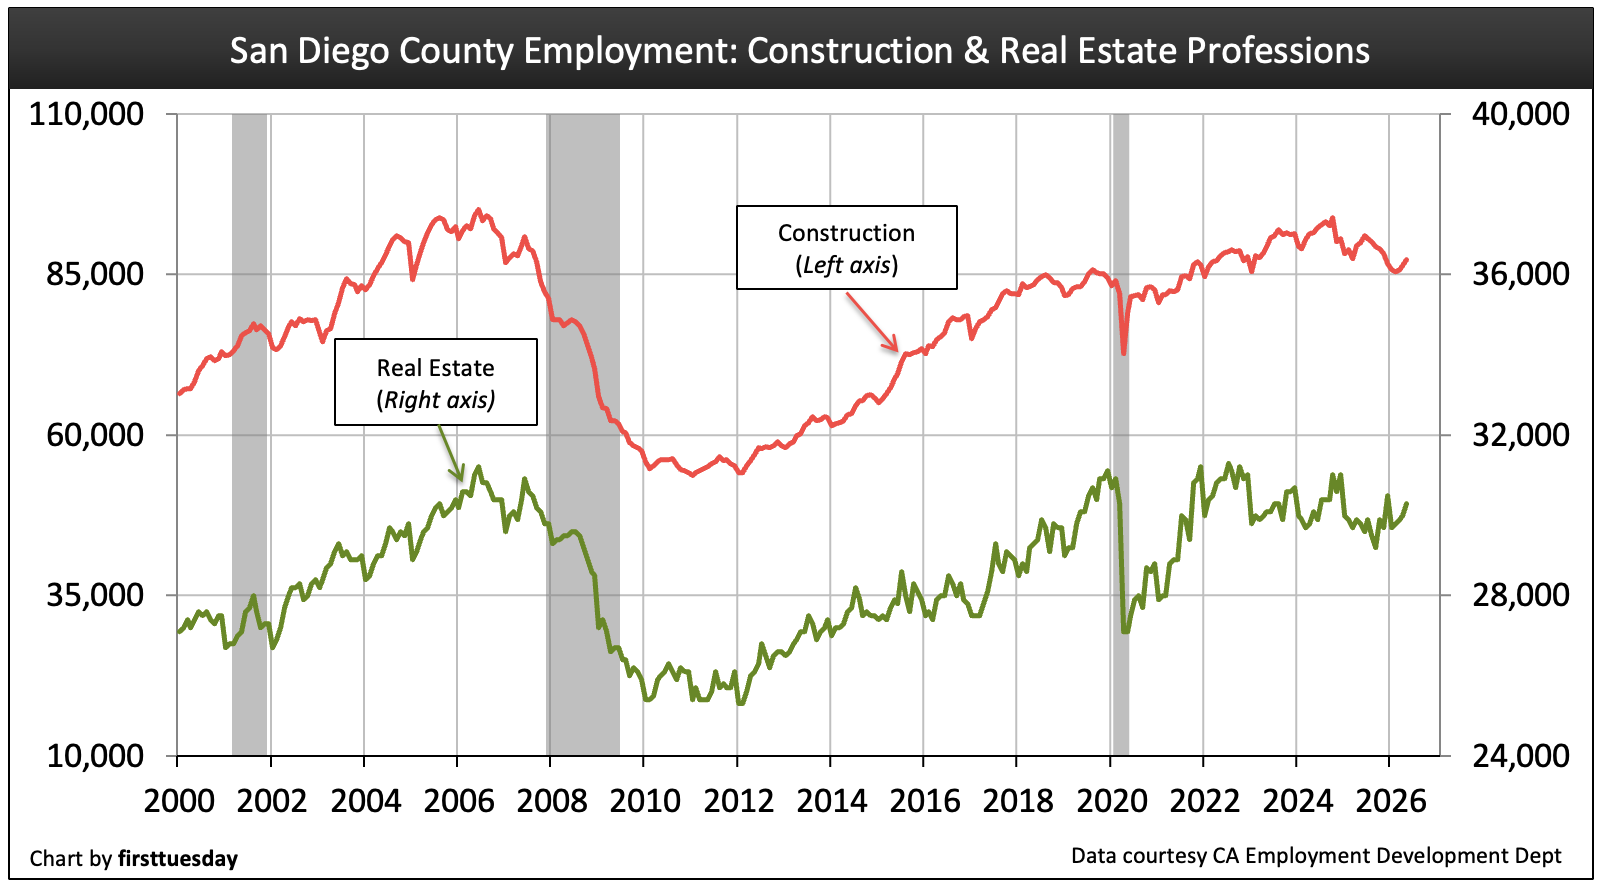
Chart update 04/12/26
| May 2026 | May 2025 | annual change | |
| Real estate | 30,300 | 29,800 | +2% |
Construction | 87,300 | 90,000 | -3% |
In the housing industry, construction jobs have gradually regained numbers over the past decade of recovery from the 2008 recession, nearing a modest recovery. In contrast, the number of employed real estate professionals has remained low throughout the past recovery, rising slowly.
In the 2020 pandemic economy, both industries experienced a hit to job numbers, though both bounced back fairly quickly compared to other industries — especially for real estate professionals. However, the real estate profession is experiencing a decline in sales, leasing and mortgage origination that will continue until California clears out the effects of the trade wars developing globally.
Per capita income now parallels consumer inflation

Chart update 3/26/25
| 2023 | 2019 | Annual change | |
| San Diego County per capita income | $79,100 | $74,500 | +6.2% |
| California per capita income | $81,300 | $76,900 | +5.6% |
The average per capita income in San Diego County is $79,100 as of 2023, the most recently reported Census year. This is an increase in income of 6.2% over the previous year. Income took a hit in San Diego during the 2008 recession, and it took three years for income to finally catch up to 2008 levels. That experience is likely to repeat in the 2025 to 2027 period based on existing and expected damage to the consumer and manufacturing communities inflicted by the trade wars with all our trading partners.
Per capita income in San Diego County is slightly lower than the state average and exceeds levels in the inland valleys.
The pace of personal income sets the annual rate of increase in sustainable home prices and rental rates. Thus, buyer occupants and residential tenants ultimately determine pricing of homes and rental units — buyers and tenants can only pay as much for housing as their income qualifies them to pay — nothing more, unless lenders and landlords want to take on more risky, less qualified individuals.
This financial rule was altered in the 2020-2021 pandemic period due to the interference of cash-heavy investors in the housing market, second home buyers, and record-low mortgage rates, which caused buyer purchasing power to jump, again all based on personal income. Rental rates did not get that parallel jump (33%) compared to home pricing in the pandemic economy as, again, rent is tied to income and rental occupants have no capacity for leveraging the purchase of an asset to occupy as housing
Do not expect per capita income to rise in the coming couple of years as job numbers are likely to decrease, though not as much as in other large cities.


It didn’t affect values in Aviara in North San Diego county, city of Carlsbad.
The increased buyer purchasing power in San Diego is also attributable to more flexible lending guidelines. When you see this become a balanced market or buyers market, consider lenders starting to tighten their underwriting guidelines.
Good stuff. Prices will rise until we see a build up in inventory. Thanks.
I am seeing homes opening up for sale over the past month, more so than the previous year. Do they know something I don’t, or are they just trying to cash in and buy somewhere outright? The stock market fell 2% today and I’m wondering if the Bear Market is having any effect on homeowners wanting to sell? Thanks.