

Why this matters: Real estate professionals need an understanding of the principles for market forecasting based on available data, to guide their practice and advise clients on transactions during different phases of the business cycle — especially now as national governance influences wide ranging uncertainty in California’s real estate market.
Know how your market evolves
The yield spread is a tool you use as an agent to form an opinion about future real estate demand and pricing by forecasting the likelihood of a recession one year forward. The yield spread is a figure representing the percentage point difference between interest rates in two bond market tiers:
- long-term interest rate on the 10-year Treasury note, determined by bond market participants worldwide; minus the
- short-term interest rate controlled by the Federal Reserve (the Fed).
The resulting spread figure is either positive or negative, as it is always calculated by subtracting the short-term interest rate from the long-term interest rates.
The yield spread figure ran negative for most of 2024, indicating a coming recession likely by 2026. However, the trade wars of early 2025 caused investor attitude about investment opportunities to change course, bringing volatility to the 10-year T-Note rate. Now in 2026, the rate has hit 5%, a high not seen in two decades.
For mortgage-funded home buyers, when the 10-year T-Note rate rises, the price they can pay for real estate declines. The connection to pricing is the FRM rate of interest is set on the 10-year T-Note rate plus a risk premium margin of between 1.5% and 3%.
The yield spread figure became zero before gradually going positive, averaging +0.98 in August 2026. This spread is likely to remain for several months now that the Fed started to raise the 3-month rate they control in mid-September 2026.
2024’s profoundly negative yield spread was near its lowest level since 1981, when the Fed was waging its last acute battle against inflation and the economy was tilting into a deep recession.
Today’s slightly positive yield spread of 1.0 percent is the result of:
- the questionable low position of short-term interest rates set by the Fed to control consumer inflation and job growth in 2024 and 2025; and
- long-term rates heading higher as bond market investors see an increasing likelihood of uncontrolled inflation and excessive wage increases.
Until mid-September 2026, the Fed delayed an increase in the 3-month rate, believing the current high inflation was a one-off jump that will self-correct after the current effects of tariff and military wars are behind us. Only when the Fed senses high inflation and wage increases have become a long-term problem will they raise the fed rate.
But pressure to slow the growth in inflation and wages mounted as the long-term bond market put rates about 5%. But the rise in bond rates drove the Fed to initially fight inflation by raising the short-term rate.
Meanwhile, real estate markets are nearly 45 months into their own recession due to:
- a decade plus of increasing FRM rates since 2013 (except for the “one-off” pandemic stimulus);
- a stagnant MLS inventory without SFR owner willingness to sell or drop asking prices — on top of insufficient residential construction; and
- the unrelenting cooling of the property market after mid-2022.
Updated September 17 2026. 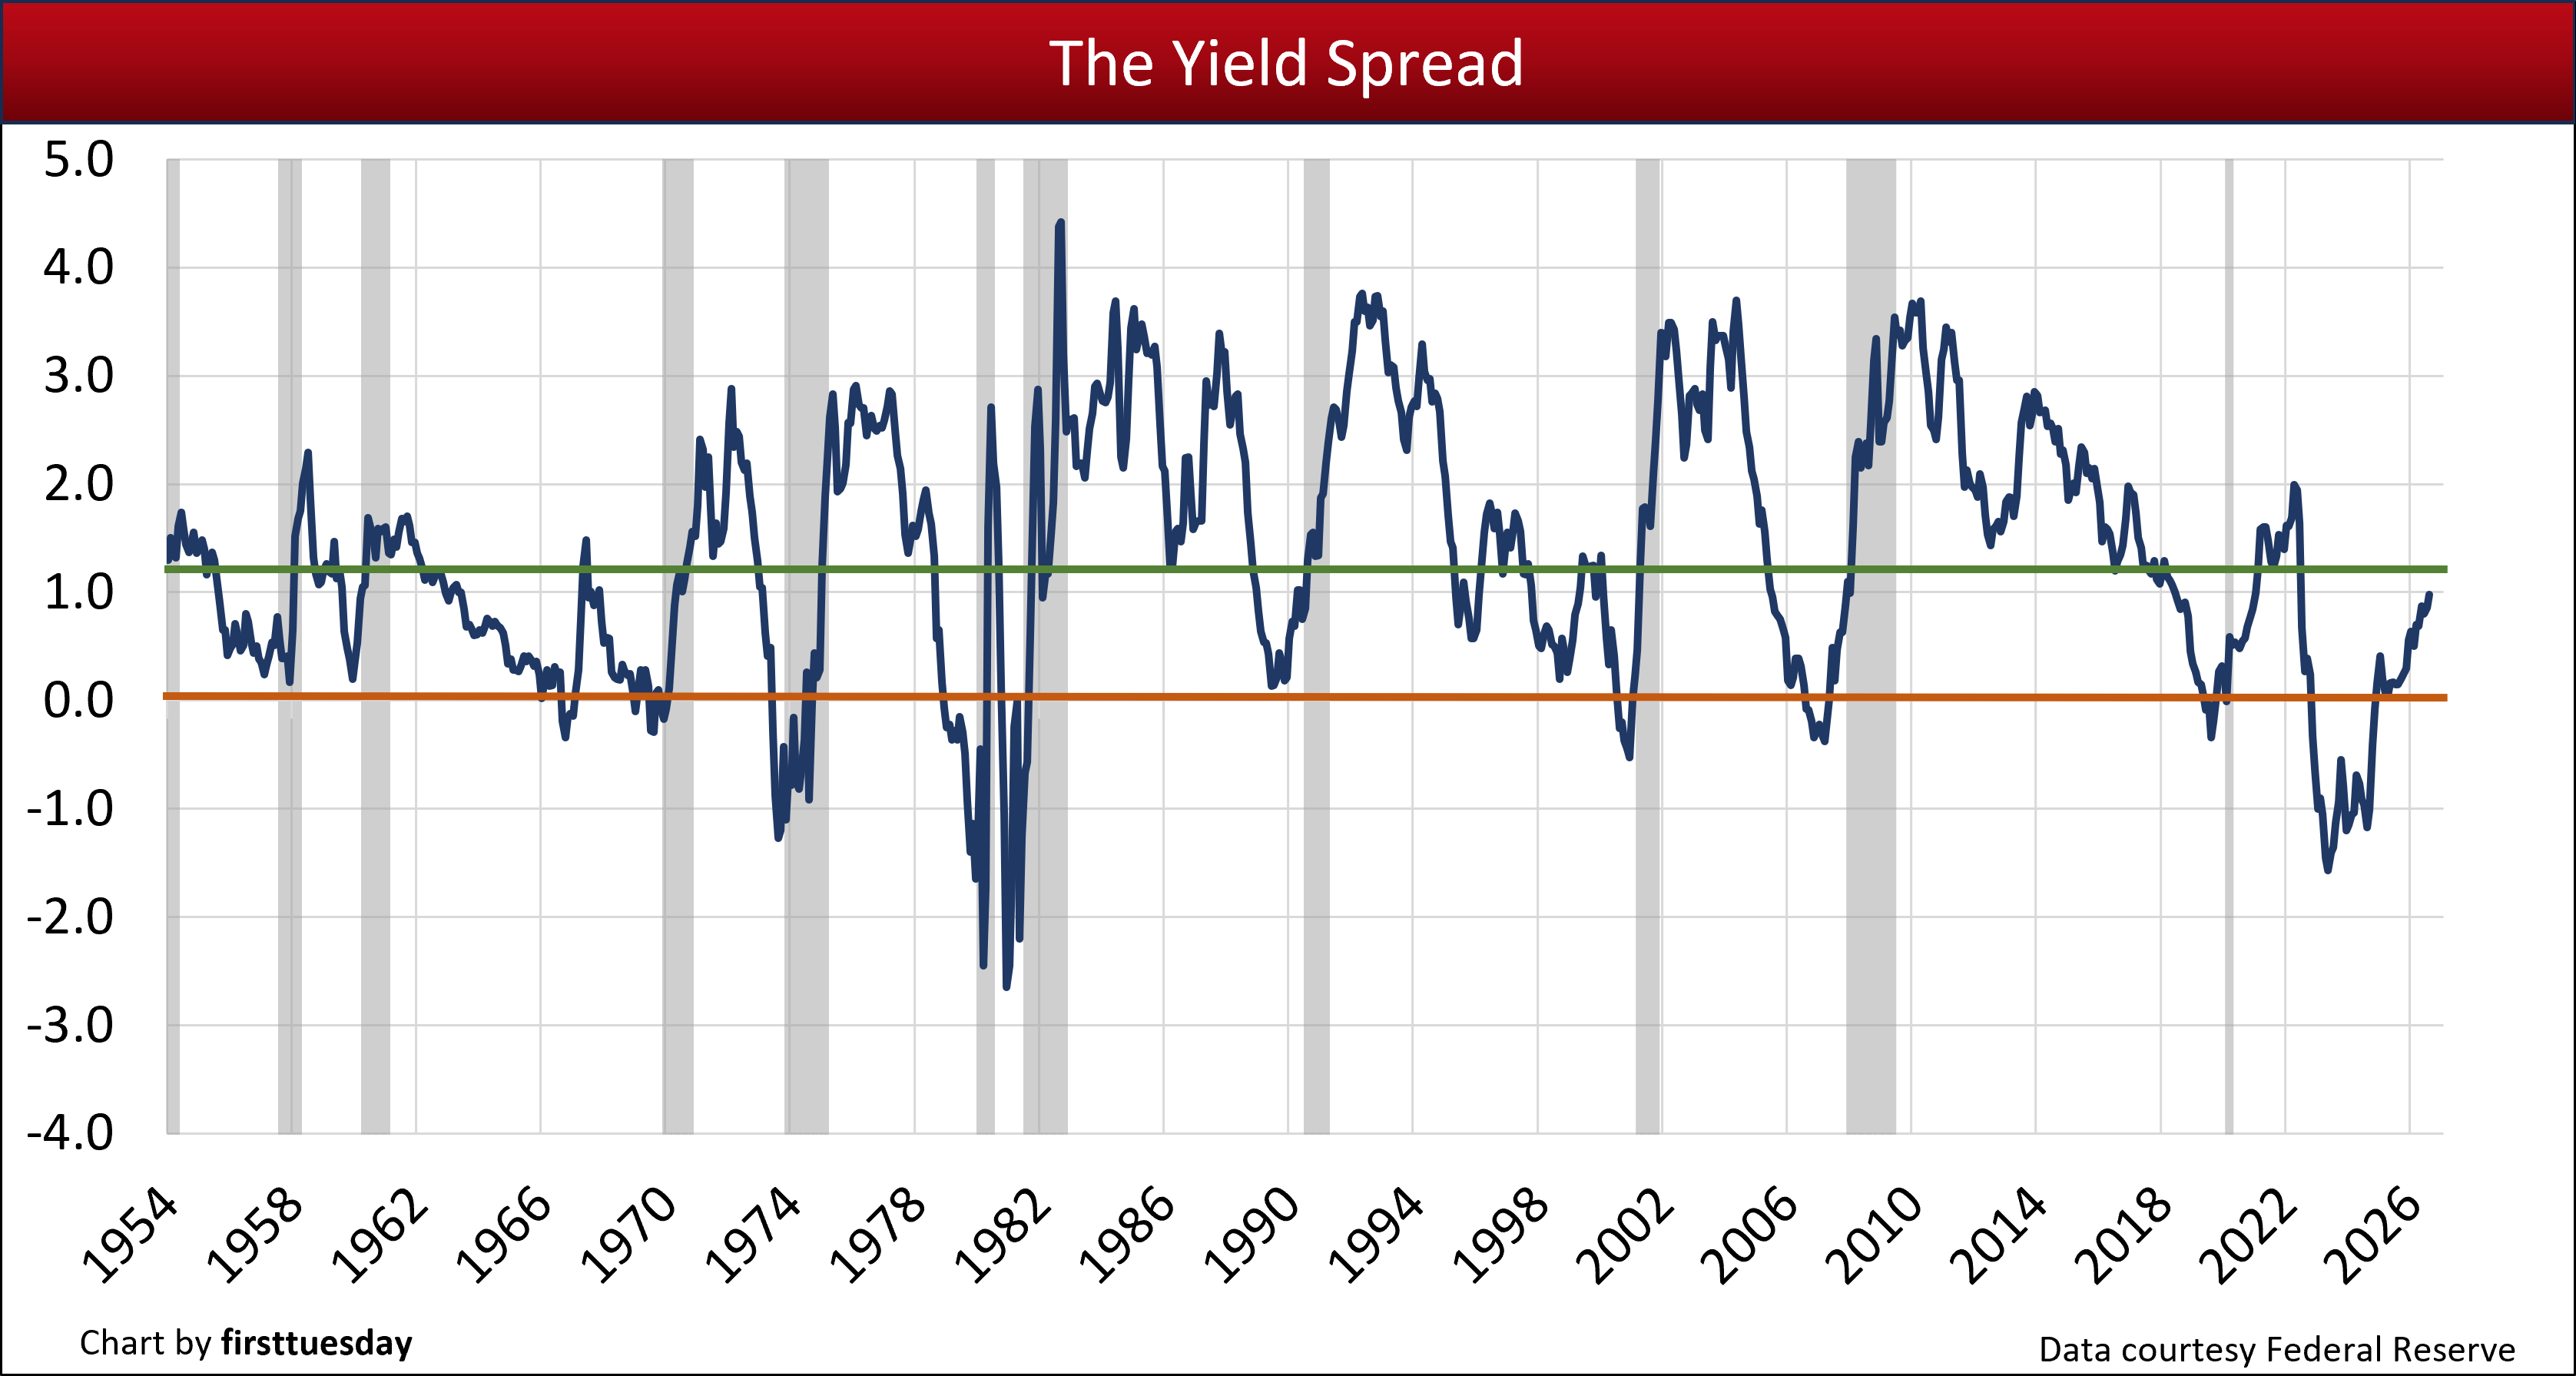
Chart update 9/17/26
| August 2026 | December 2025 | August 2025 | |
| Yield Spread | +0.98 | +0.86 | +0.15 |
Reading the chart and current trends
In the above chart:
- The blue line tracks the yield spread from January 1954 through today.
- The yield spread dips below zero — going negative — when the short-term rate rises above the long-term rate. This is the inversion point.
- +1.21 is the point at which the probability of recession begins, as calculated by NY Fed economists in the late 1970s. A yield spreads smaller than +1.21% predicts a greater probability of a recession one year forward.
Each time since 1960 when the yield spread went negative, we were in a recession approximately 12 months later.
We are going to see by the end of 2026 either a further increase or tapering off of consumer inflation and job growth. The Fed is the primary influencer by its inaction or actions, respectively, for the direction the economy will take.
The current state of the economy and issues around Fed action has an identical tone with the 1971 election year. At that time, the Fed failed to raise their fed rate, and inflation kept rolling uncontrolled up to 13% annually, until shut down by the Fed in the period of 1980-1983.
In the fall of 2026, we will see whether the Fed actively or passively fights inflation. Either way, the 10-year T-Note and FRM rates will rise well into 2027 which acts to cool the economy, and thus inflation.
Confidence about what 12 months will bring
To you stalwart members of the real estate profession, a gift: the ability to forecast the probability of future recessions and rebounds, one year forward. This famed and reliable crystal ball is the yield curve spread, also simply called the yield spread.
Again, the yield spread figure is the difference between two key interest rates:
- 10-year Treasury note (T-Note) rate (or long-term rate) set by bond market investor outlook; minus the
- 3-month Treasury bill rate (or short-term rate) set by the Federal Reserve (the Fed) activity.
Don’t let the name yield spread put you off. It is not related to the deceptive yield spread premium (YSP) kickback mortgage lenders paid brokers in times before MLO regulations.
The yield spread reflects economic conditions as interpreted by Fed and bond market investors. When the Fed acts unacceptably, the bond market investors react to force the Fed to change its behavior. The key word here is ‘interpreted’ as both the Fed and the bond investors are concerned about inflation and economic stability.
The yield spread figure is generated, on the one hand, by the Fed using its short-term rate to combat unacceptable inflation in consumer prices and wages. On the other hand, you have the collective wisdom of global investors who set the 10-year Treasury note rate based on long-term inflation expectations.
The two positions are diametrically opposed economic perspectives but still seek the same end result for inflation. But only the Fed uses its action or inaction to consistently maintain their monetary policy of 2% annual consumer inflation. The bond market, once they determine the present and forward rate of inflation is increasing, merely increases the interest rate they demand to include the anticipated rate of inflation.
Related chart:
The short-term market rate
The initial piece of information needed to calculate the yield spread is the interest rate on the 3-month Treasury bill. This interest rate is influenced exclusively by the Fed as the base price of short-term borrowing. It is the Fed’s primary tool for keeping the U.S. economy balanced.
The Fed has direct control over this short-term rate through its Federal Funds Rate. The Fed can:
- lower interest rates and stimulate economic growth to stave off deflation and economic stagnation; or
- raise interest rates and slow economic growth to fight inflation and excess demands for labor.
Collectively, the Fed’s use of short-term interest rates and other infusions and withdrawals of dollars to control the economy is known as monetary policy.
Related article:
The long-term market rate
To make a real profit on their long-term investments, bond market investors generally consider how the Fed’s current monetary policy will impact the future performance of consumer inflation rates. These millions of world-wide individual and institutional investors forecast future economic conditions, characterized as the wisdom of the crowd.
These forecasts are reflected in the 10-year T-Note bond market rates, which are a ready gauge for determining future market conditions (and mortgage rates).
These 10-year T-Note investors consider two discrete elements for the interest rate they demand:
- their desired fixed rate of return on the investment before adjustments for inflation risks, called the real rate of return;
- perceived future rate of inflation, called the inflation risk premium; and
- collectively, the two rates are built into the 10-year T-Note rate which is otherwise considered risk free.
Interplay between the treasury rates = the yield spread
Calculating the yield spread is simply a matter of subtracting the 3-month T-Bill rate from the 10-year T-Note rate. Never the other way around.
Generally, a low or declining yield spread indicates a less vigorous economy one year forward, the outlook of the crowd. A declining yield spread is a result of bond market investors seeing less future growth resulting from the Fed’s short-term rate activity and other economic interruptions or stimulus — the global economy’s relationship to ours.
On the flip side of an economic cycle, a higher or rising yield spread indicates a more vigorous future economy. While good for bond market investors who park their money in bonds or shift their cash into investment opportunities for profit, a too-high yield spread (and its resulting boom) suggests the danger of an increase in consumer inflation and excessive wage growth.
When the spread is unacceptably high, the Fed acts to curtail the growth of future jobs and stabilize consumer prices by initially raising short-term rates — which reduces the spread.
An over-correction by the Fed raising short-term interest rates too high has the potential to send the yield spread into low or negative levels. When the yield spread goes negative for a period of around four months, called an inversion, a recession follows 12 months later. Most recessions are Fed initiated to reduce economic distortions. Periods of pandemics and wars bring on recessionary periods by themselves which are chaotic in behavior.
A yield spread inversion is the result of the:
- bond market envisioning a future downturn in the economy; and/or
- Fed raising short-term interest rates to correct consumer inflation by tightening money market conditions.
An inversion moment in the yield spread gives the real estate broker and agent a signal to adjust their business services to meet a likely change in consumer behavior. At the crossover into a negative yield spread, agents can expect a reduced volume in sales, lending and leasing one year forward.
Then, in a further 12 months, a drop in prices, mortgage rates and rents are experienced. This 12-month delay after sales volume turns downward is the result called the sticky price phenomenon, brought about by money illusions held by sellers and landlords.
Related chart:
Real estate’s stake
Going forward, more and more brokers and agents will learn and apply the workings of the yield spread as a gauge of the economy’s direction for the coming 12 months. Only then, with this insight as advice, will industry-wide frenzies to over-build, over-price and over-acquire property of all types be tempered.
Brokers and agents who track the yield spread glean the foresight needed to shift their advice given to clients and personal spending before the changes in the market actually occur.
In doing so they will seek out recession-proof niches of real estate in which to weather the economic storm, such as:
- seller-in-foreclosure sales and short sales;
- services needed for lender owned real estate (REO) sales;
- MLO endorsement for originations due to refinancing at lower FRM rates;
- an escrow department;
- property insurance department;
- notary service; or
- property management.
Related chart:
Buyer Purchasing Power Index (BPPI) hints at rising as home price adjustment sets in











The ideas around the yield spread figure ran negative were useful and easy to follow. Thanks for putting this together.
It’s interesting how the article points out that the yield spread dipping below zero has consistently signaled a recession approximately 12 months later, ever since 1960. That’s a pretty strong track record for a forecasting tool. It really highlights why real estate professionals need to keep an eye on these indicators to advise clients effectively.
It’s interesting how the article delves into the specifics of the yield spread, explaining it as the percentage point difference between short-term Fed rates and the 10-year Treasury note. This distinction helps clarify why real estate professionals find this tool so valuable for forecasting, especially with all the current market fluctuations.
It’s interesting how the article points out that the property markets have been in their own recession for nearly 45 months, despite the fluctuations in the broader economic indicators. This really highlights the unique pressures faced by real estate professionals right now, going beyond just the yield spread.
It’s interesting how the article points out that the yield spread dipping below zero corresponds to the short-term rate rising above the long-term rate. That ‘inversion point’ always signals something significant, and the historical trend of a recession following about 12 months later is a crucial detail for anyone trying to anticipate market shifts.
It’s interesting how the article points out that while the yield spread was profoundly negative in 2024, similar to 1981, trade wars in early 2025 shifted investor attitude. This volatility in the 10-year T-Note rate really highlights how unpredictable global events can be, even with supposedly reliable indicators I found this especially useful.!
It’s interesting how the article points out that while the yield spread was profoundly negative in 2024, similar to 1981, trade wars in early 2025 shifted investor attitude. This volatility in the 10-year T-Note rate really highlights how unpredictable global events can be, even with supposedly reliable indicators.
It’s interesting how the article points out that the yield spread dipping below zero happens when the short-term rate rises above the long-term rate, marking the inversion point. That’s a crucial detail for understanding the recession forecasting aspect.
That move from a deeply negative spread in 2024 to only slightly positive now felt like the key detail, because you resist treating one reading as a verdict and keep the uncertainty honest for people advising clients.
It’s fascinating how the yield spread can predict market trends, especially in a volatile market like California’s. I was checking out GPT Image 2 Gallery and noticed their AI-generated images can reflect changing investor attitudes too. It’s amazing how technology is bridging different fields.
Use the free GPT Image 2 generator online to create AI images, posters, product shots, ads, avatars, and social graphics from simple prompts.
Understanding yield spread is crucial for real estate professionals, especially in California, where global influences create uncertainty, as the article highlights the need to guide practice and advise clients during different business cycle phases.