
Why this matters: Borrowing power and home prices affect the financial readiness of homebuyers dependent on mortgage funds. After 2012 and until 2025, the financial circumstances for homebuyers worsened annually on all three critical acquisition factors: Wage increases did not match consumer inflation rates, home price asset inflation far outran the rate of wage increases, and FRM rates rose to shift wealth from capital assets to cash, the latter factor edging the BPPI increasingly negative over the period.
With recent financial adjustments, wages now track with consumer inflation, and the FRM rate is expected to slip slightly to set a positive trend for the BPPI as this real estate recession deepens. However, home prices have not adjusted but must in order to attract buyers and offset rising for-sale inventories.
Buyer Purchasing Power is about to normalize, not so for property pricing
The California Buyer Purchasing Power Index (BPPI) figure is positive, at +1.02 in the second quarter (Q2) of 2025. This figure tells us a homebuyer with the same income is able to borrow 1.02% more purchase-assist mortgage money than a year ago, plus the COLA (or cost of living adjustment) percentage of wage increases. By end of 2024, FRM rates completed an adjustment to bond market rates following the pandemic economy stimulus rates of less than half of today’s level.
The BPPI is calculated using the average 30-year fixed rate mortgage (FRM) rate from Freddie Mac and the median income in California.
A positive index number means buyers can borrow more money this year than one year earlier.
A negative index figure translates to a reduced amount of mortgage funds available.
An index of zero means there was no year-over-year change in the amount a buyer can borrow with the same income. At a BPPI of zero, homebuyers cannot purchase at higher prices than one year before unless they resort to adjustable rate mortgages (ARMs) to extend their borrowing reach, significantly increase their wages, or accumulate a greater amount of down payment.
Note: In 2019 as the 2020 recession approached, the BPPI moved positive after annually trending negative following the 2013 commencement of a half-cycle of rising mortgage rates. In 2020, the pandemic economy set in and the Federal Reserve took over the mortgage bond market to cut FRM rates in half. Thus, declining FRM rates in 2019-2021 kept the BPPI positive, but home prices quickly increased around 30% to fully offset the advantage of the positive BPPI.
The effect of BPPI on home prices
Heading into 2022, the BPPI took a dive deep into negative terrain to reflect lost borrowing capacity for homebuyers and owners as FRM rates doubled. In the same period, sales volume and prices peaked in unusually fast succession, an unfriendly omen for property sales volume.
Throughout 2023, the negative BPPI gradually rose to zero, but it wasn’t due to lower FRM rates. Rather, the zero-level BPPI reflected a year-long “normalizing” of mortgage rates.
Consider a household in Q2 2021 when the 30-year FRM rate was at 2.7%. As a buyer, the household qualified to borrow a maximum of $364,000 to fund the purchase of a home. Compare that mortgage amount with the amount available in June 2025 at the 30-year FRM rate of 6.82%. The same household income – without COLA adjustments – now qualifies the buyer to borrow just $238,500 — 34% less money to fund the purchase of the same home.
Mathematically, an employed homebuyer’s borrowing capacity sets what they can pay for a home with their down payment and mortgage funding paying for the price of the home. Thus, today, the same price tag on the 2021 home is now 53% over the price the same borrower can pay today, before accounting for any added borrowing capacity for COLA wage increases over the four-year period.
Critically, home prices received by sellers absorb the reduction in borrowed funds available to buyers. Economic reality offsets a rise in mortgage rates with a drop in property prices. The logic is that the present value (PV) rising FRM rates cost is offset by a drop in property prices since borrowing is based on wages. In turn, wage increases are tied to consumer inflation, not inflated asset evaluation.
An irony is involved. When FRM rates increase, seller pricing moves down slowly, taking 24 to 36 months to fully absorb the diminution in funds available to buyers, called the sticky price phenomenon. Conversely, when FRM rates drop, seller pricing moves up rapidly, taking less than 12 months to fully absorb the additional funding available to buyers.
The difference with rising FRM rates comes down to sellers’ natural resistance to lowering their asking price for a property that hasn’t changed in their eyes. For an agent, it is comparatively easy to ask a seller to raise their asking price rather than insist they lower it to attract a buyer.
In 2025, the low level of inventory for sale is quickly rising as homeowner turnover ticks up and the annual spring buyer demand did not reduce inventories. In analysis, the real estate market has begun the pricing correction proffered by a recession and driven by FRM rate increases.
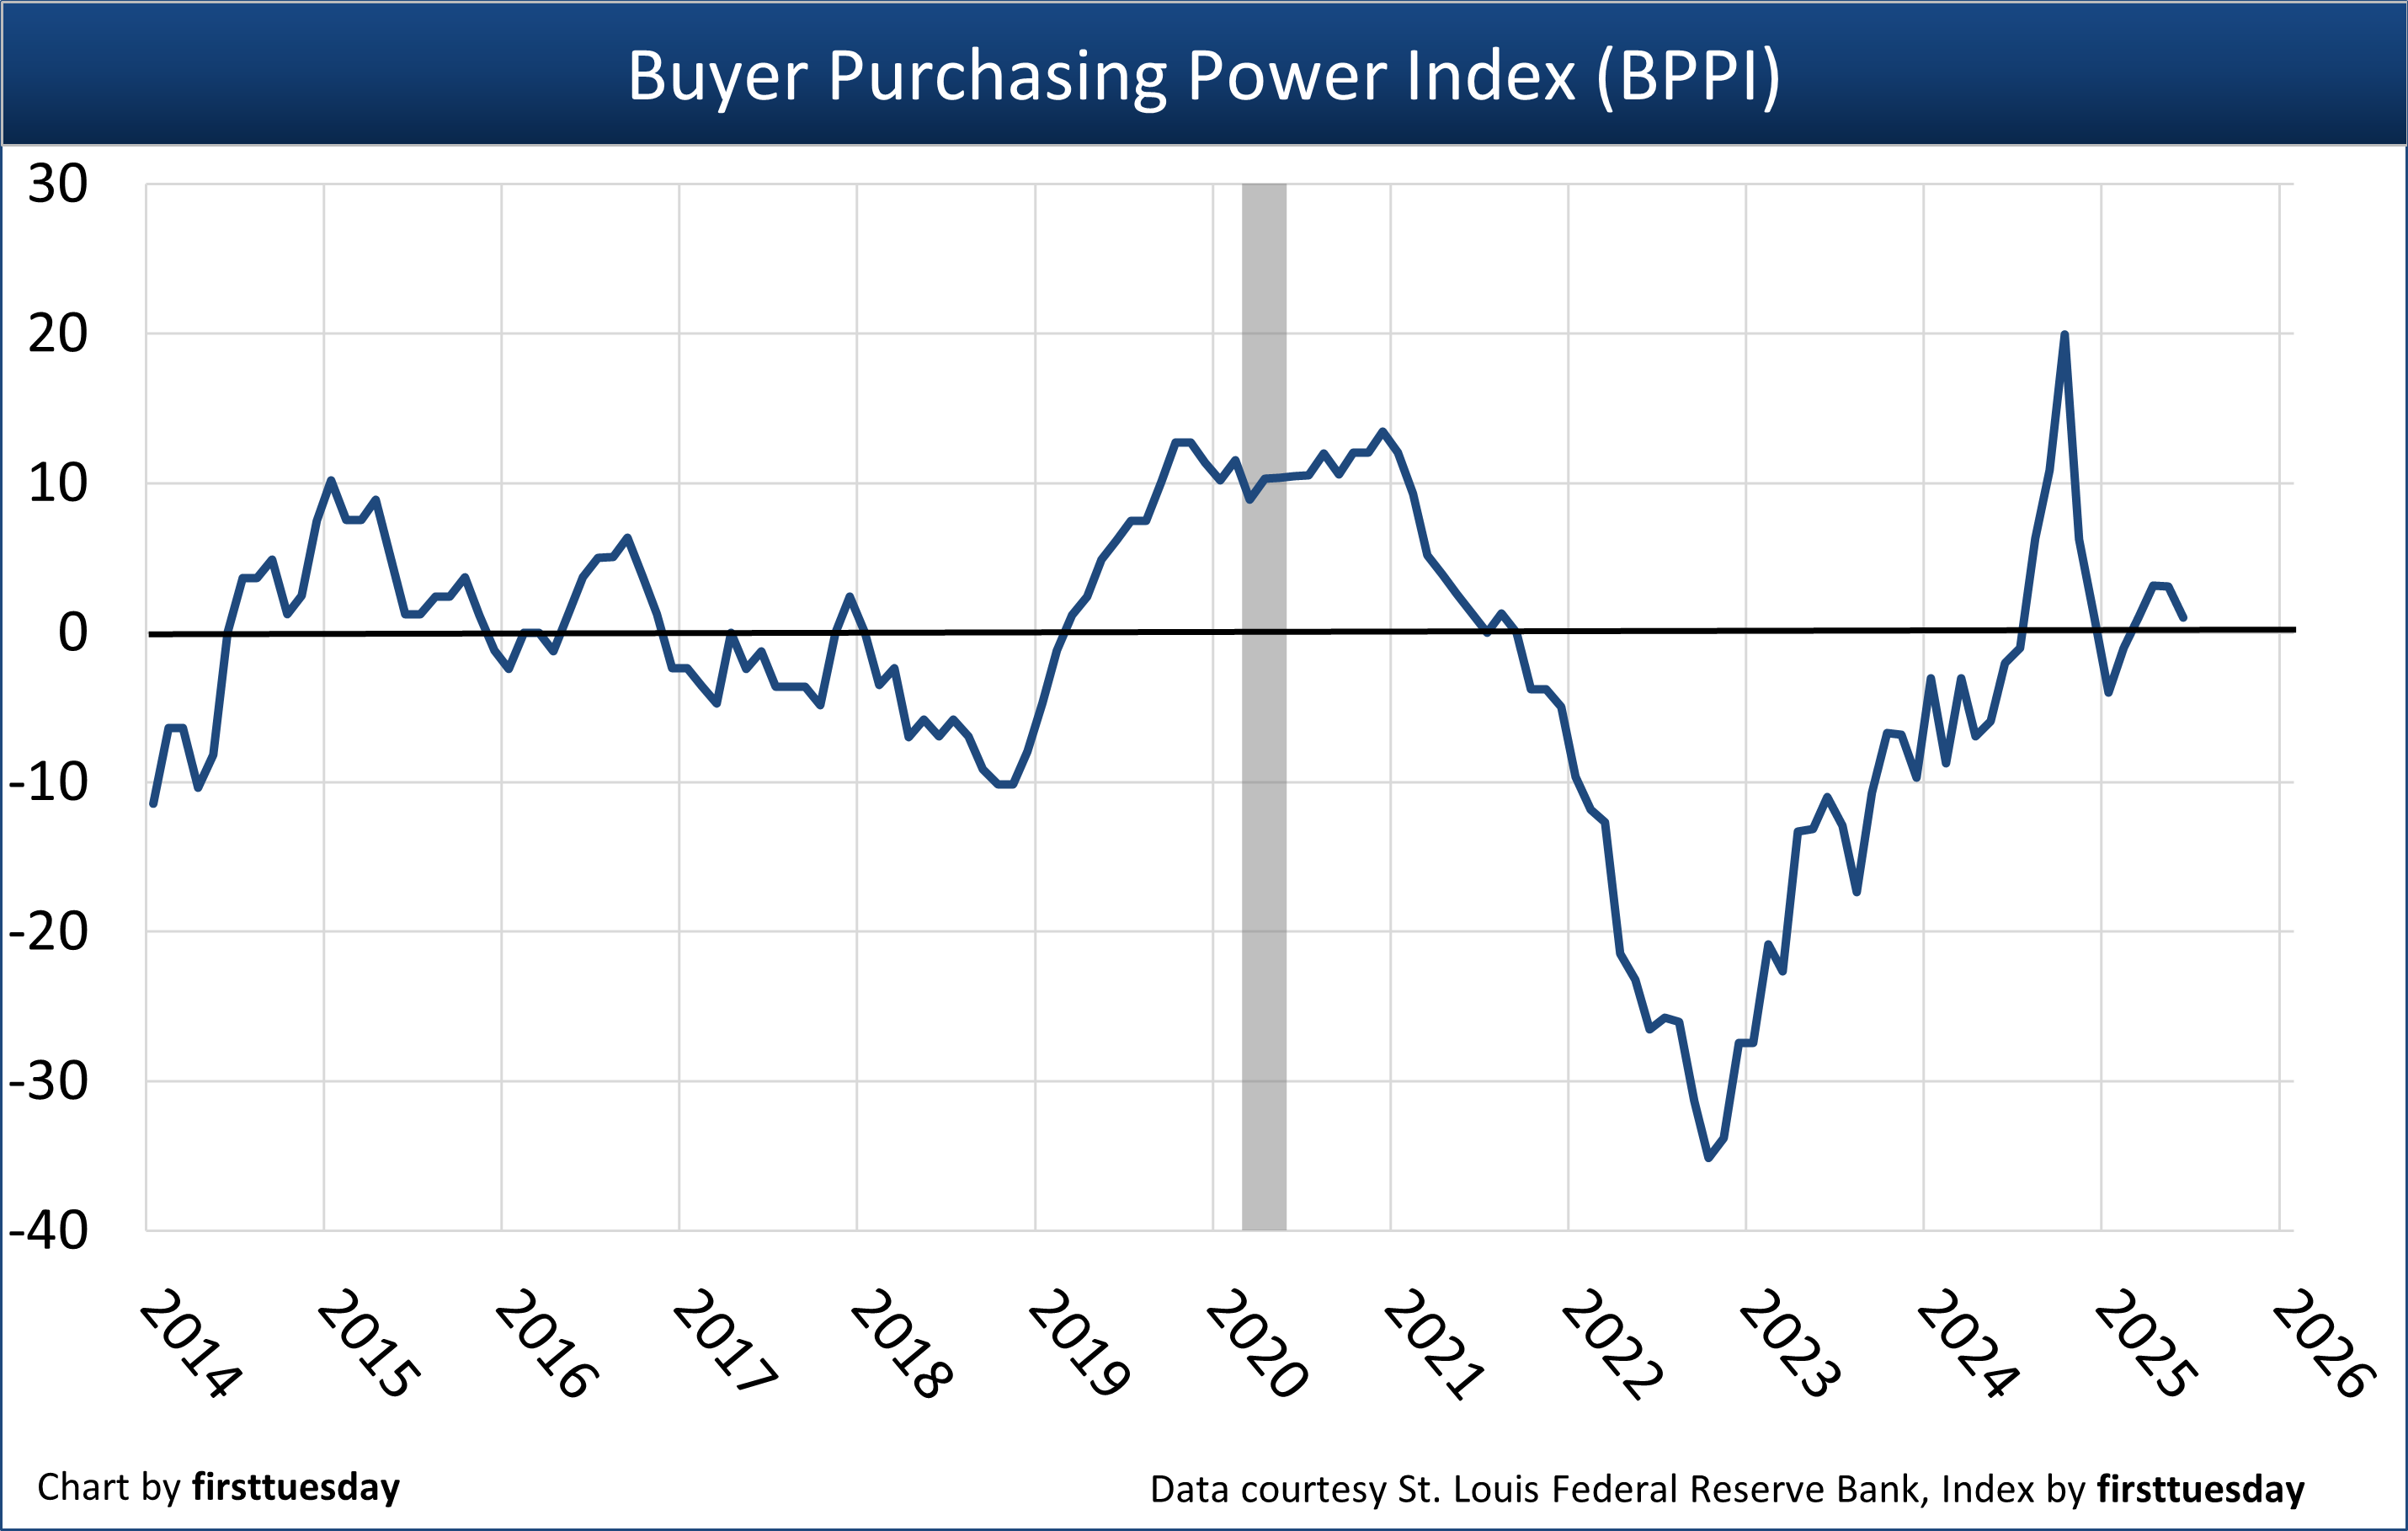
Chart update 7/2/25
| Q2 2025 | Q1 2025 | Q2 2024 | |
| Buyer Purchasing Power Index (BPPI) | +1.02 | +1.04 | -2.03 |
The BPPI foreshadows home price movement
As the BPPI begins a recessionary period by trending positive for mortgage-reliant buyers, the asking price for homes has begun to decline driven by the past year’s dramatic 30% increase in the inventory of homes for sale. Price decline is a fundamentally different but positive condition for buyers compared to an also buyer-friendly positive BPPI figure. When they evolve concurrently, homebuyers become cautious and tend to wait and calculate before becoming willing to make offers.
Today’s mortgage rate and pricing trends will likely continue for 18 to 30 months with rapid downward price adjustments by sellers who need to dispose of their real estate.
In the current 30-year half cycle of rising mortgage rates, which began in January 2013, the seller in the real estate market is adversely affected by a melting away of their home equity and thus the level of solvency. On the other hand, prospective buyers paid the same monthly payment for shelter at a maximum of 31% of their gross income when they maintained their standard of living.
A reallocation of national wealth is underway, long term. When FRM rates increase, mortgage investors – lenders – pick up an increased portfolio yield in interest earnings. The increased yield represents a shift in wealth equal to the annual cost at the higher mortgage rate or the present value (PV). This is also the amount of reduction in the seller’s equity, hence the reallocation. The homebuyer’s financial position is always a constant – 31% of gross income equals the payment for shelter, whether it’s rent or mortgage payments (plus operating expenses).
Homebuyers qualify for a maximum mortgage amount based on:
- their incomes and savings; and
- shifting interest rates.
Sellers are slowly discovering, as are seller agents, that the math of increased mortgage rates for a homebuyer’s purchase-assist funding leaves all property worth less in price.
In California, home prices have lost all the pandemic momentum. As of January 2025, average California home prices started to slip — up 1% for low-tier and down 2% and 3% for mid- and high-tier — from their May 2022 peak. Remember, high-tier properties peak and decline in price before the low-tier begins its decline, and when prices rise, the high-tier is the first to move up.
Declining prices will likely bottom next around 2027 or 2028, brought on by the initial arrival of speculators and investors to provide a short-term pick up in sales volume and a temporary “dead cat” price bump. Prices then start to rise without slipping over several months until ready and able buyer-occupants sense a rise in pricing and they return to buy, as they do in every recovery period.
Also, during the decade ahead expect downward pressure on prices for all types of property due to the foreseeable long-term rise in the cost of mortgage funds.
Accordingly, the long-term outlook for the BPPI is a decades-long period of annually remaining just below zero, as mortgage rates resume their rise with the next economic recovery, likely to find its legs around 2028.
Again, in a real estate recession homebuyers increasingly take a wait-and-see approach to buying as they become more aware of the market conditions for future price reduction. Homebuyers buy on the rise, not the dip in prices. Today’s global disruption in commerce has everyone’s attention. Thus, buyers are increasingly attentive to real estate market conditions and become financially more cautious and less willing to buy without significant reduction in seller pricing (or mortgage rates).
Planning for the next several years in real estate transactions will require patience and a very different approach to the past decades of recovery economics driven by constant mortgage rate decreases from 1983 until 2013.
To keep the inventory of homes-for-sale changing hands at an optimal pace, sellers on the advice of their agents need to lower prices to accommodate buyer purchasing power or pull their properties off the market.
Proactive seller agents may need to fire sellers who harbor deal-killing illusions of past pricing.
Related article:


