
Why this matters: Vacancy rates are up in all SoCal sectors and counties, aside from Orange County office and a slight year-over decrease for Los Angeles industrial. Net absorption remains negative for San Diego and Orange County but turned positive for Los Angeles and Inland Empire industrial in 2025.
Commercial property outlook
The fourth quarter (Q4) 2025 reports on the Southern California (SoCal) commercial property market are in, courtesy of data by VOIT Real Estate Services.
SoCal’s commercial market — comprised of San Diego, Orange County, Los Angeles and the Inland Empire — has experienced a rollercoaster in tenant demand during the past five years, with industrial real estate reaching record lows in vacancy and availability in 2022. Meanwhile, all economic factors affecting leasing have slowly deteriorated into the present economic uncertainty about the immediate future.
Beginning in 2025, chaotic national and global trade and migration policies disrupted what was a consistent tenant demand in the industrial real estate sector. Now entering 2026, vacancy rates are slowly trending higher with no sign of topping out. Tenants are cautiously waiting for normalcy to return to the real estate market before they make strategic decisions about location, needs for space or pricing of rent.
Office real estate has been struggling since the pandemic with the discovery remote work, well, actually works. With altered return-to-office policies largely in place, office vacancies in San Diego and Orange County are approaching 15%. Expect the repurposing of many vacant office buildings with residential conversions for permanent removal from the office market as the long-term solution to vacancies.
A significant percentage of retail operations are closing — insolvent — or positioning to close across the country, and SoCal is no exception. Here, we can expect more store closures as the undeclared recession ramps up vacancy rates and further suppresses services and industrial output while job losses increase.
Read on for a more specific view of the SoCal commercial market.
San Diego County — industrial, office and retail
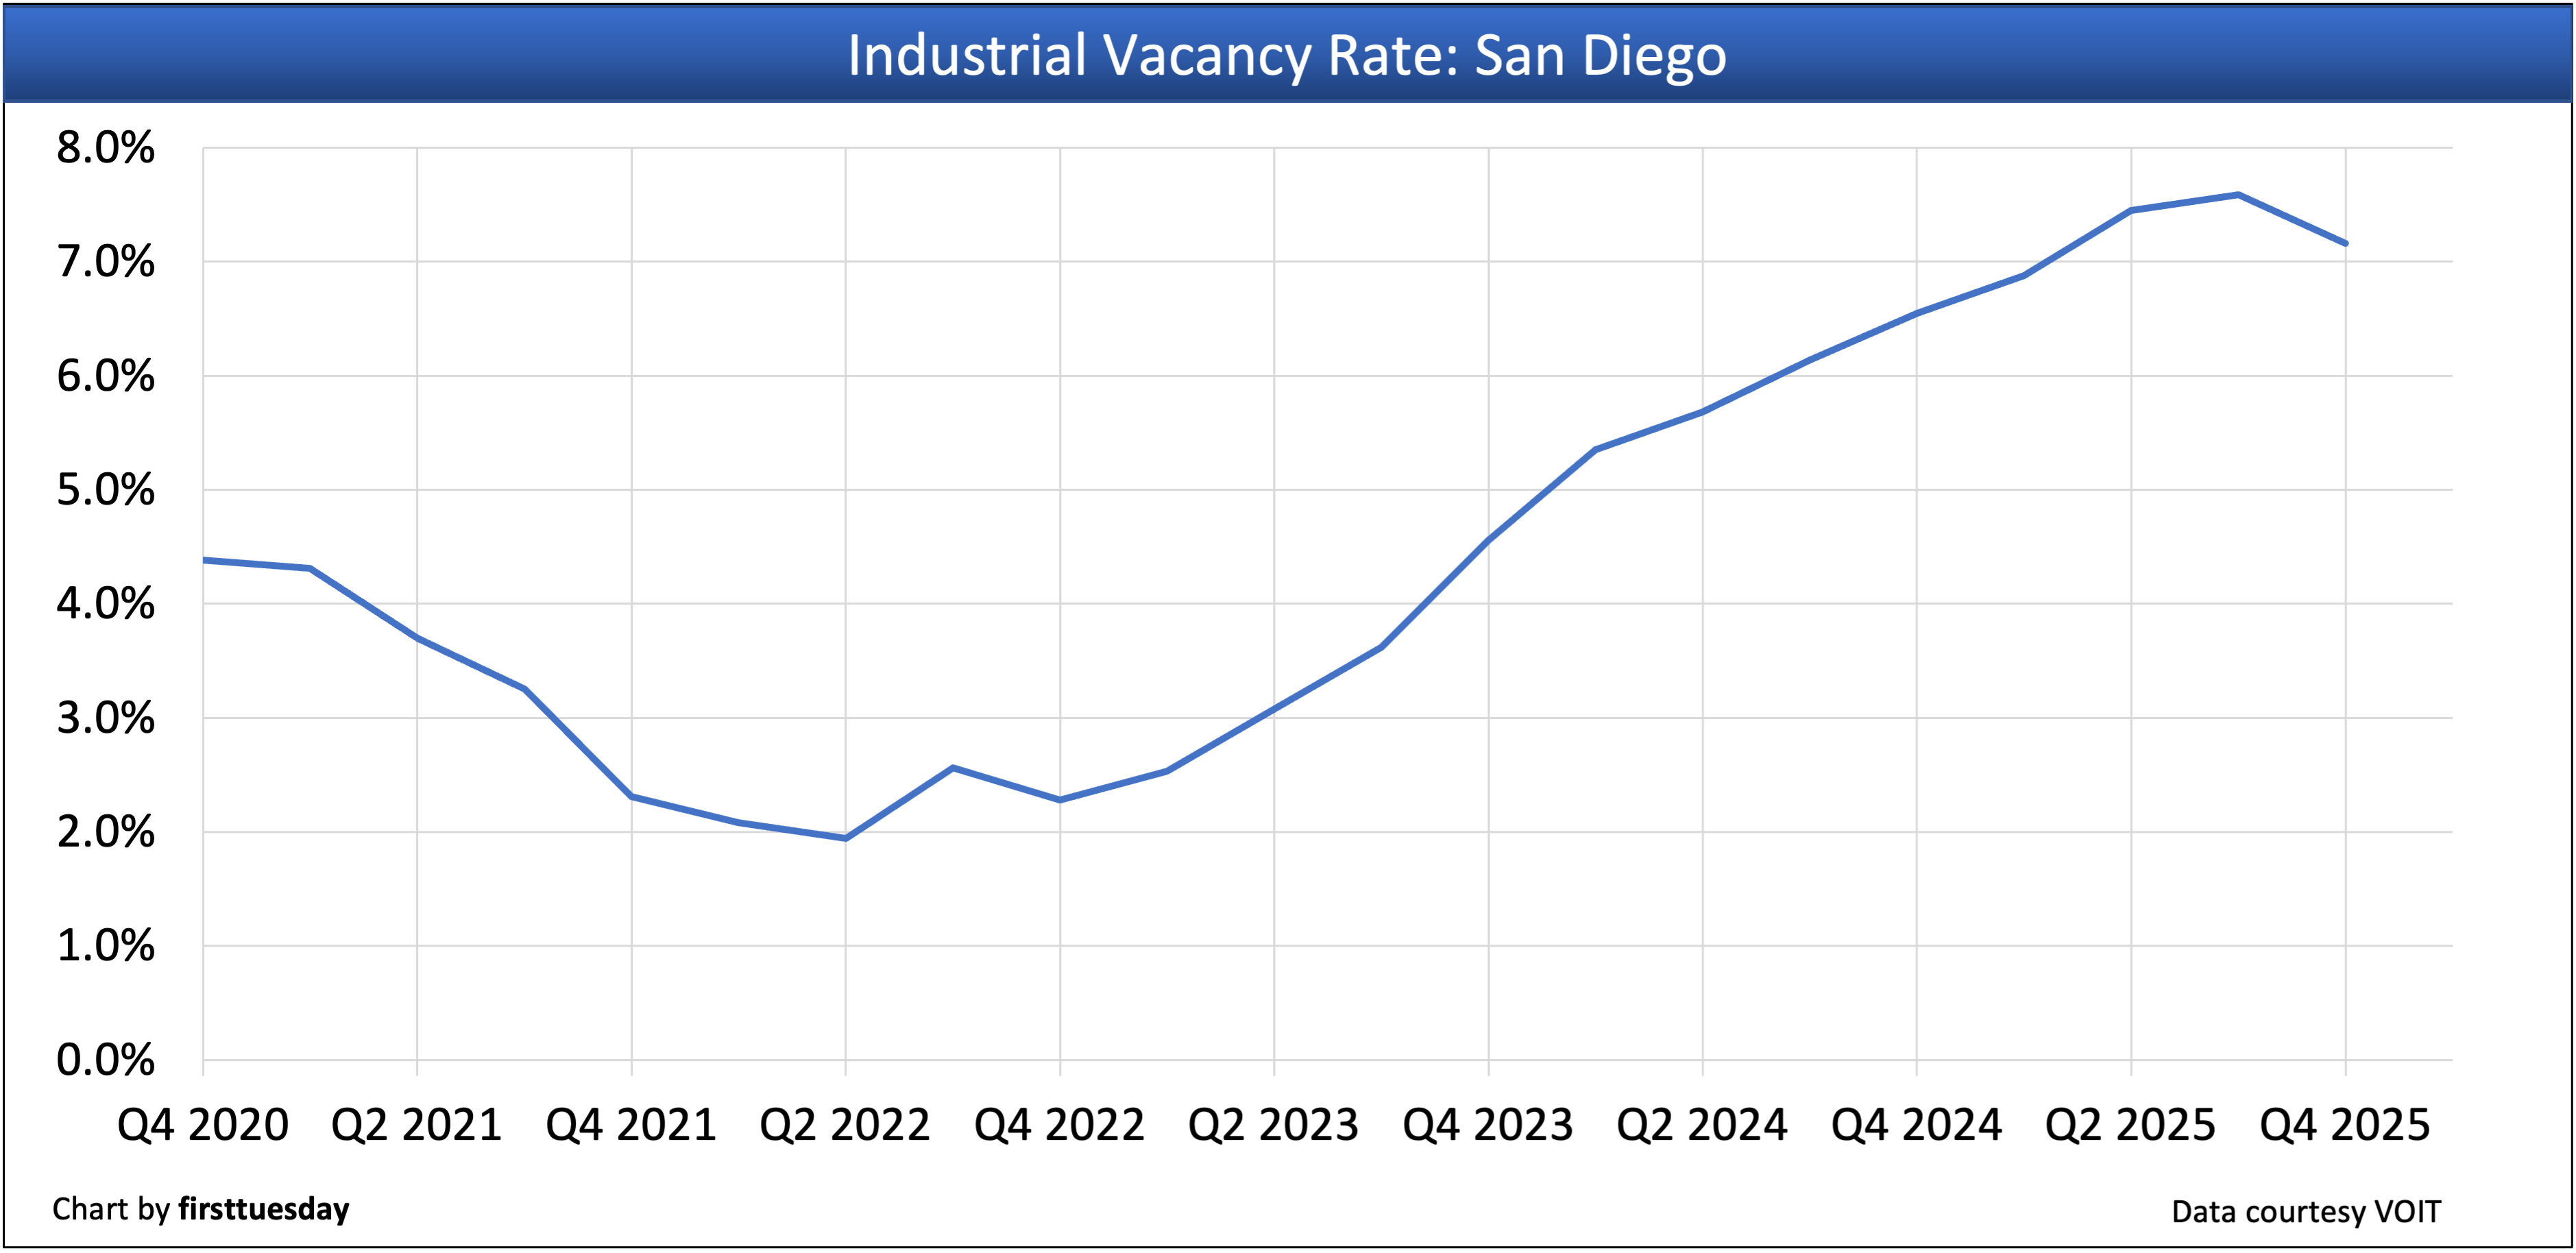
San Diego County’s industrial vacancy rate is:
- 7.16% in Q4 2025;
- down from 7.56% in Q3 2025; and
- up from 6.46% in Q4 2024.
Conclusion: The vacancy rate is higher year-over and vacillating but not yet showing a reversal in its upward trend.
San Diego’s industrial net absorption — the total change in occupied industrial space during the quarter — is:
- +630,717 square feet in Q4 2025;
- up from -243,317 square feet in Q3 2025; and
- up from +43,818 square feet in Q4 2024.
Conclusion: Despite the last quarter turning positive, the trend for 2026 is continued negative net absorption. 2025 marks three consecutive years of negative net absorption. Compare to 2008-2009 which had only two consecutive years of negative net absorption. The differing recession duration periods are most likely due to the difference between a garden-variety business recession and a pandemic-induced recession rather than the global trade chaos of 2025.
San Diego County’s office vacancy rate is:
- 14.12% in Q4 2025;
- up from 14.02% in Q3 2025; and
- up significantly from 12.51% in Q4 2024.
Conclusion: No signs of a correction in increasing vacancies for San Diego office space.
San Diego County’s office net absorption rate — the total change in occupied office space during the quarter — is:
- -115,749 square feet in Q4 2025;
- lower than -261,655 square feet in Q3 2025; and
- down slightly from -137,808 square feet in Q4 2024.
Conclusion: 2025 finished with 462,625 square feet of negative net absorption, marking the third consecutive year of negative net absorption and shrinking demand for office space occupied by services.
San Diego County’s retail vacancy rate is:
- 4.51% in Q4 2025;
- up slightly from 4.47% in Q3 2025; and
- up from 4.01% in Q4 2024.
Conclusion: Store closures are the primary cause of the increased vacancy rate. Despite San Diego’s increase in population, the total number of retail stores is slightly below the level a decade ago. The trend in reduced retail space is destined to continue as delivery services are expanding and onsite sales decrease. Shopping centers look to become cultural event locations or residential buildouts.
San Diego County’s retail net absorption rate — the total change in occupied retail space during the quarter — is:
- +33,520 square feet in Q4 2025;
- up from -153,117 square feet in Q3 2025; and
- down from +181,724 square feet in Q4 2024.
Conclusion: 2025 finished with 677,032 square feet of negative net absorption amid widespread store closures. There were more store closures in 2025 than in 2024. Expect the pace of job losses and business closures to continue in 2026 and beyond.
Orange County — industrial and office
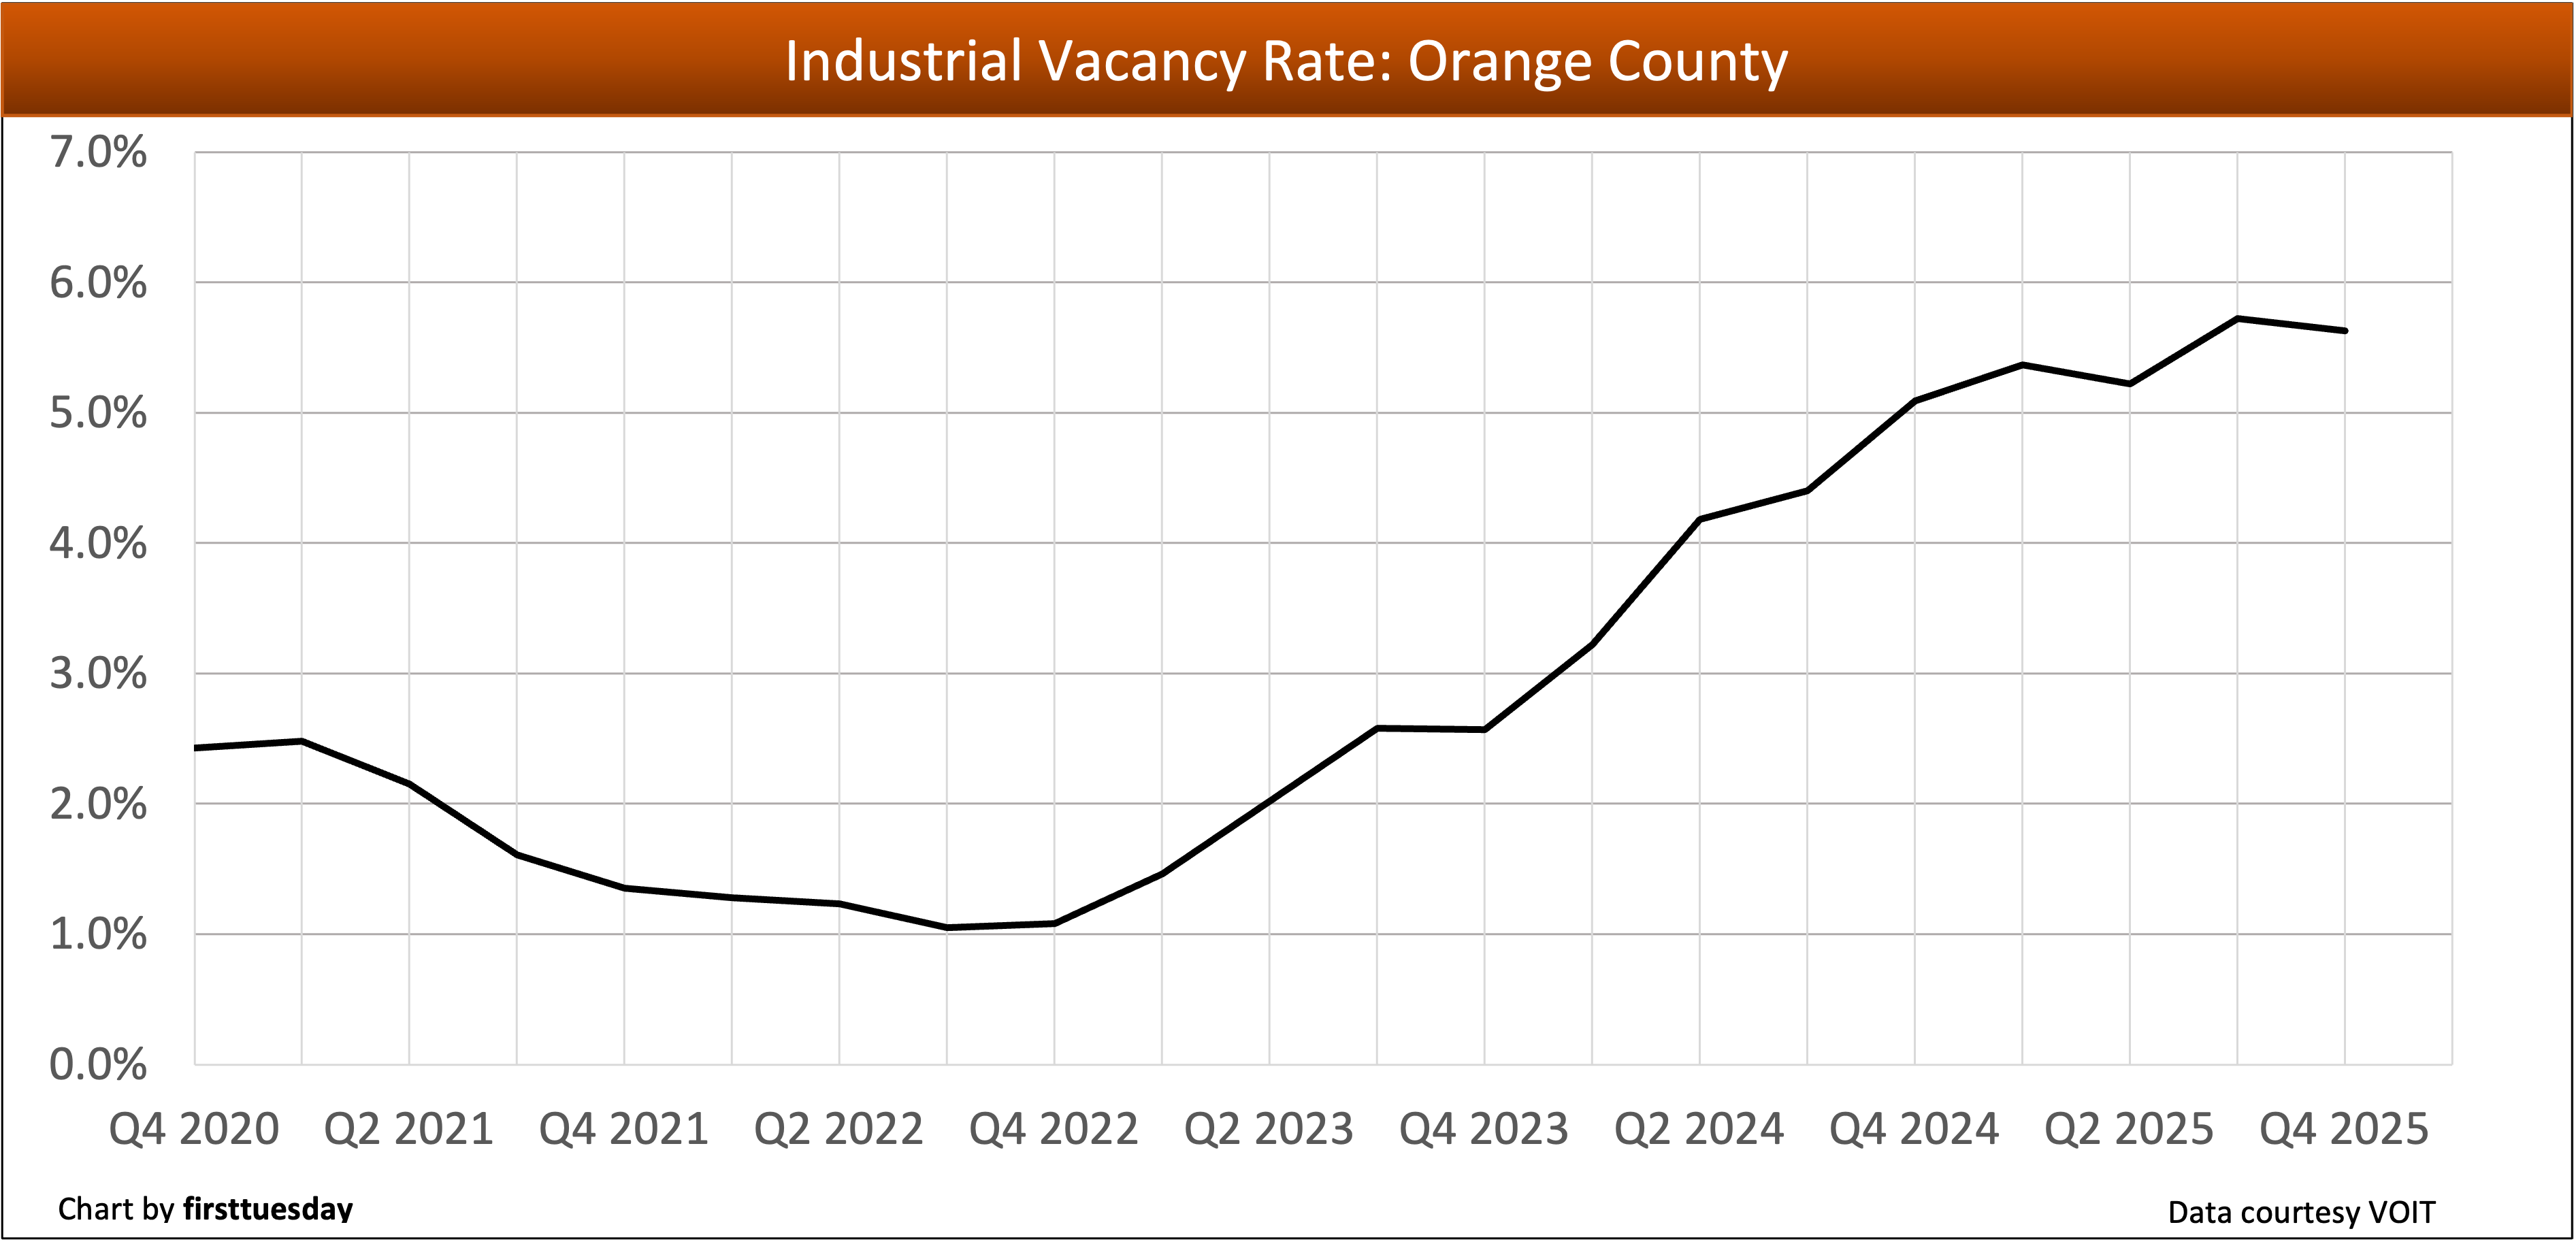
Orange County’s industrial vacancy rate is:
- 5.63% in Q4 2025;
- down from 5.72% in Q3 2025; and
- up from 5.09% in Q4 2024.
Conclusion: The vacancy rate for Orange County industrial real estate has risen from its 2022 trough but shows no sign of reversing course in 2026. The attraction of lower-priced space in Riverside County will pull tenants out of Orange County as leases expire.
Orange County’s industrial net absorption rate is:
- +286,194 square feet in Q4 2025;
- up from -612,876 square feet in Q3 2025; and
- up significantly from -1,042,116 square feet in Q4 2024.
Conclusion: While Q4 2025 finished with slight positive net absorption, 2025 had a negative net absorption rate. Expect the Orange County industrial market to remain unstable and subject to increasing vacancies as the general trend, aggravated by the global trade upheaval. Related uncertainties adversely affecting future needs of storage and distribution companies is the likely culprit, together with commonplace inflexibility of owners in negotiations.
Orange County’s office vacancy rate is:
- 14.55% in Q4 2025;
- down from 15.16% in Q3 2025; and
- down from 16.07% in Q4 2024.
Conclusion: While slipping due to some conversion to residential, Orange County office space remains highly elevated in vacancies. 2015 through 2019 saw vacancy rates around 10% to 12% for comparison.
Orange County’s office net absorption rate is:
- +597,932 square feet in Q4 2025;
- up from +415,296 square feet in Q3 2025; and
- up from -47,400 square feet in Q4 2024.
Conclusion: Office real estate is attempting to stabilize but has a long recovery ahead. The reality is it faces an inevitable uptick in the recession in the near future which will shrink the service economy of Orange County.
Los Angeles County — industrial
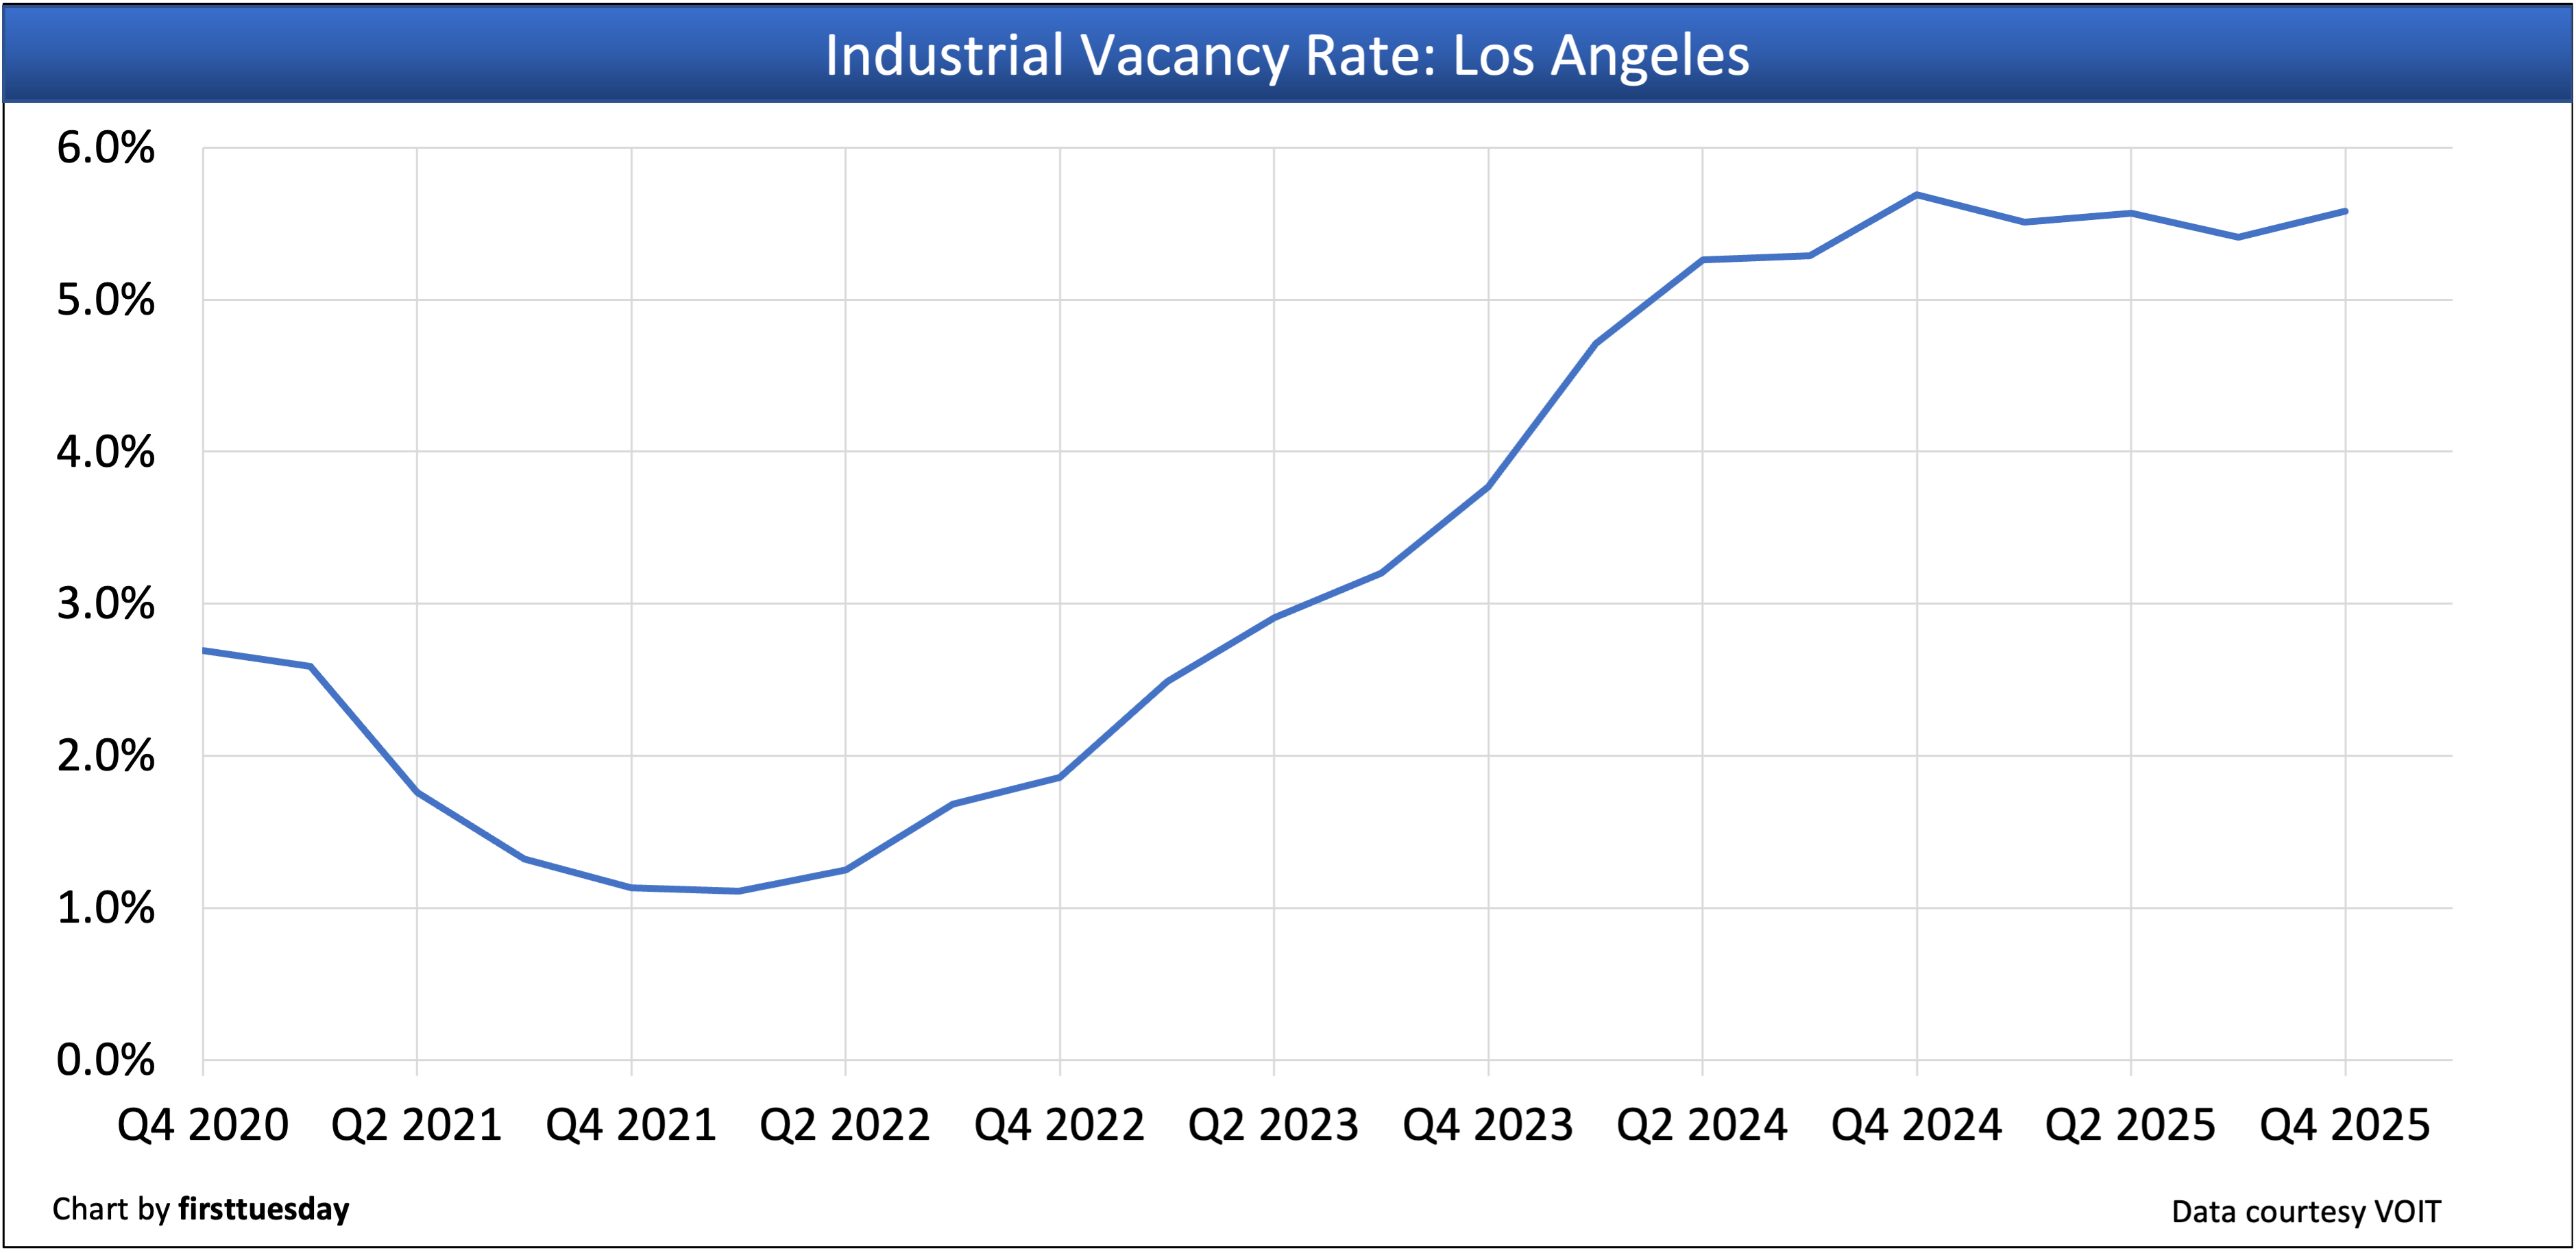
Los Angeles County’s industrial vacancy rate is:
- 5.58% in Q4 2025;
- up from 5.41% in Q3 2025; and
- down slightly from 5.69% in Q4 2024.
Conclusion: Commercial tenants continue to be cautious, reluctant to make long-term leasing decisions due to tariffs and economic uncertainty.
Los Angeles County’s industrial net absorption rate is:
- -1,148,609 square feet in Q4 2025;
- down significantly from +2,122,617 square feet in Q3 2025; and
- up from -1,671,492 square feet in Q4 2024.
Conclusion: The total net absorption for the year was positive, with 1.18 million square feet of positive net absorption. The 2025 uptick probably will not hold in 2026 with tenant turnover relocating to less costly neighboring counties or reducing space.
Inland Empire — industrial
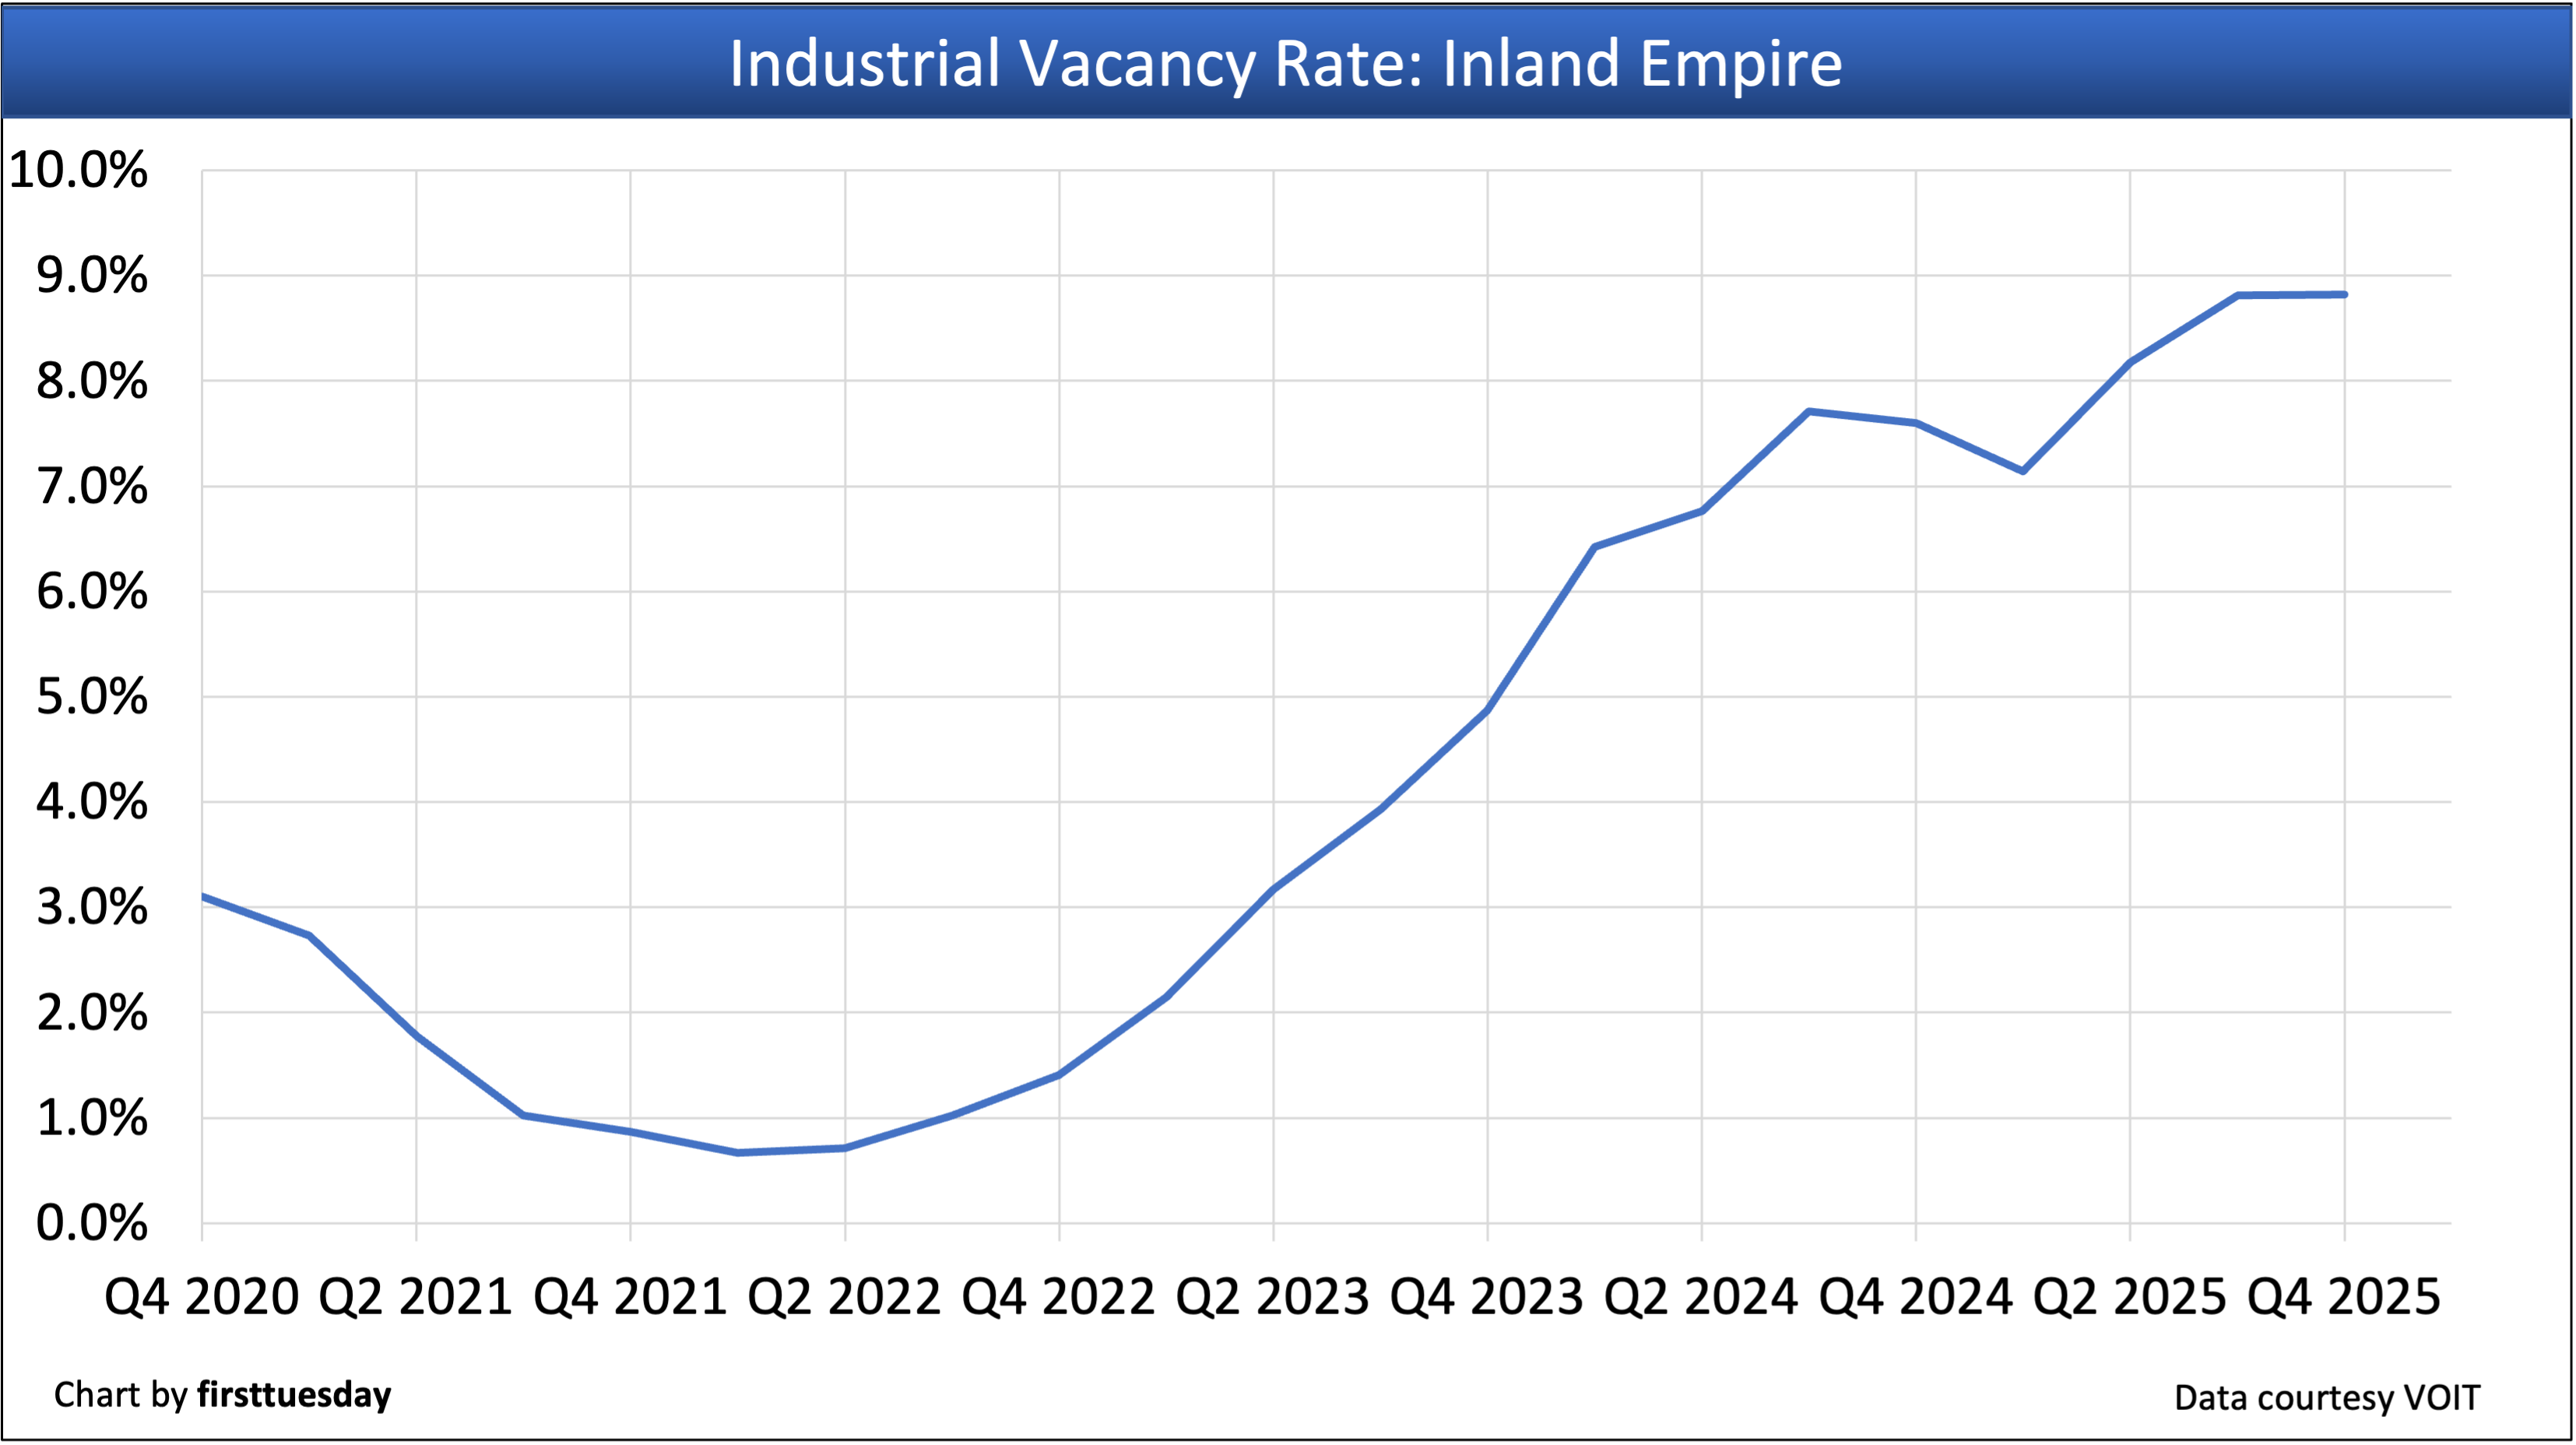
The Inland Empire’s industrial vacancy rate is:
- 8.82% in Q4 2025;
- down from 8.95% in Q3 2025; and
- up from 7.69% in Q4 2024.
Conclusion: Inland Empire industrial vacancies are on an upward trend as more supply is added to the market and distribution operations are closing down.
The Inland Empire’s industrial net absorption rate is:
- +1,877,631 square feet in Q4 2025;
- up from -481,144 square feet in Q3 2025; and
- down from +5,202,310 square feet in Q4 2024.
Conclusion: 2025’s volatility in trade policy led to a reduced demand for warehouse space, a trend likely to continue in 2026. However, Inland Empire industrial saw 1.86 million square feet of positive net absorption for 2025.
Related articles:


This is a thoughtful overview of how Southern California’s commercial property market is facing challenges in Q4 2025. The insights on occupancy, demand shifts, and economic pressures are helpful for anyone tracking real estate trends in the region.