

Why this matters: Real estate agents who check out readily available market data improve their ability to correctly advise clients. Insight into today’s deepening uncertainty about all factors driving California property values is best tackled by a continuous review into the present non-stop change in human behavior affecting real estate transactions.
The cyclical rise in mortgage rates bent by wars
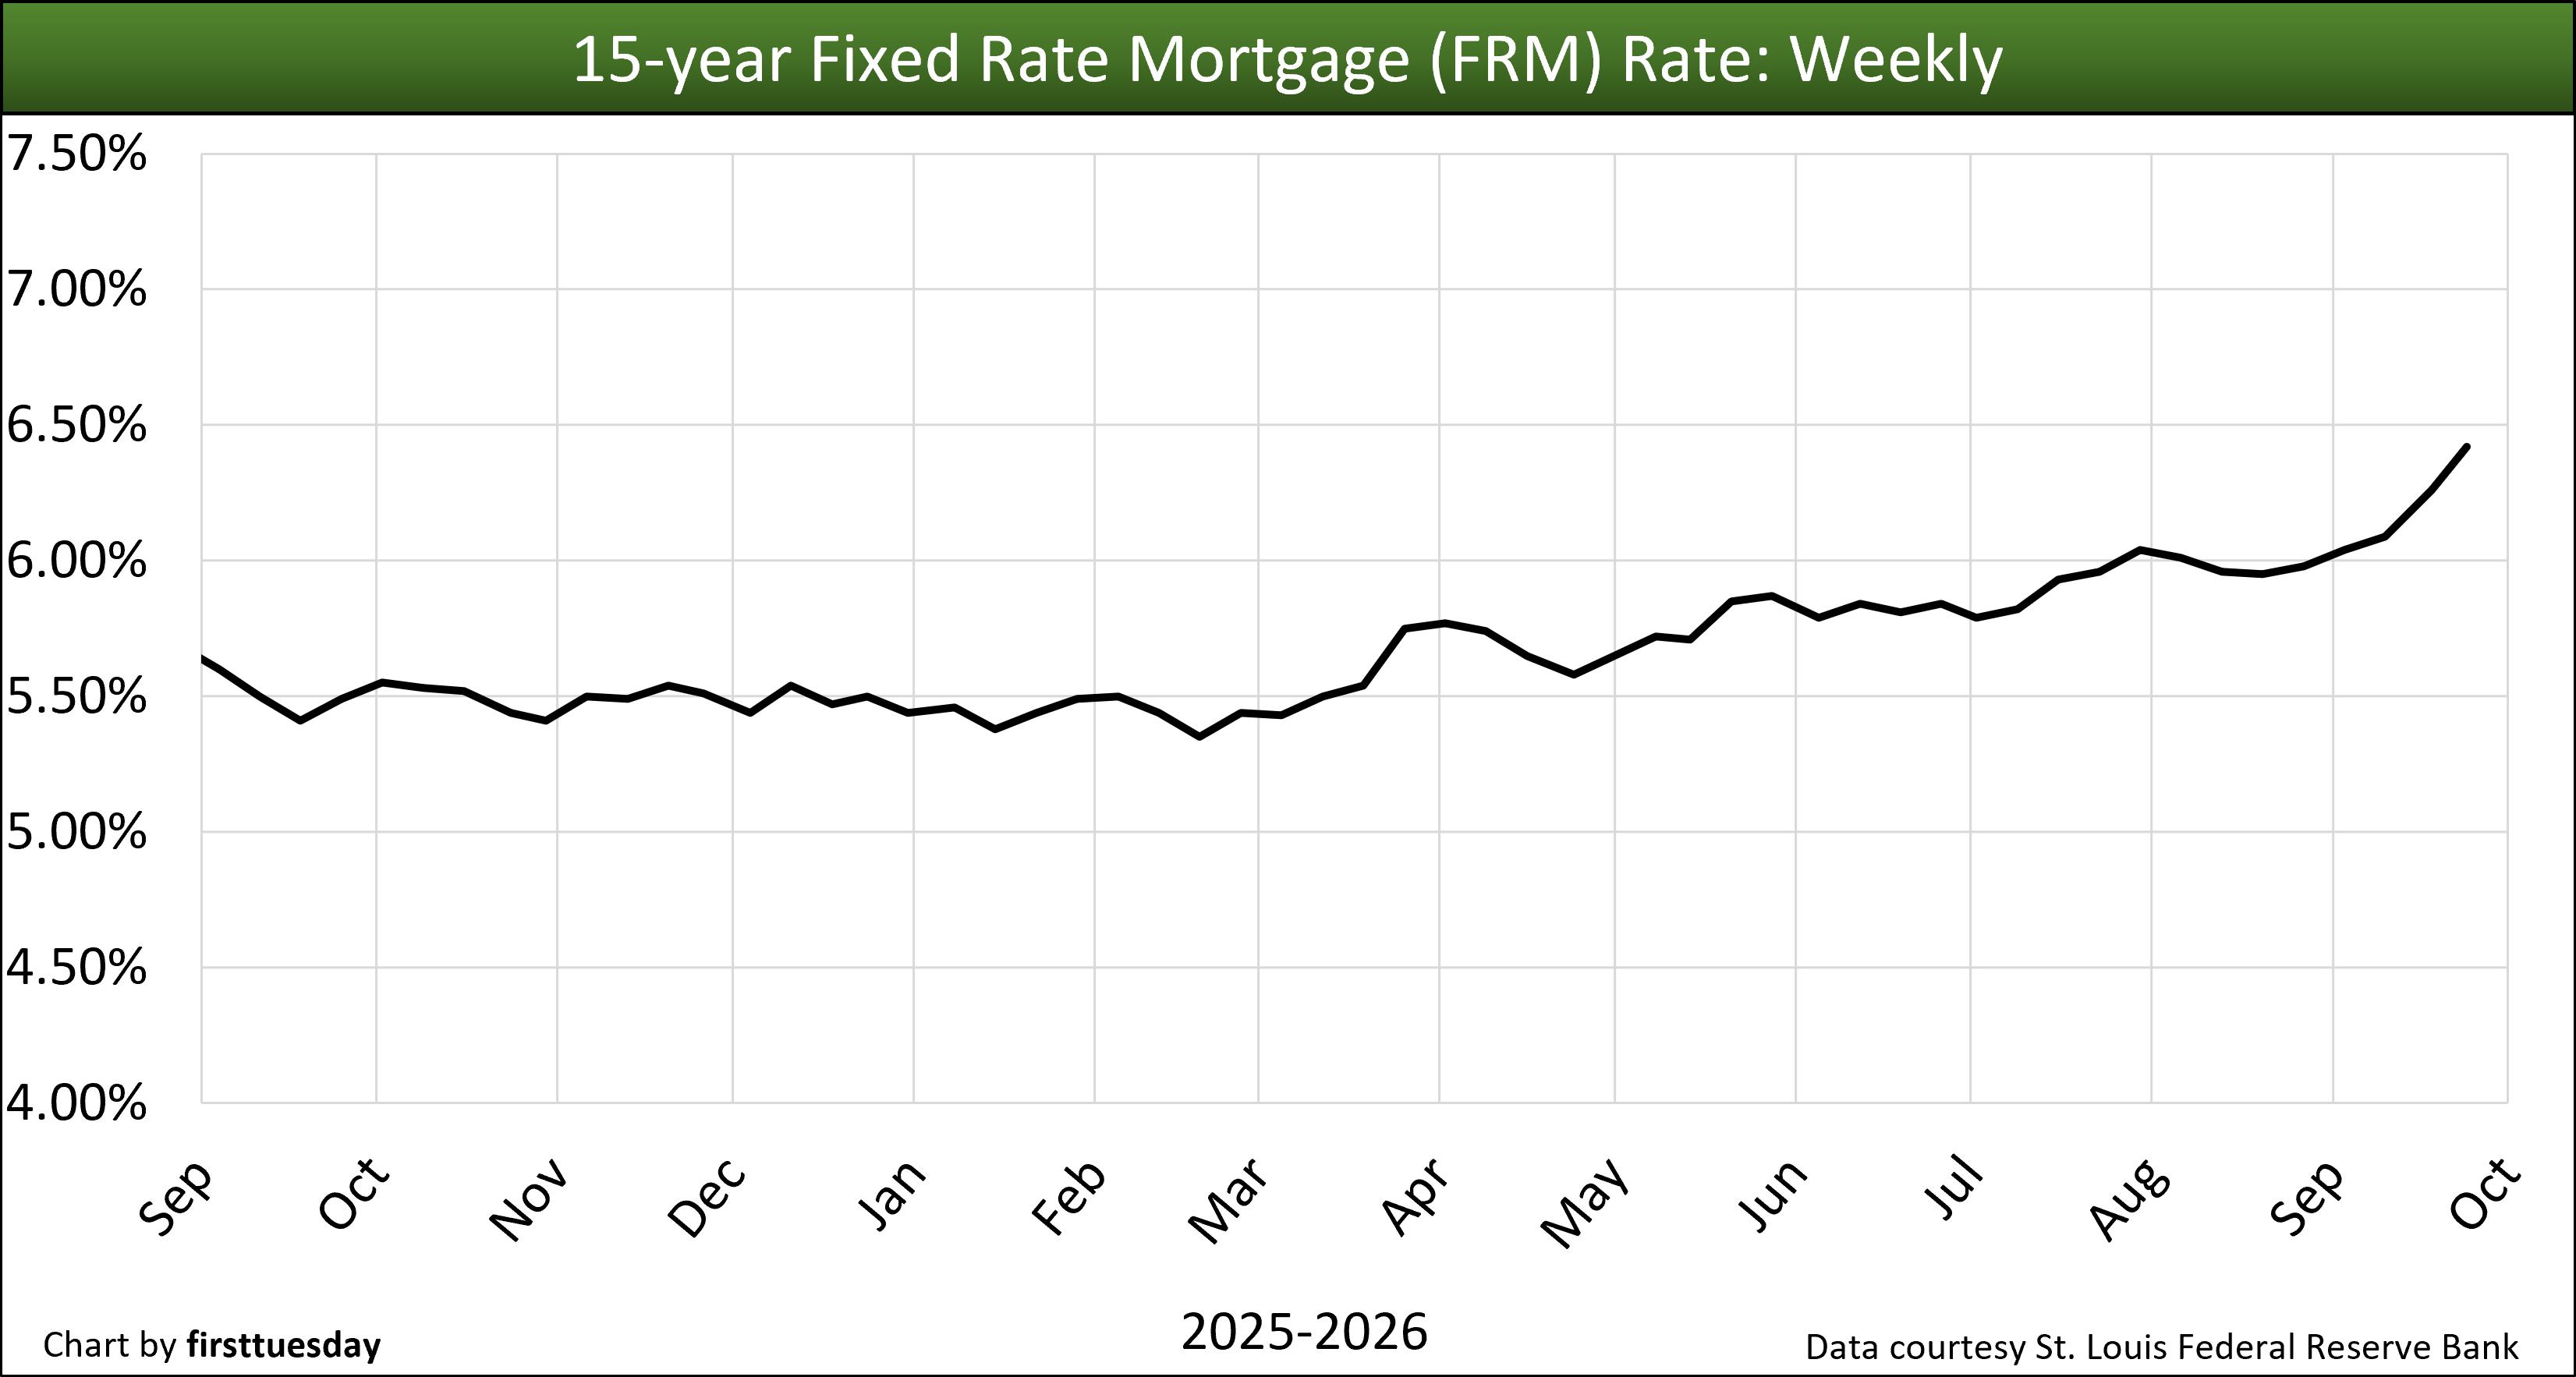
The rate on an average 30-year fixed rate mortgage (FRM) climbed to 7.03% in the week ending September 25, 2026, remaining above rates one year ago. The average 15-year FRM erupted to 6.42%.
For those able to switch, the lower 15-year FRM delivers a huge increase in household wealth due to the significant decrease in the amount of interest paid over the life of a 15-year mortgage. While one-twelfth less expensive, the 15-year FRM larger amortization payments pay off the principal more quickly.
Originating a 15-year FRM, say $500,000, rather than a 30-year FRM, saves around 60% on the total interest paid on a 30-year FRM. This means a 30-year FRM costs more than double the amount of interest paid on a 15-year FRM. This avoids the expense of continued payments after 15 years, which drastically reduces the homeowner’s standard of living.
For 2026, you, in a guessing game, may well see FRM rates work their way higher then lower, or, lower then higher. The bond market bet is the Fed will put up a verbal fight to cut the current severe 3.5% to 4% average rate of consumer inflation, a repeat of the Nixon/Burns Fed inflation chaos of 1971.
Further, the tariff wars since early 2025 and military wars in 2026 destabilized job growth and increased consumer inflation which will not end quickly.
And, meanwhile, the effects of government interference with trade and migratory labor remain from the covid pandemic and current administration. This environment drives the hoarding of precious metals or cash positions and retention of real estate interests without turnover or acquisition (which are certain to return).
Income producing assets (read: real estate, bonds, etc.) decline in value while wages for the employed increase to match consumer inflation and have exceeded it since 2014.
However, it is the dramatic increase in long-term rates for mortgages, which remain steadfastly high, that has brought mortgage-funded real estate transactions to a serious slowdown until — the disruptions and distortions recede.
Regardless of FRM rate movement in the continuing real estate recessionary period now ongoing in 2026, expect a long-term upward trend in mortgage rates to follow — though they will drop for the duration of a recession. The FRM upward rate trend commenced in 2013 as the half-cycle of rising long-term rates for borrowing set in — likely to run for most of the next two decades.
That said, current federal government interference adversely affects homebuyer willingness, user turnover rate, and costs of residential construction. Thus, a rigor mortis environment for real estate has settled in with buyers, sellers and lenders.
Further, an increase in federal borrowing is needed to offset the insatiable government demand for cash, unless those who pay income taxes pay more. The result: expect long-term interest rates to remain high, and in sympathy, mortgage rates.
Two other situations on the horizon may cause mortgage rates to stay high and tend to rise:
- privatizing quasi-government mortgage agencies, like Freddie Mac, enhances mortgage lender profit-sharing as reduced oversight always provides greater short-term profits for lenders; and in tandem
- inevitable mortgage lender losses which are socialized by government disbursement on mortgage guarantees and are not borne by the lenders.
Remember the rule: All financial deregulation goes up in flames. Our last reminder was 2005 which did not go well, but we forget.
Buyers increasingly stay away, until when?
Today’s high FRM rates and buyer caution undermines home prices. For investors, capitalization rates for evaluating income properties rise in sympathy with long-term interest rates causing all income property values to decline. Of course, the higher cost of money is borne by sellers of real estate as a loss of wealth.
For all but cash buyers, the price of property is primarily supported by the amount a buyer can borrow to fund a purchase. Higher and higher mortgage rates translate into reduced ability to pay yesterday’s asking prices.
As inventories of for-sale and for-lease property rise, consistent increases in FRM rates force sellers to eventually drop asking prices or exit the for-sale market.
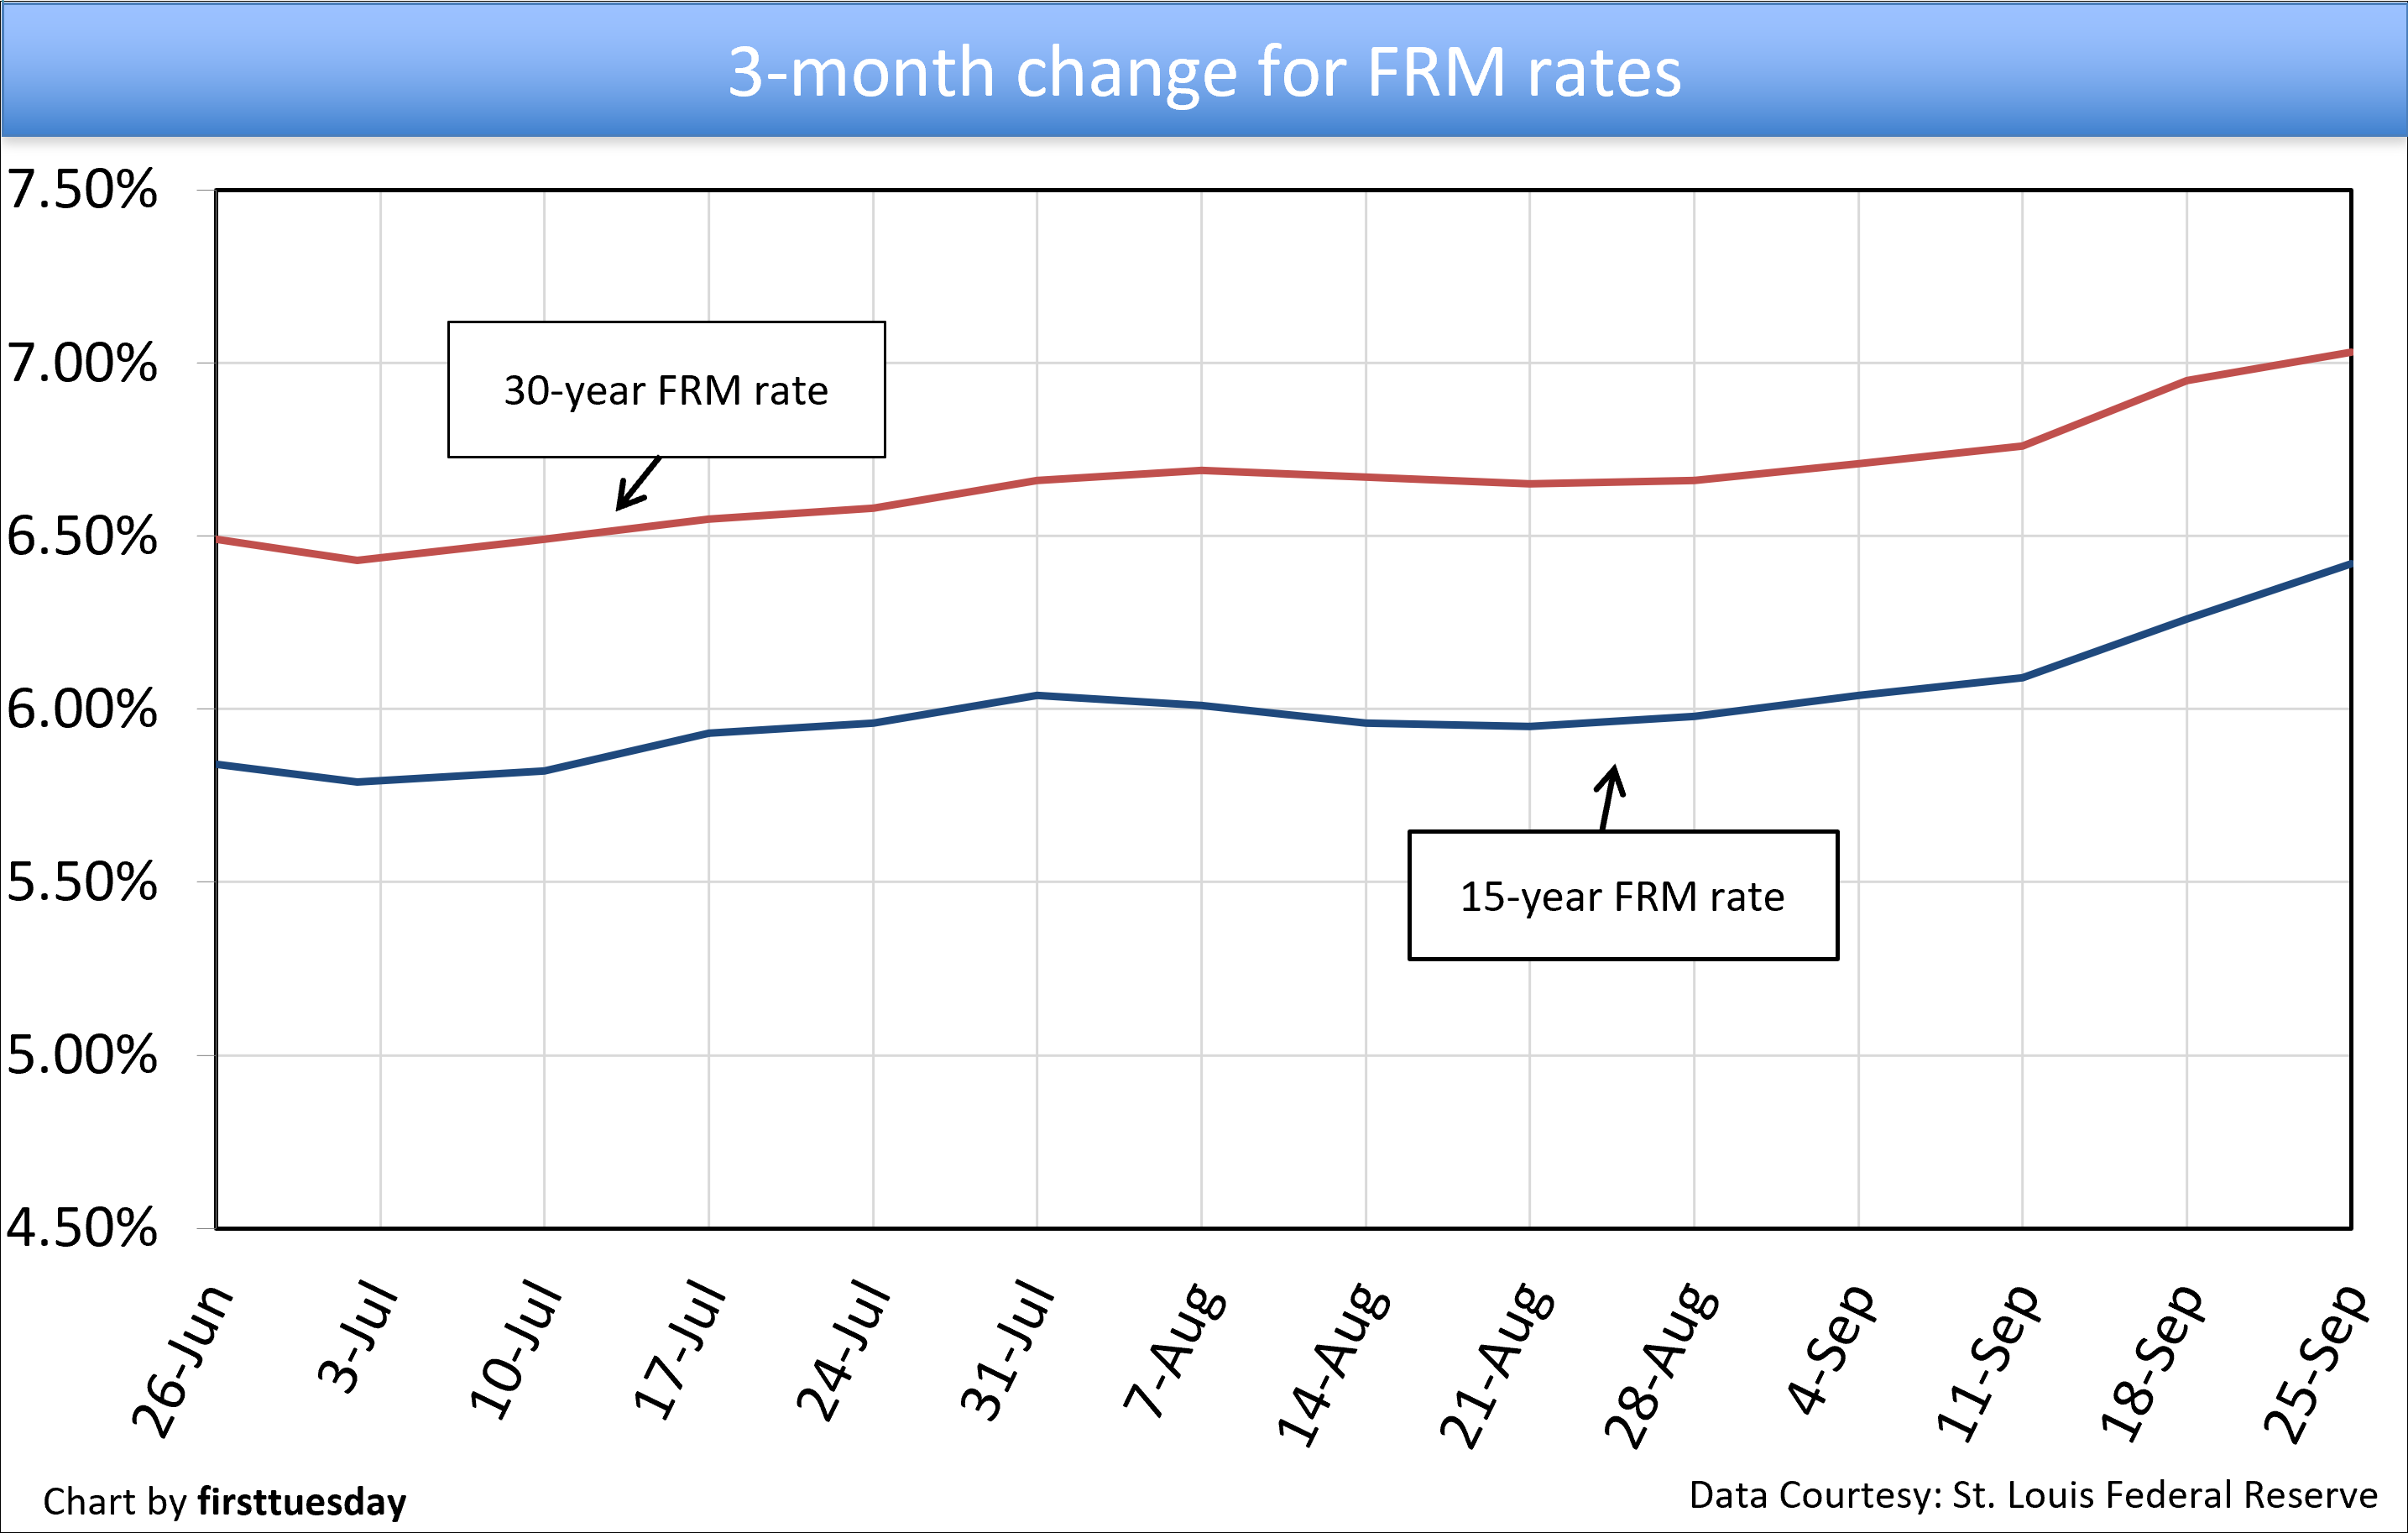
Fundamentally, FRM rates are tied to the 10-year Treasury note market, as are capitalization (cap) rates for setting income property prices. The 30-year FRM rate moves in tandem with the 10-year Treasury note rate, to which MLOs add a risk premium of between 1.5% and 3.0% based on a perceived risk of loss on mortgage defaults.
Historically, the risk premium spread between the 10-year T-Note rate and the 30-year FRM rate in normal times is 1.5%. The spread is far greater for cap rates applied by income property investors to set property value.
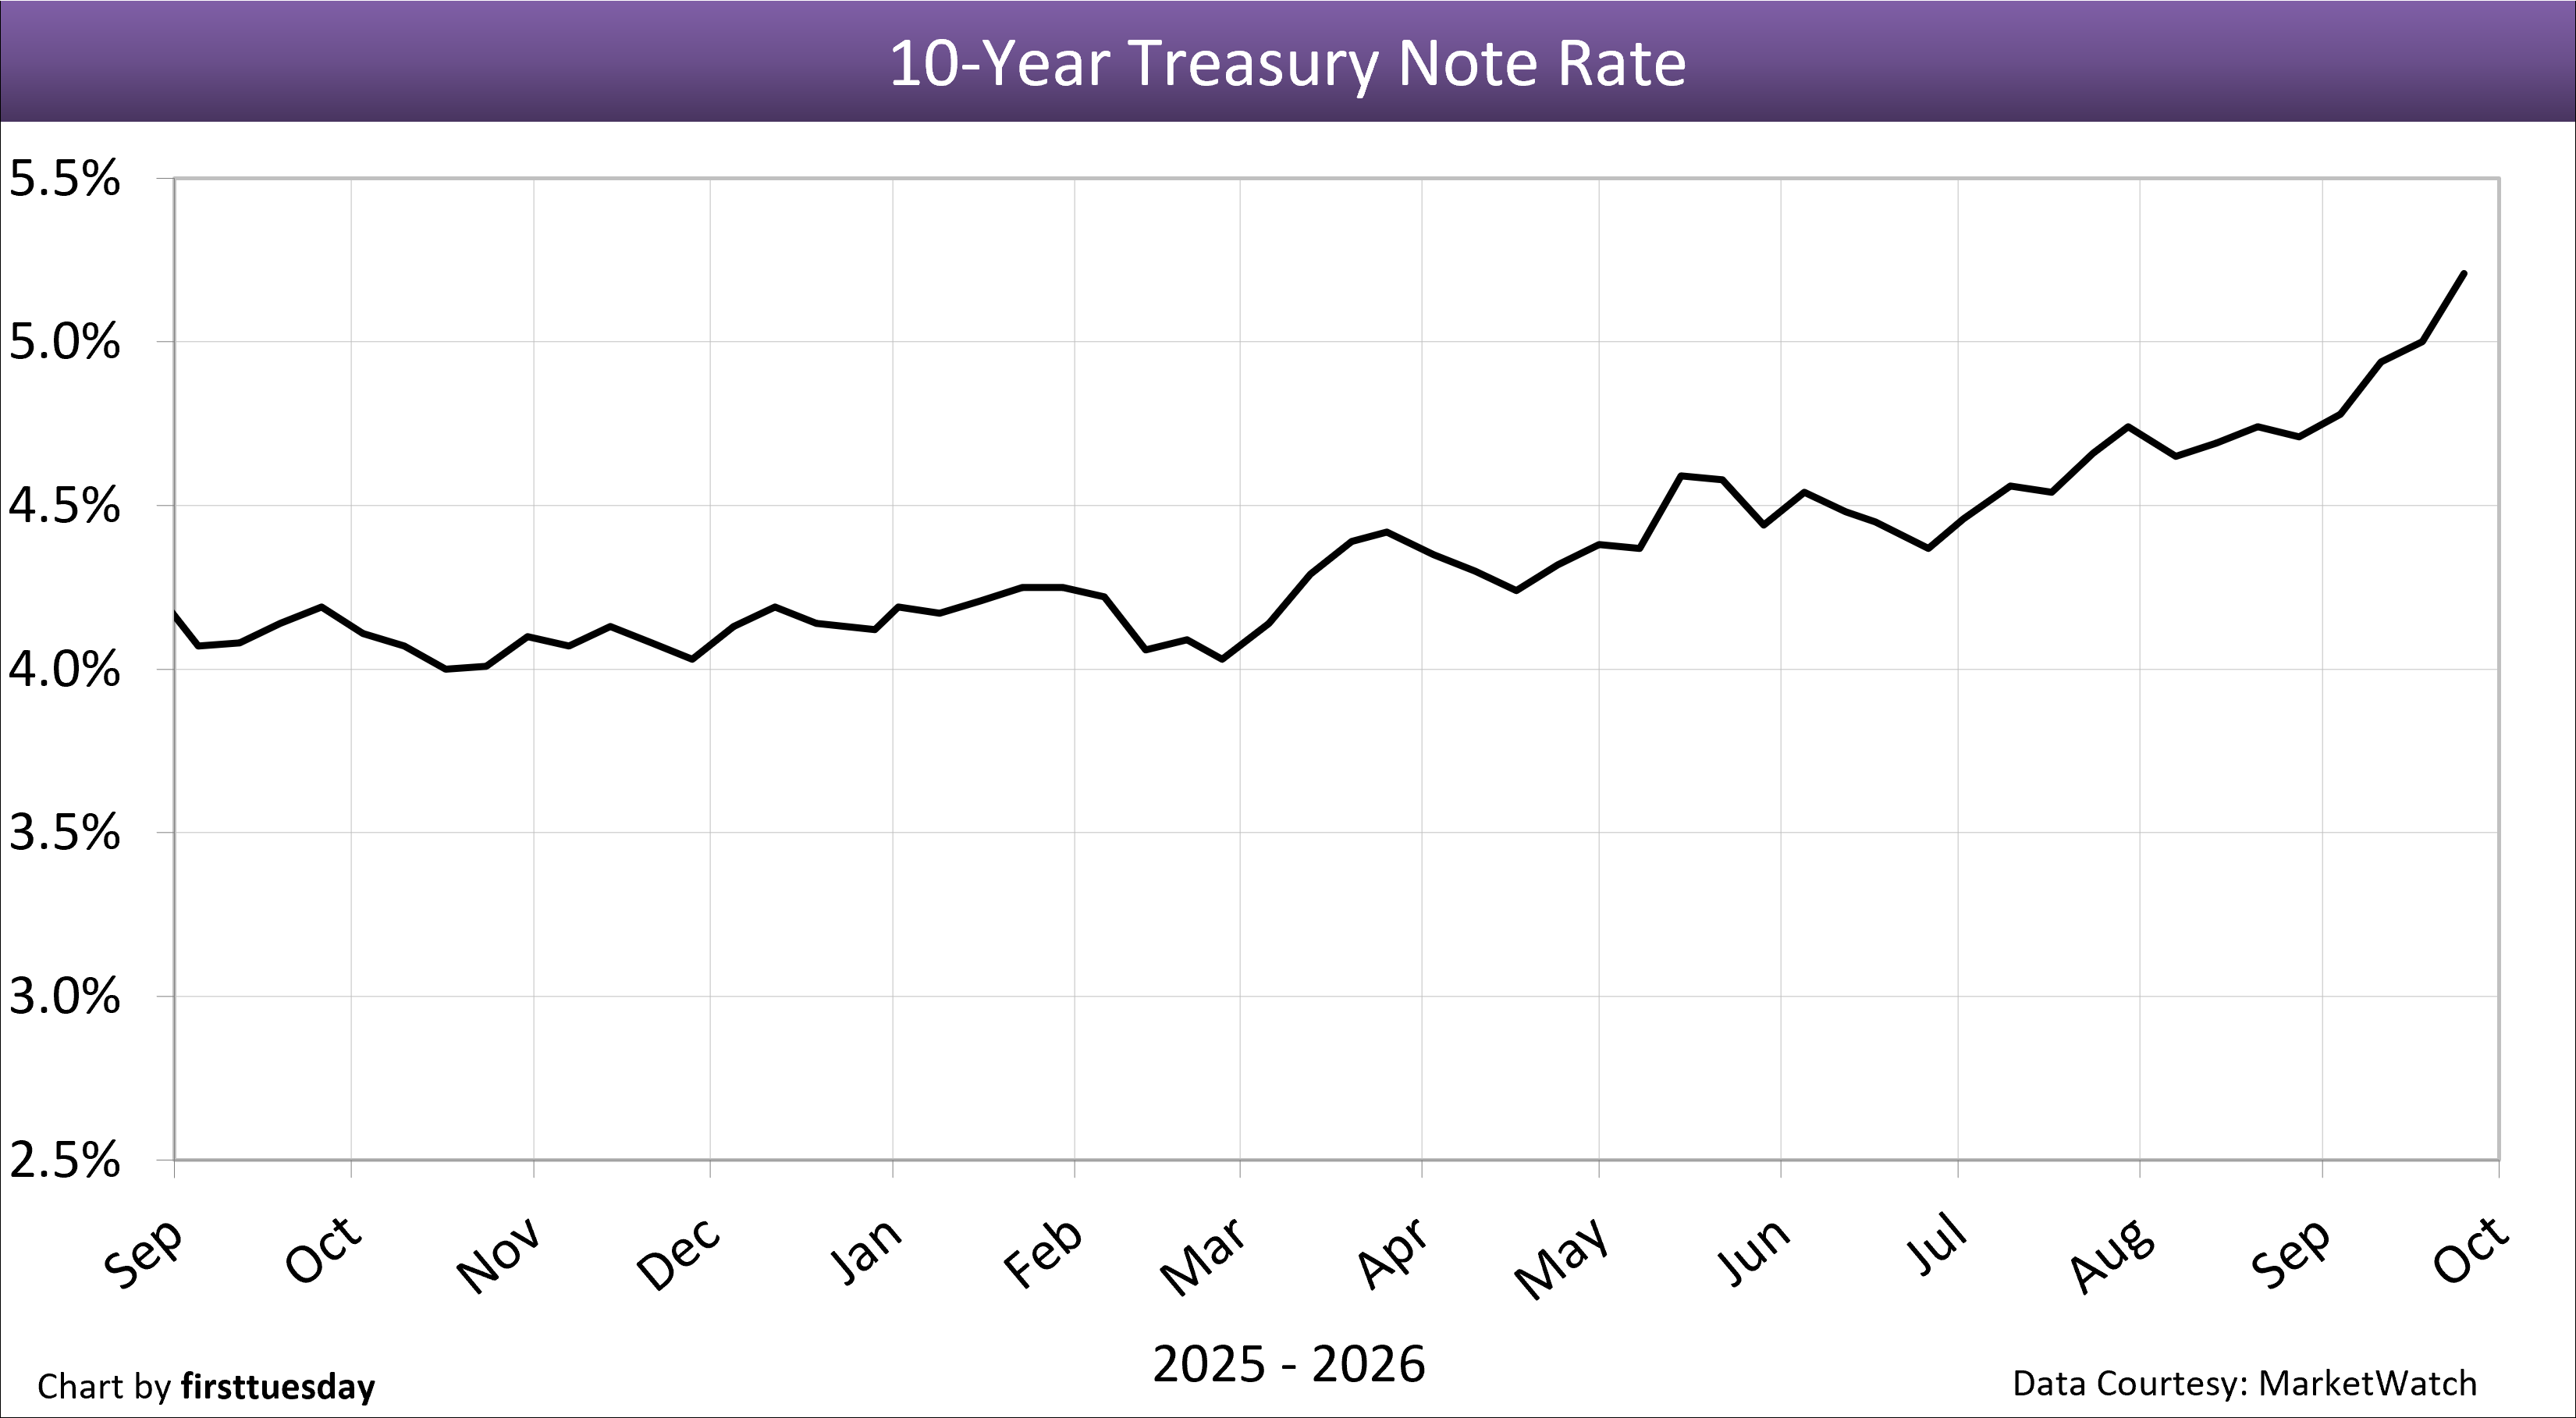
The 10-year T-Note jumped to 5.21% on September 25, 2026. The spread between the 10-year T-Note and 30-year FRM rate is 1.82%, above the historical risk premium spread of 1.5%.
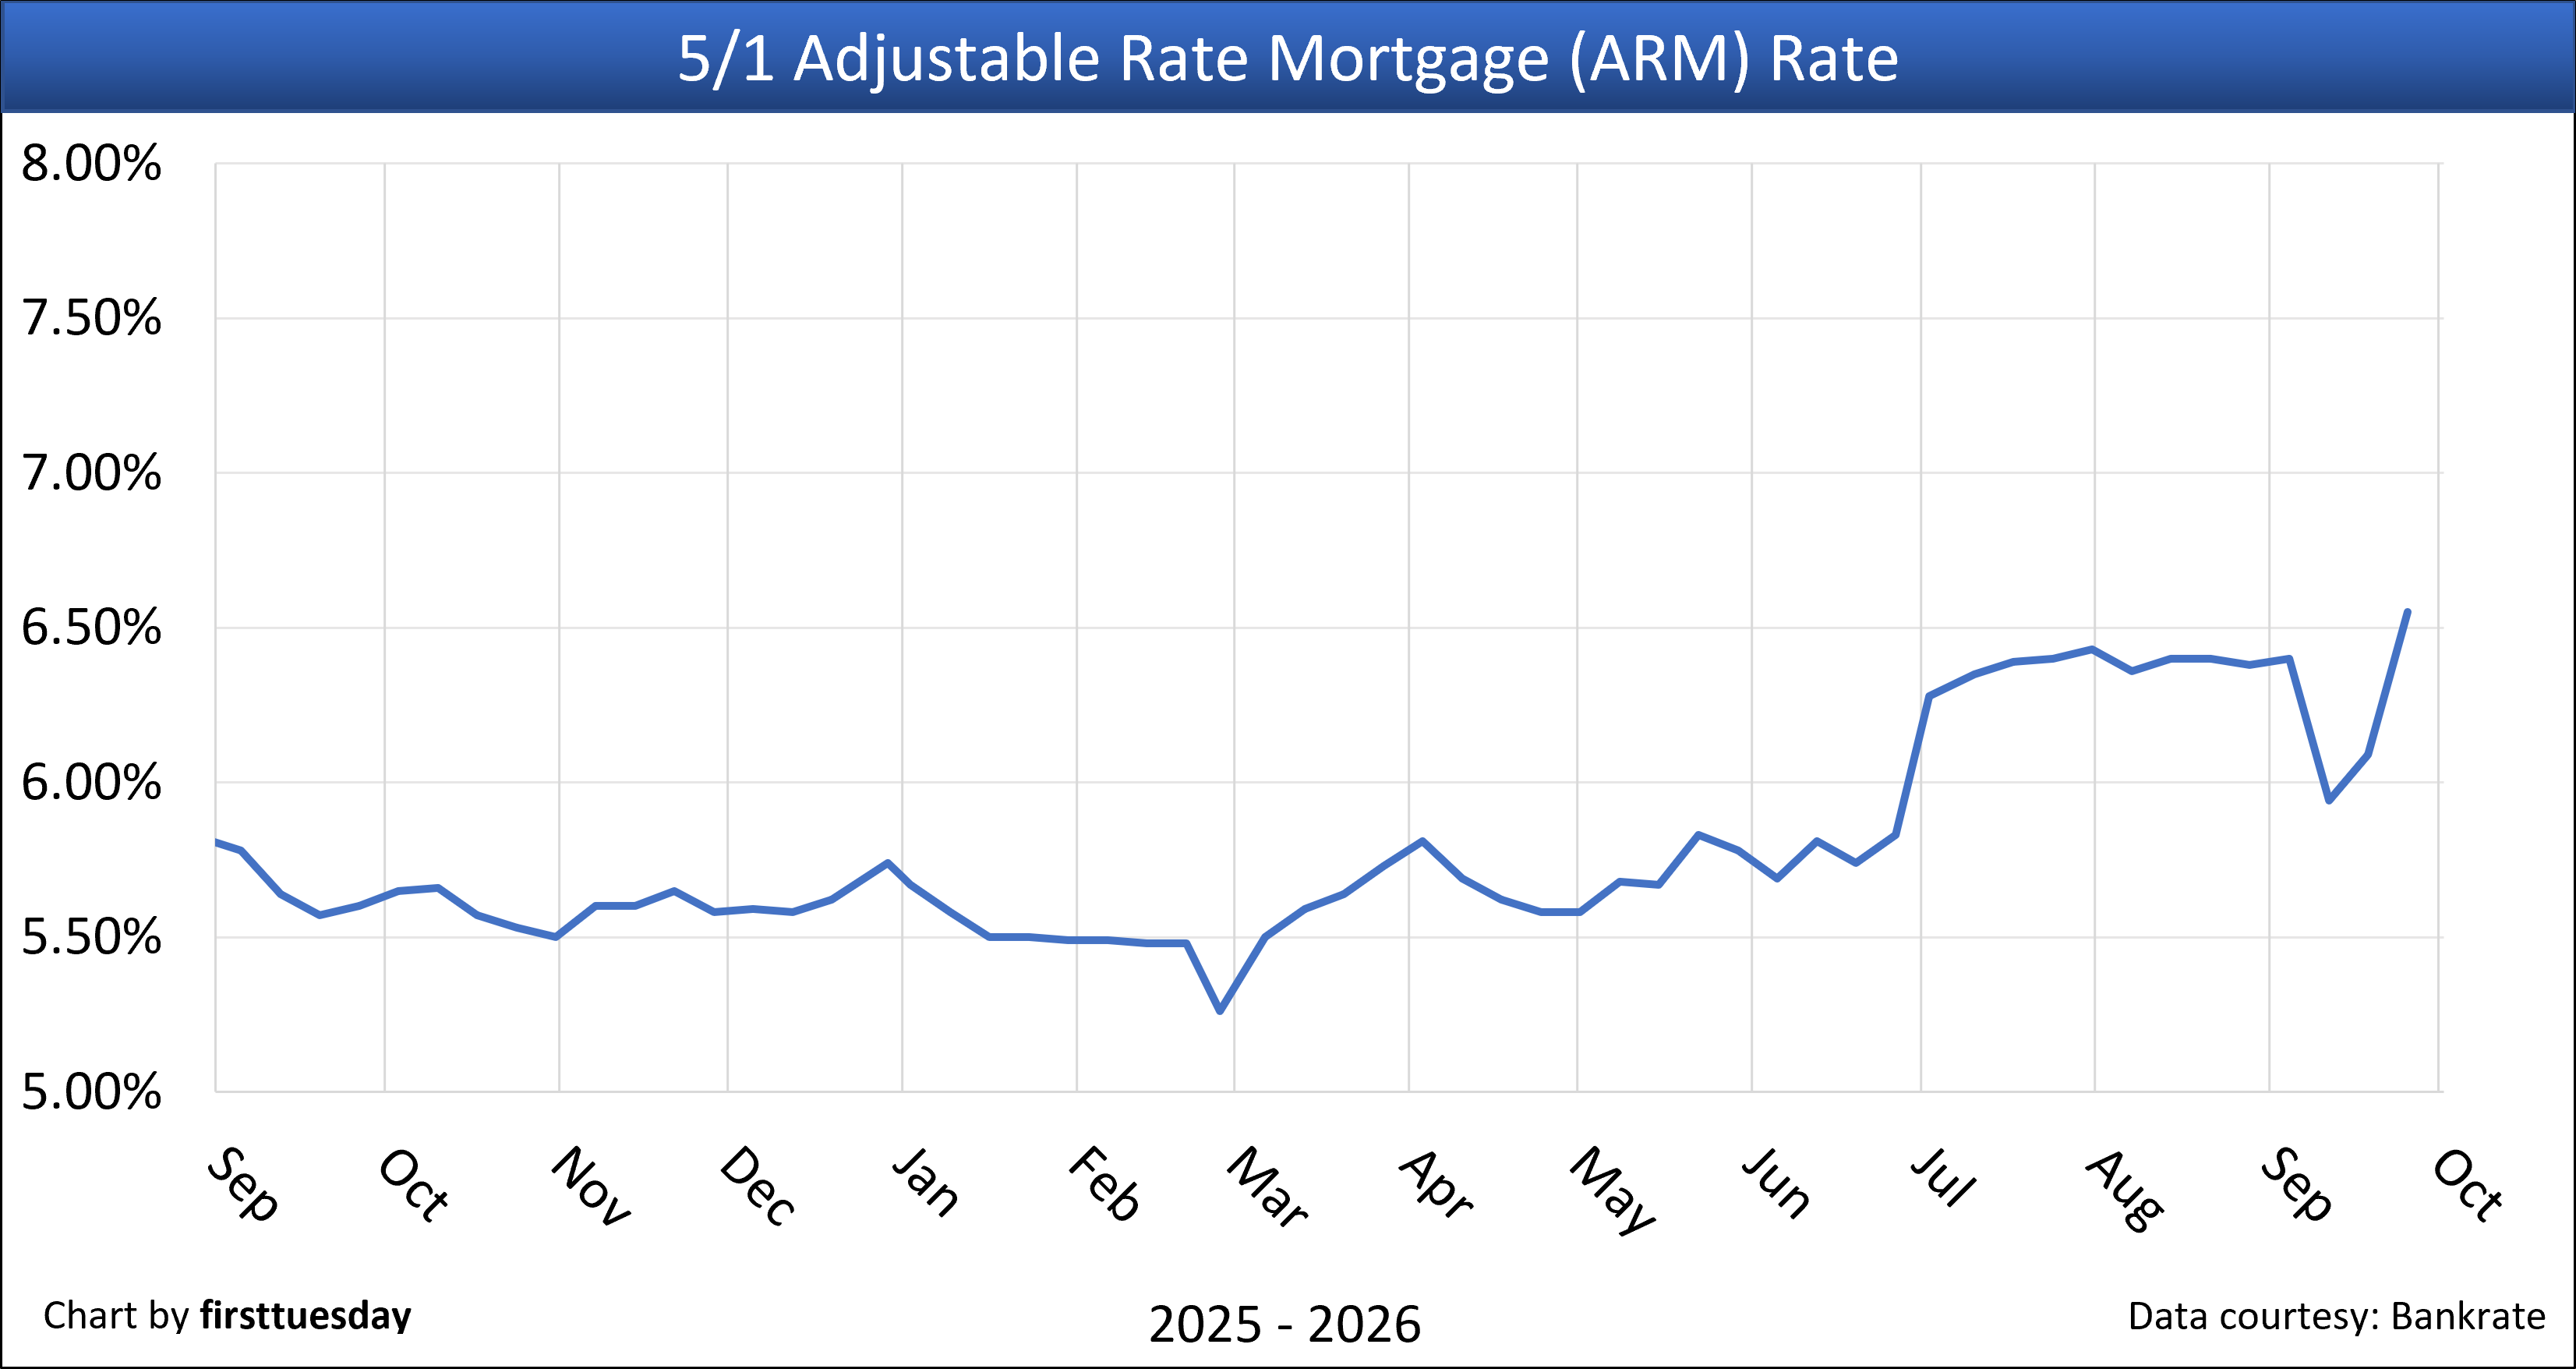
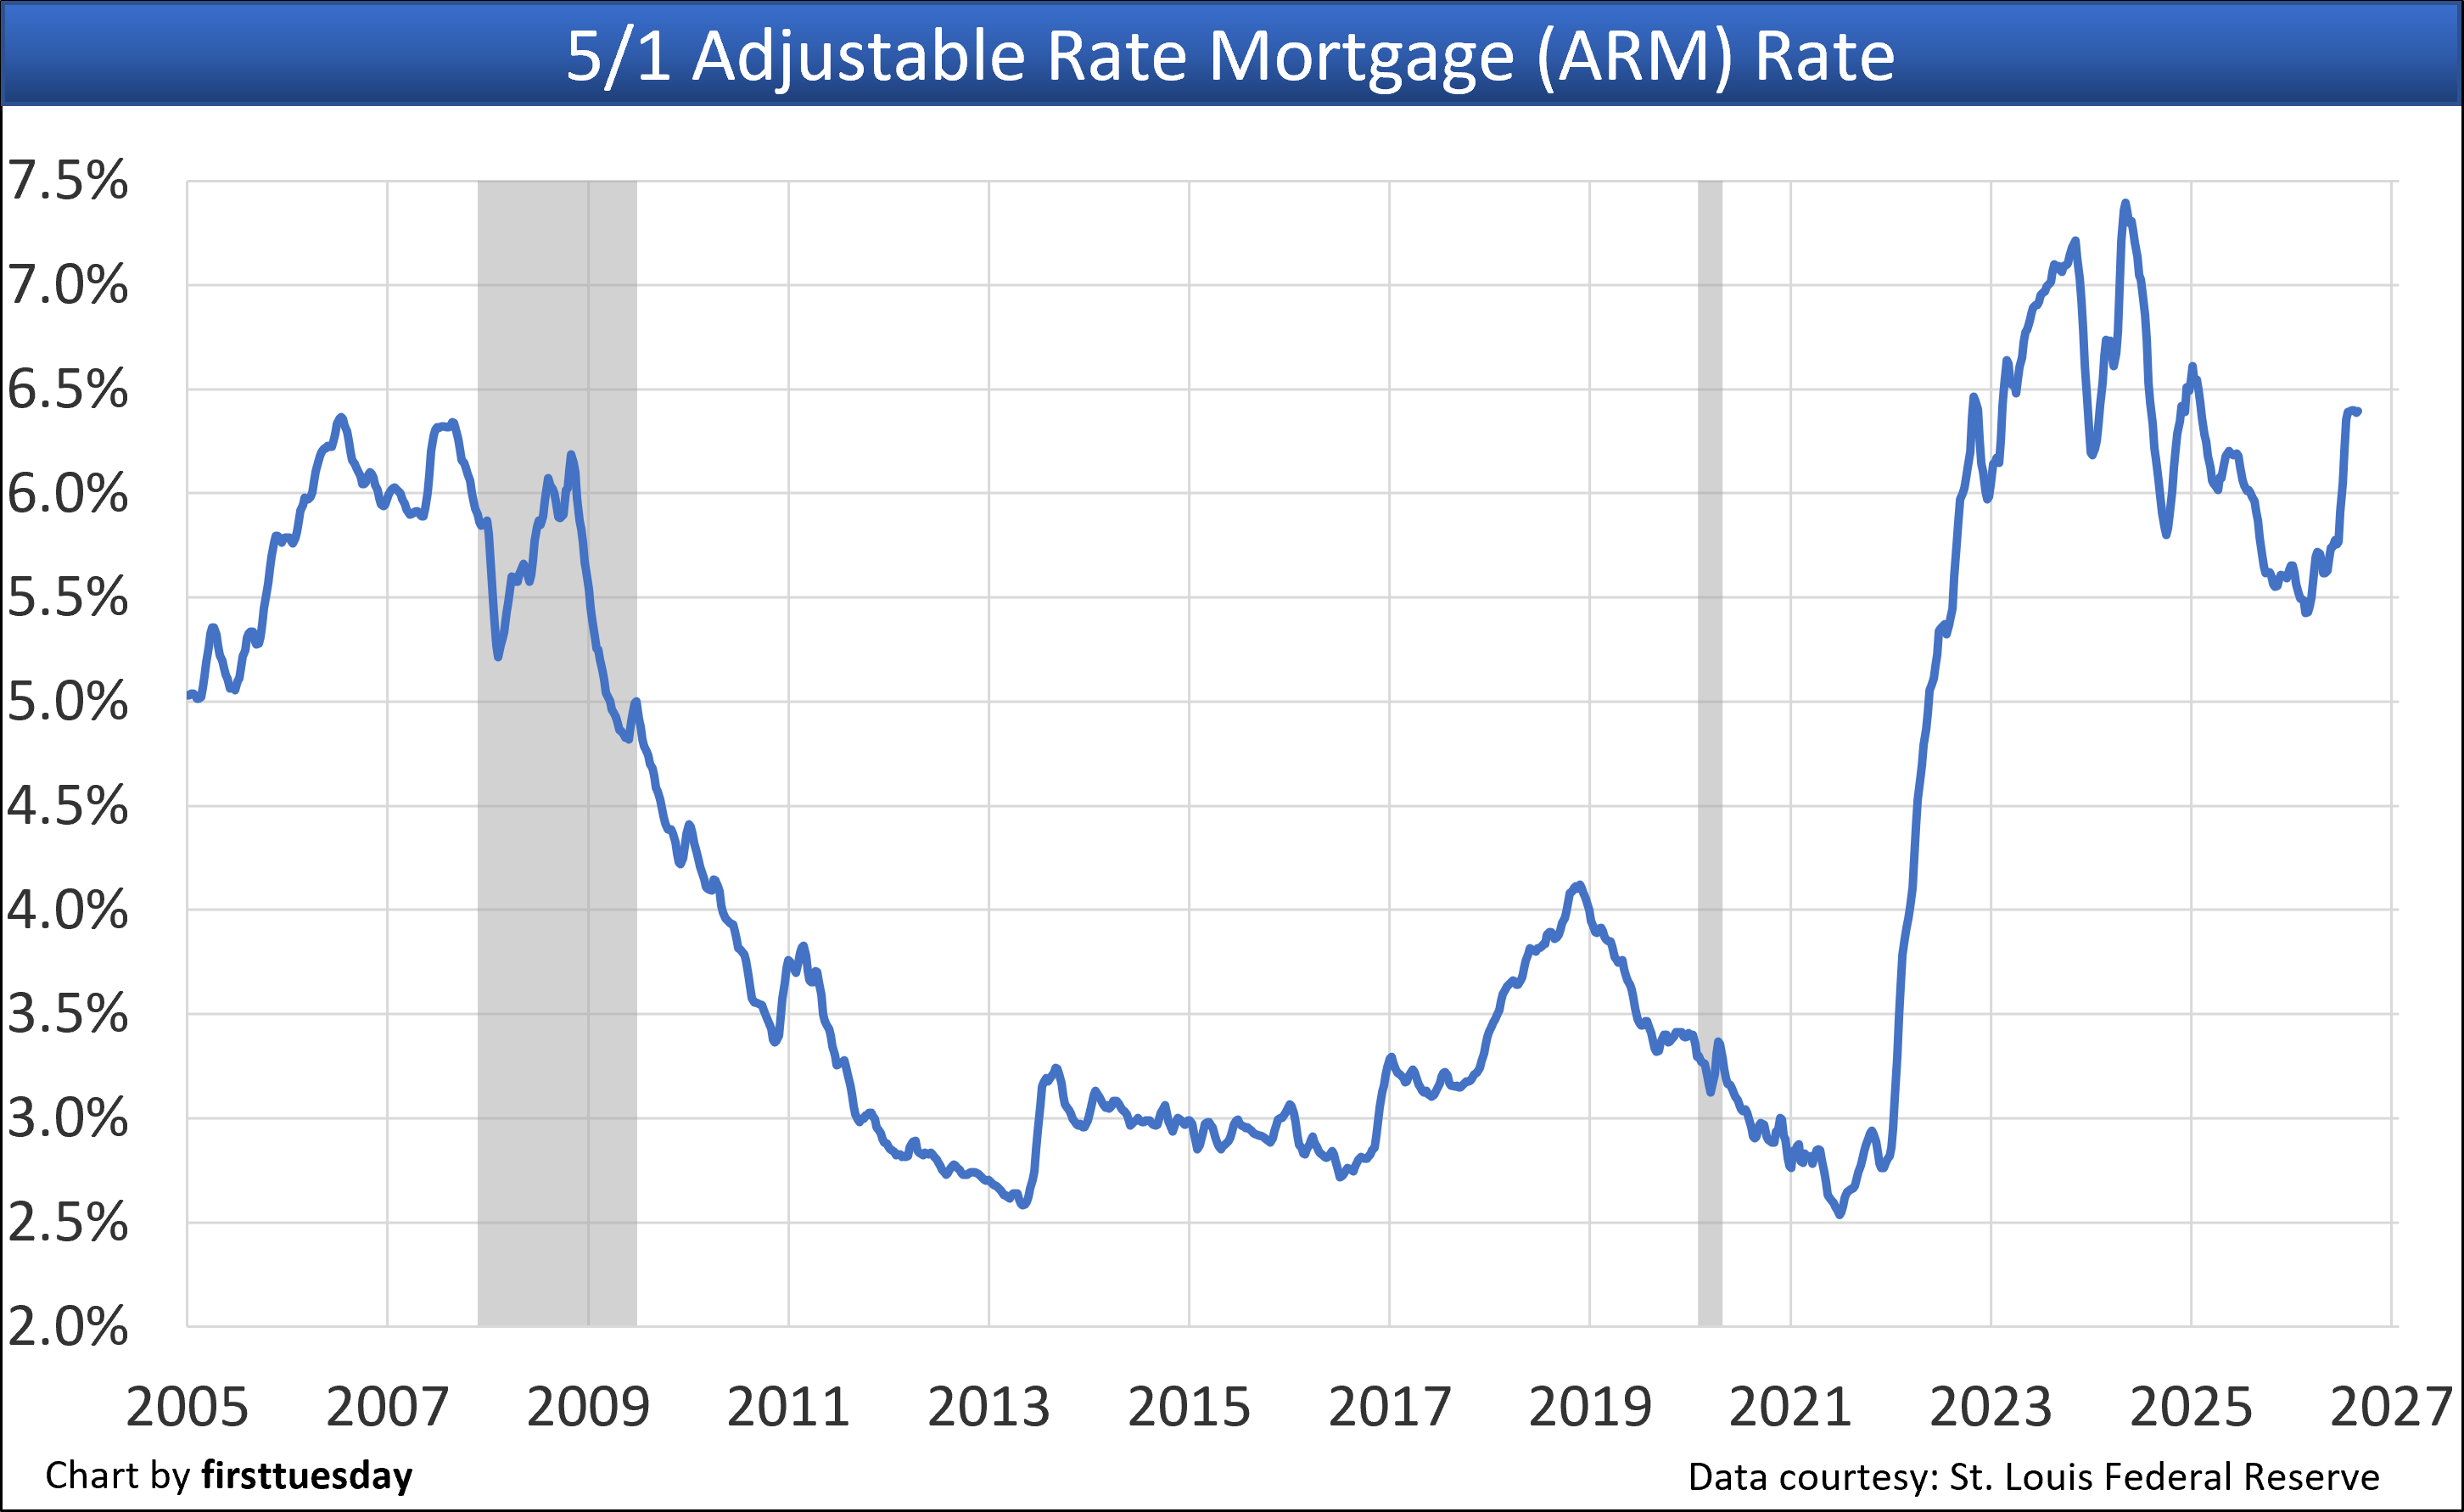
The average monthly rate on adjustable rate mortgages (ARMs) soared to 6.55% on September 25, 2026.
The interest rate on the ARM is above the 15-year FRM and only 48 basis points lower than the 30-year FRM rate. A positive 30-year ARM-to-FRM spread gives a homebuyer or owner a bump in the amount they can borrow (and thus spend) by taking out an ARM.
The downside in this reach for more funding by taking out a non-conventional (predatory) mortgage is the significant forward risks of loss-by-foreclosure inherent in ARMs when rates trend higher or an employment recession sets in. Unchanged, an ARM is the mortgage available to finance the risk-tolerant cohort of high-tier housing and commercial property buyers and owners.
The following was updated September 25, 2026.
Click the link to go directly to a chart, or browse the charts by scrolling below.
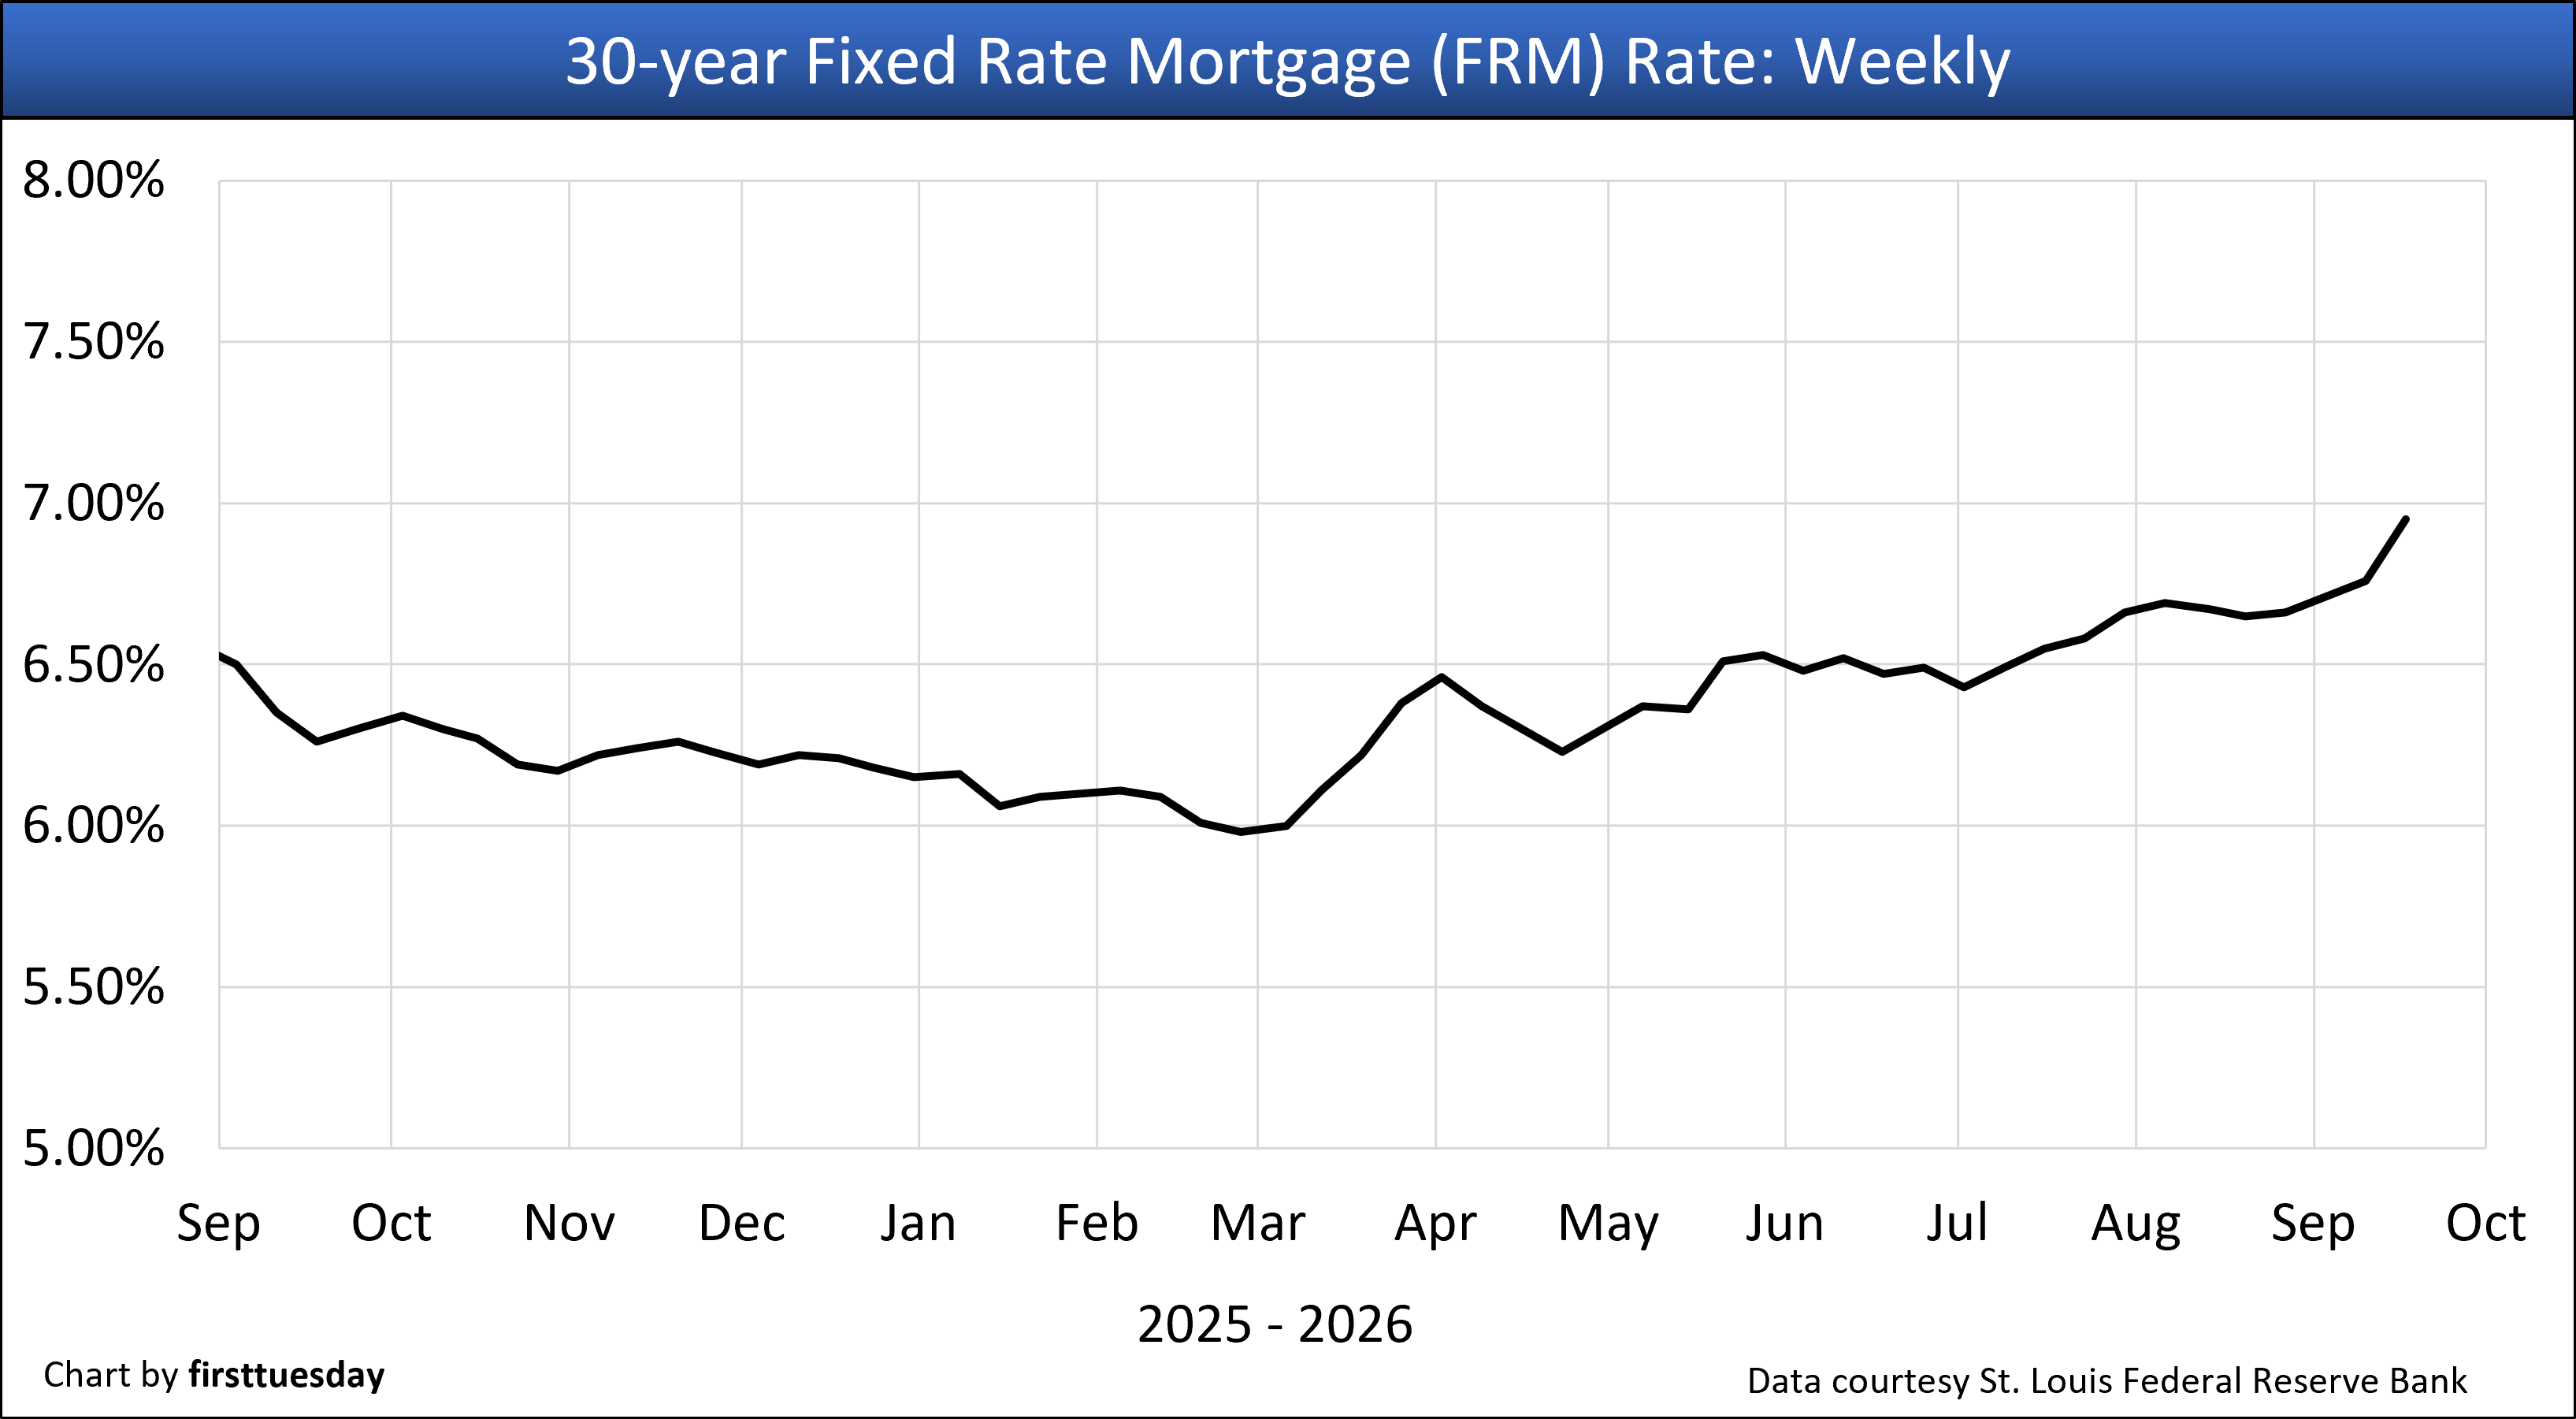
1. 30-year fixed rate mortgage (FRM) rate, weekly— Chart update 9/25/2026
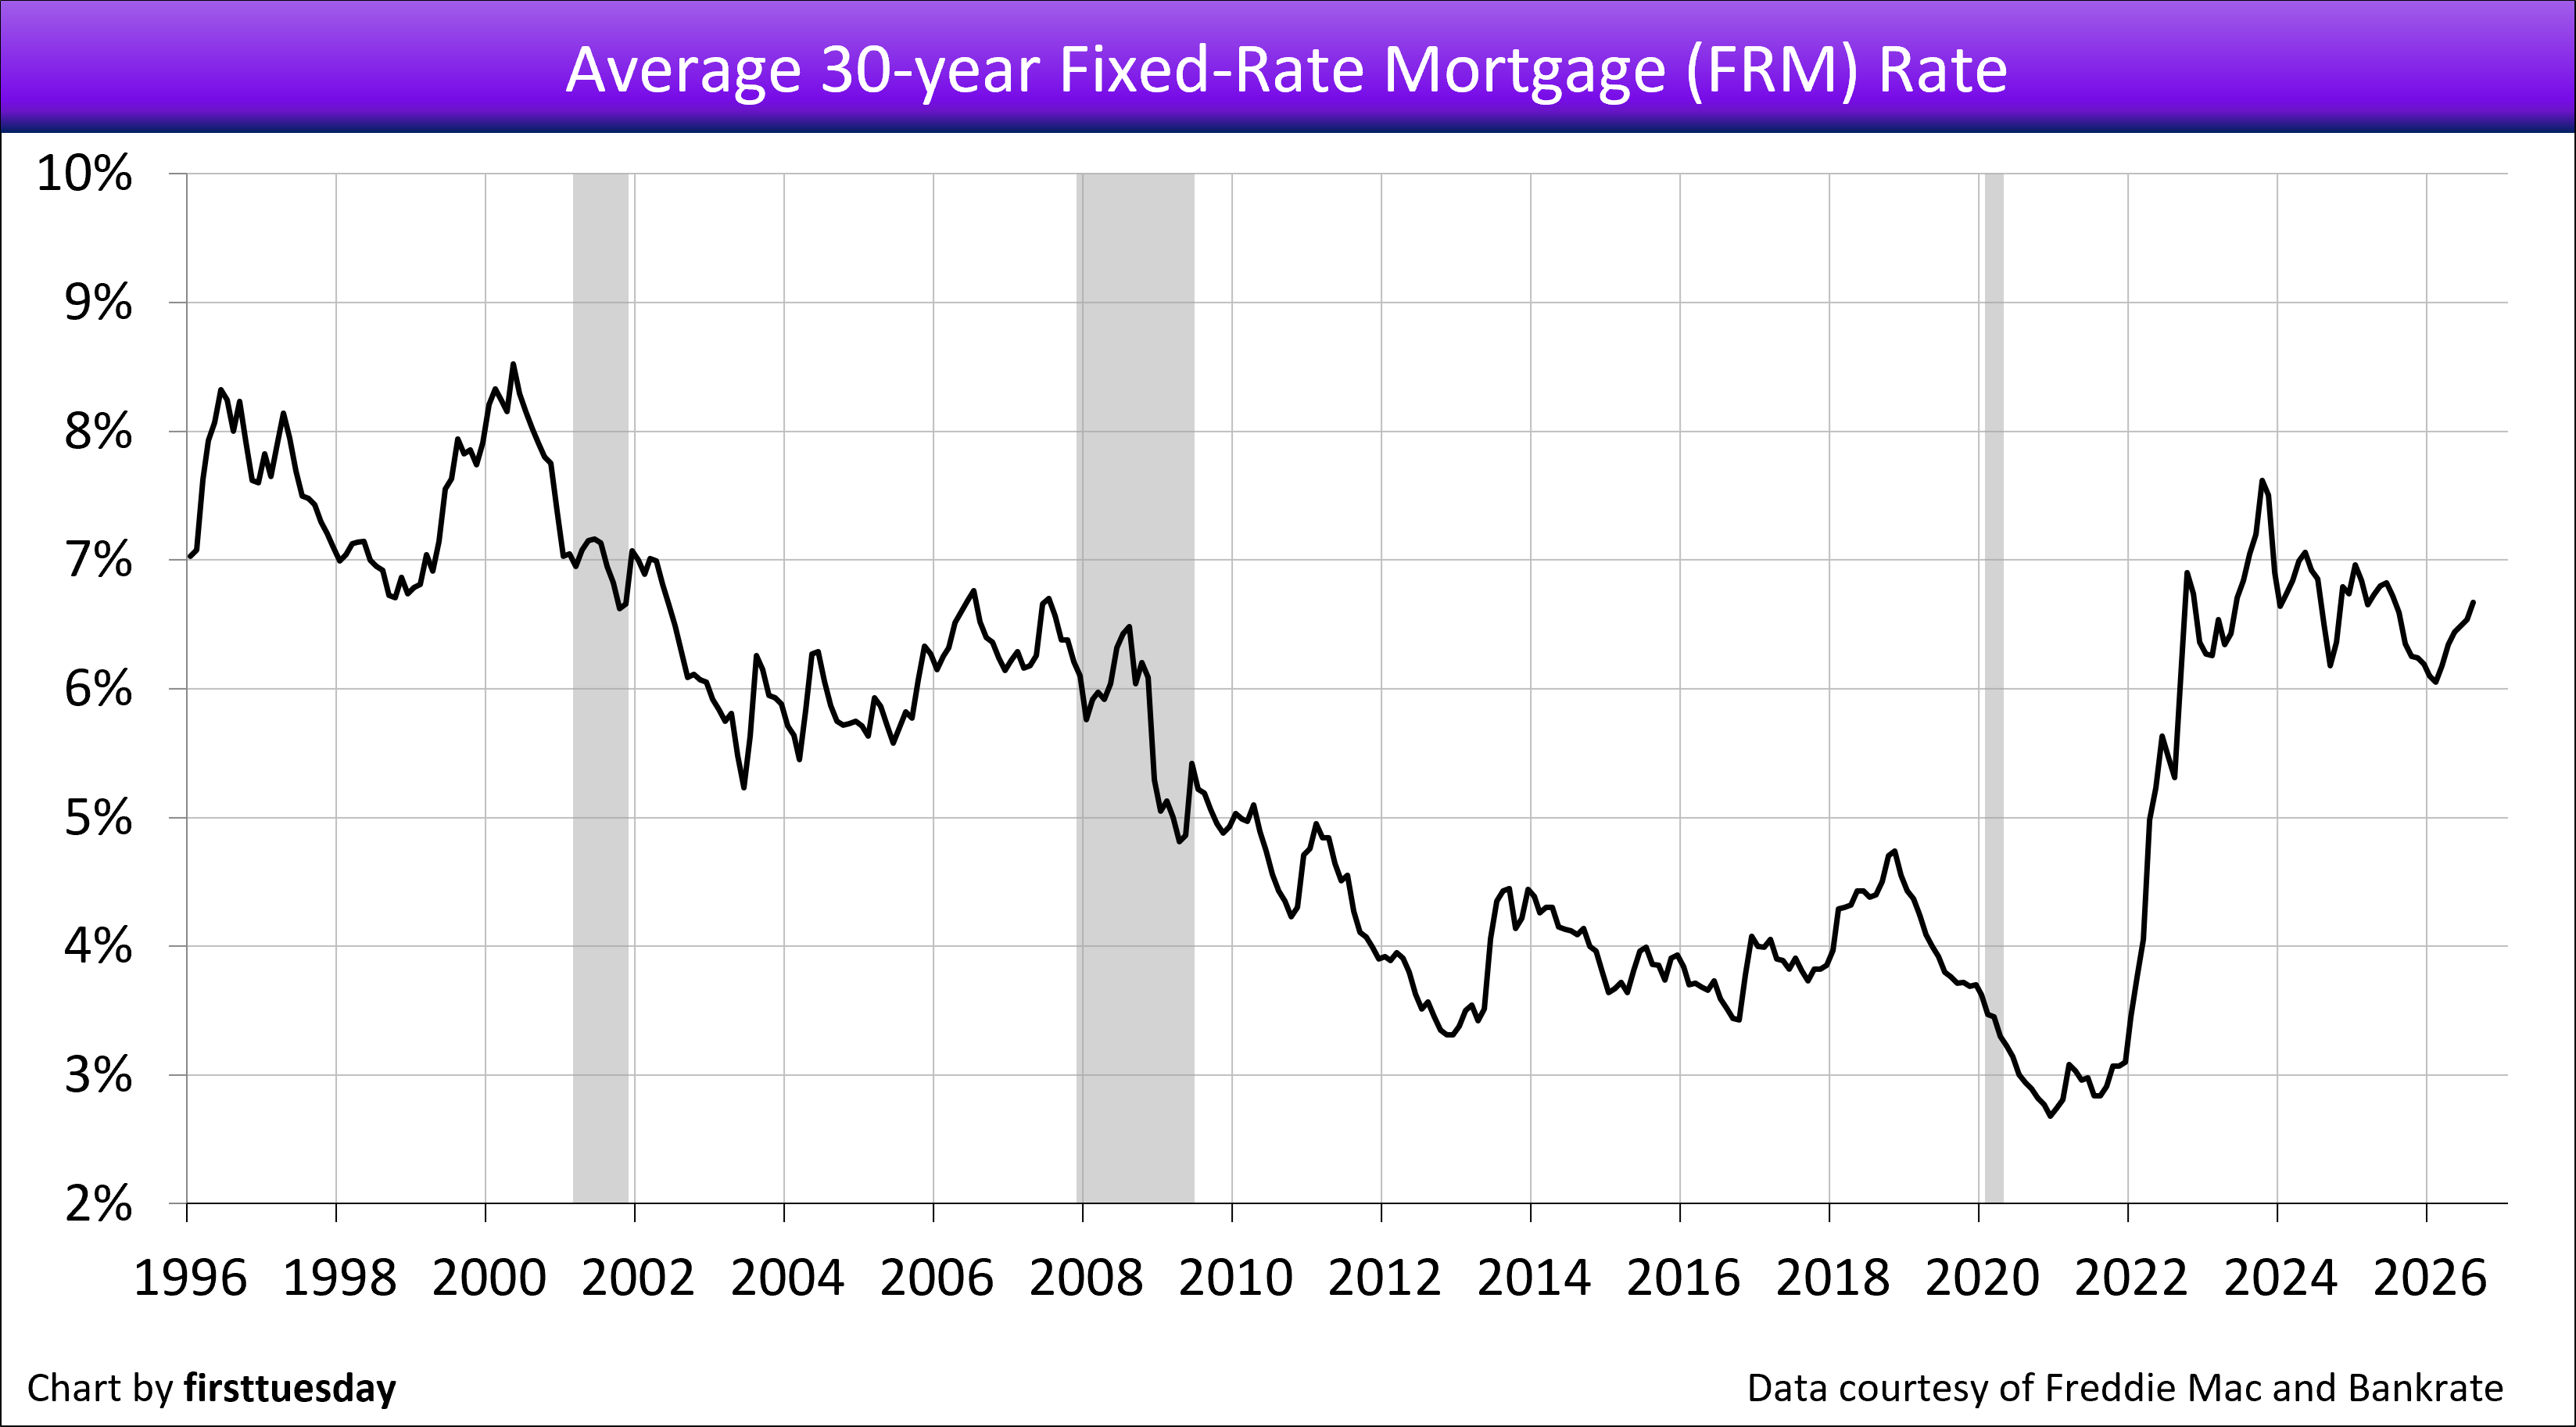
2. 30-year FRM rate, monthly — Chart update 9/4/2026
3. 15-year FRM rate — Chart update 9/25/2026
4. 5/1 adjustable rate mortgage (ARM) rate, monthly — Chart update 9/4/2026
5. 10-year Treasury note rate — Chart update 9/25/2026
6. Combined FRM and 10-year Treasury note rates — Chart update 9/4/2026
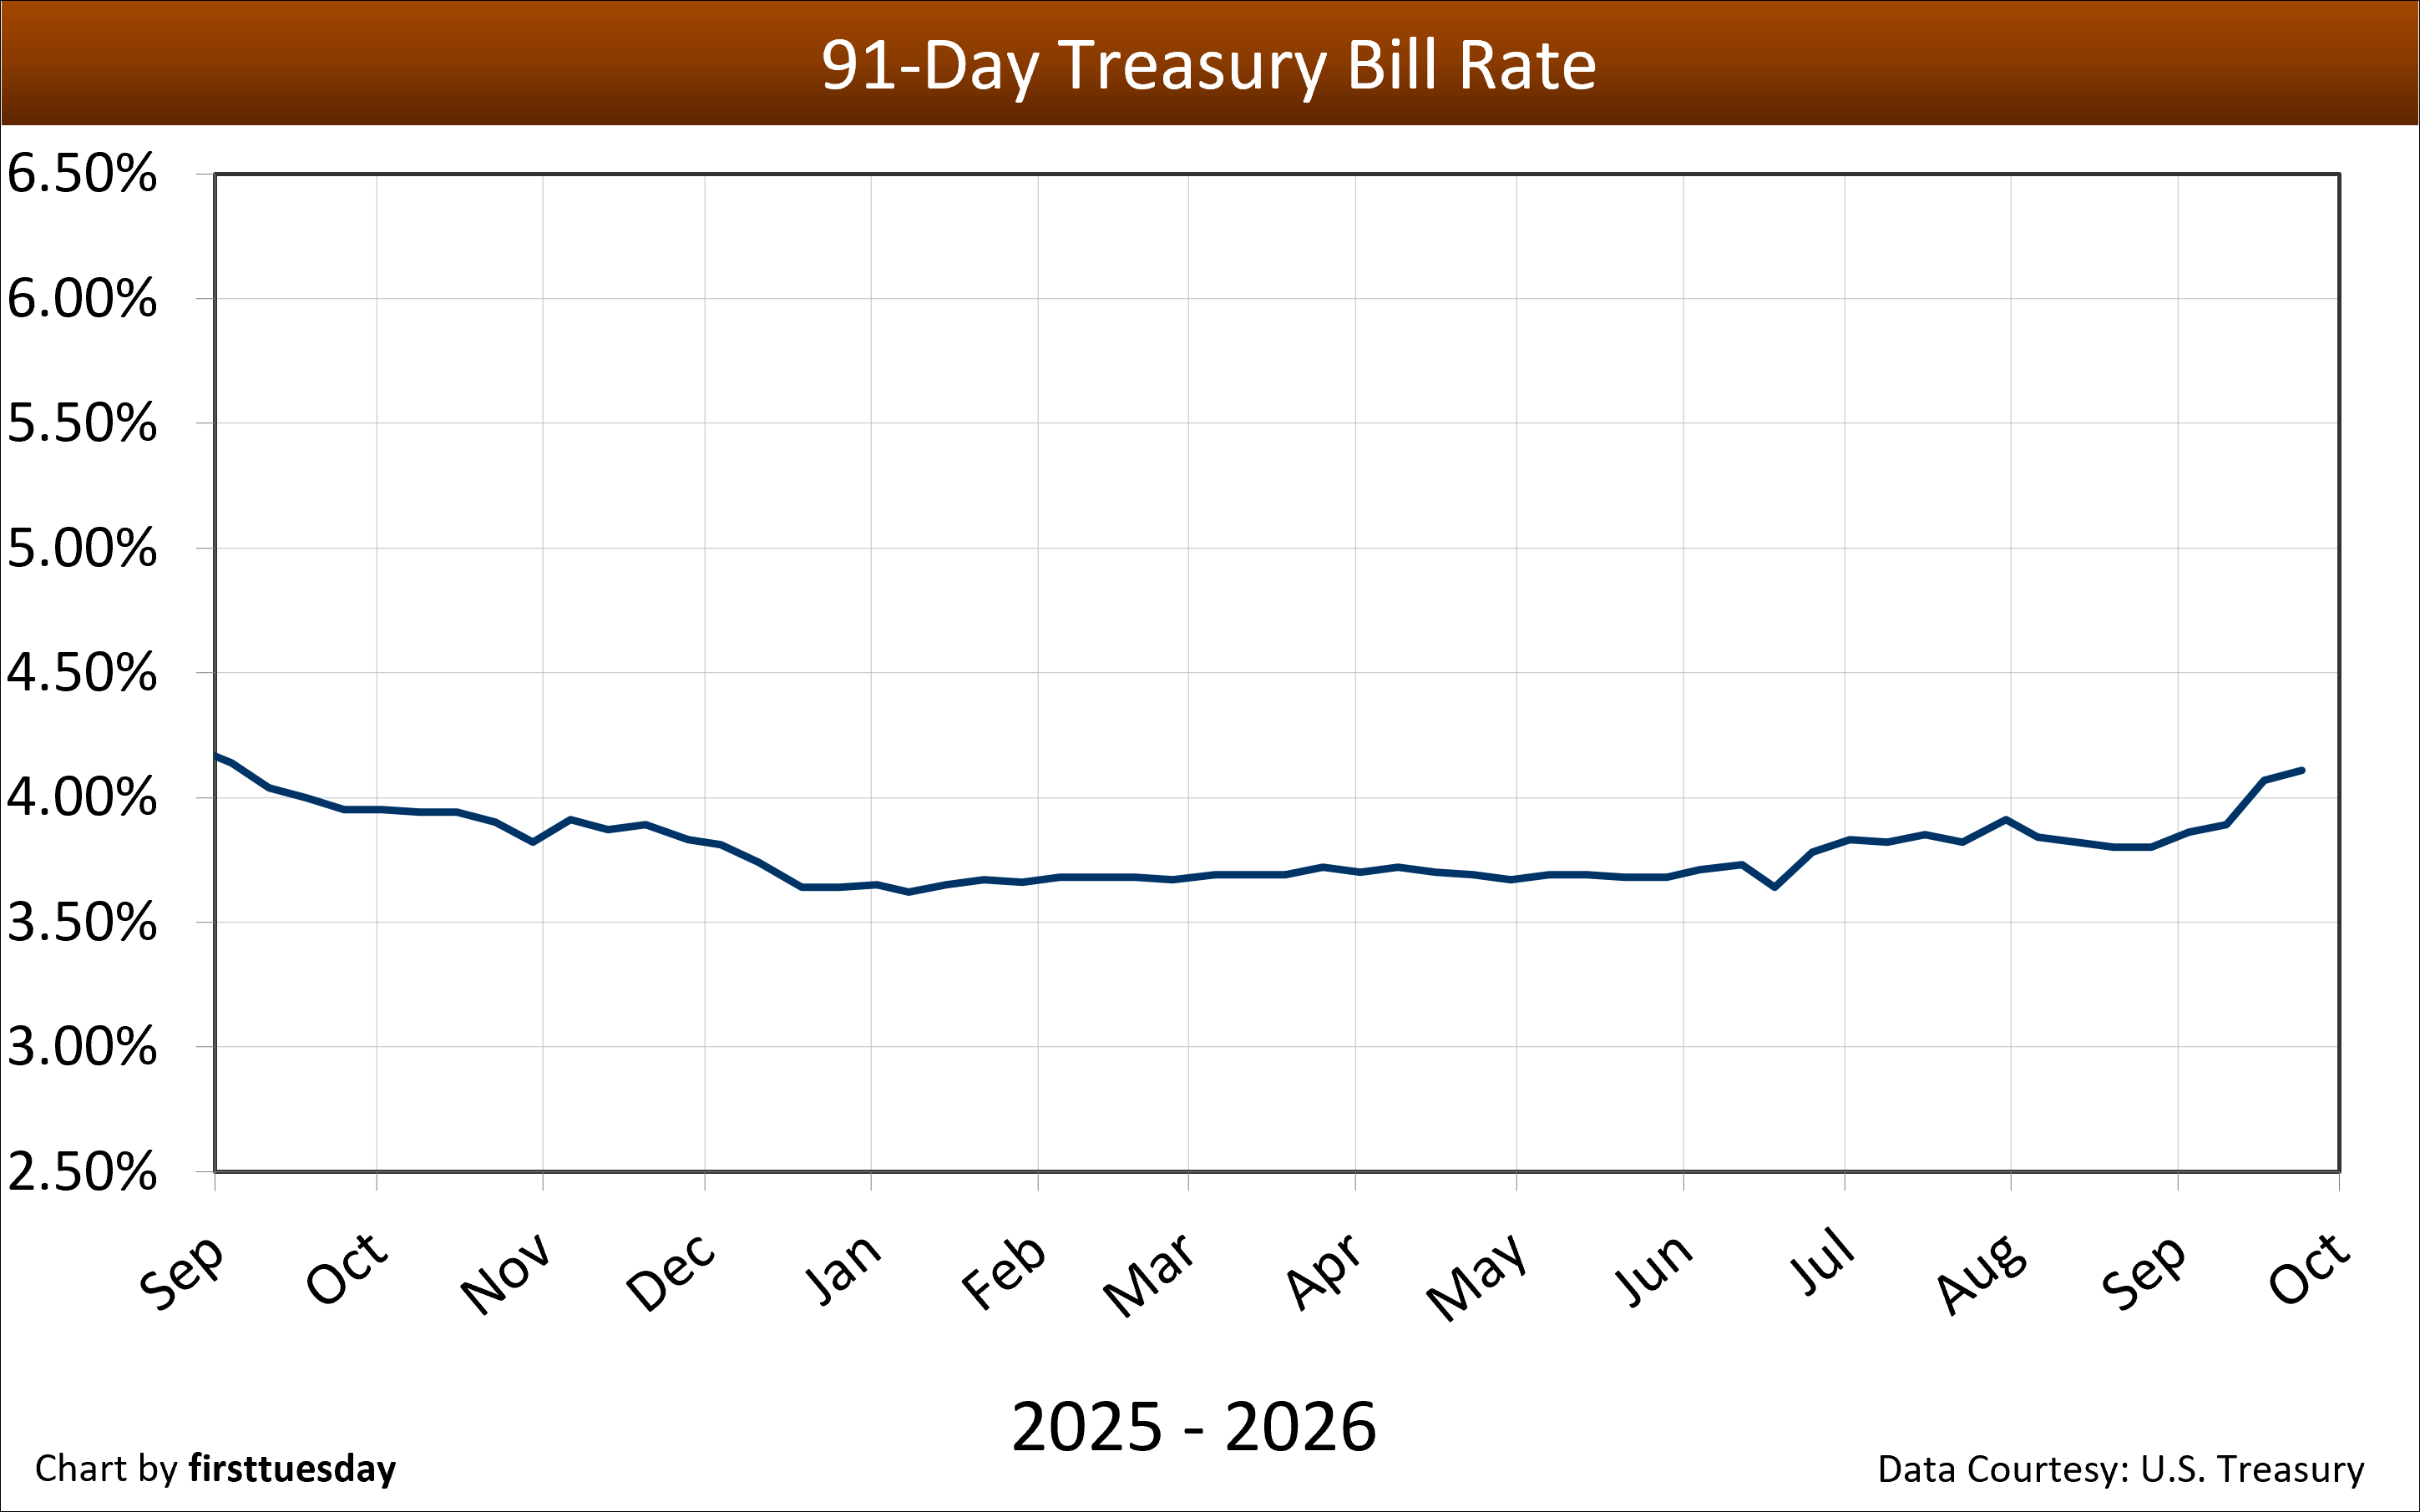
7. 91-day Treasury bill rate — Chart update 9/25/2026
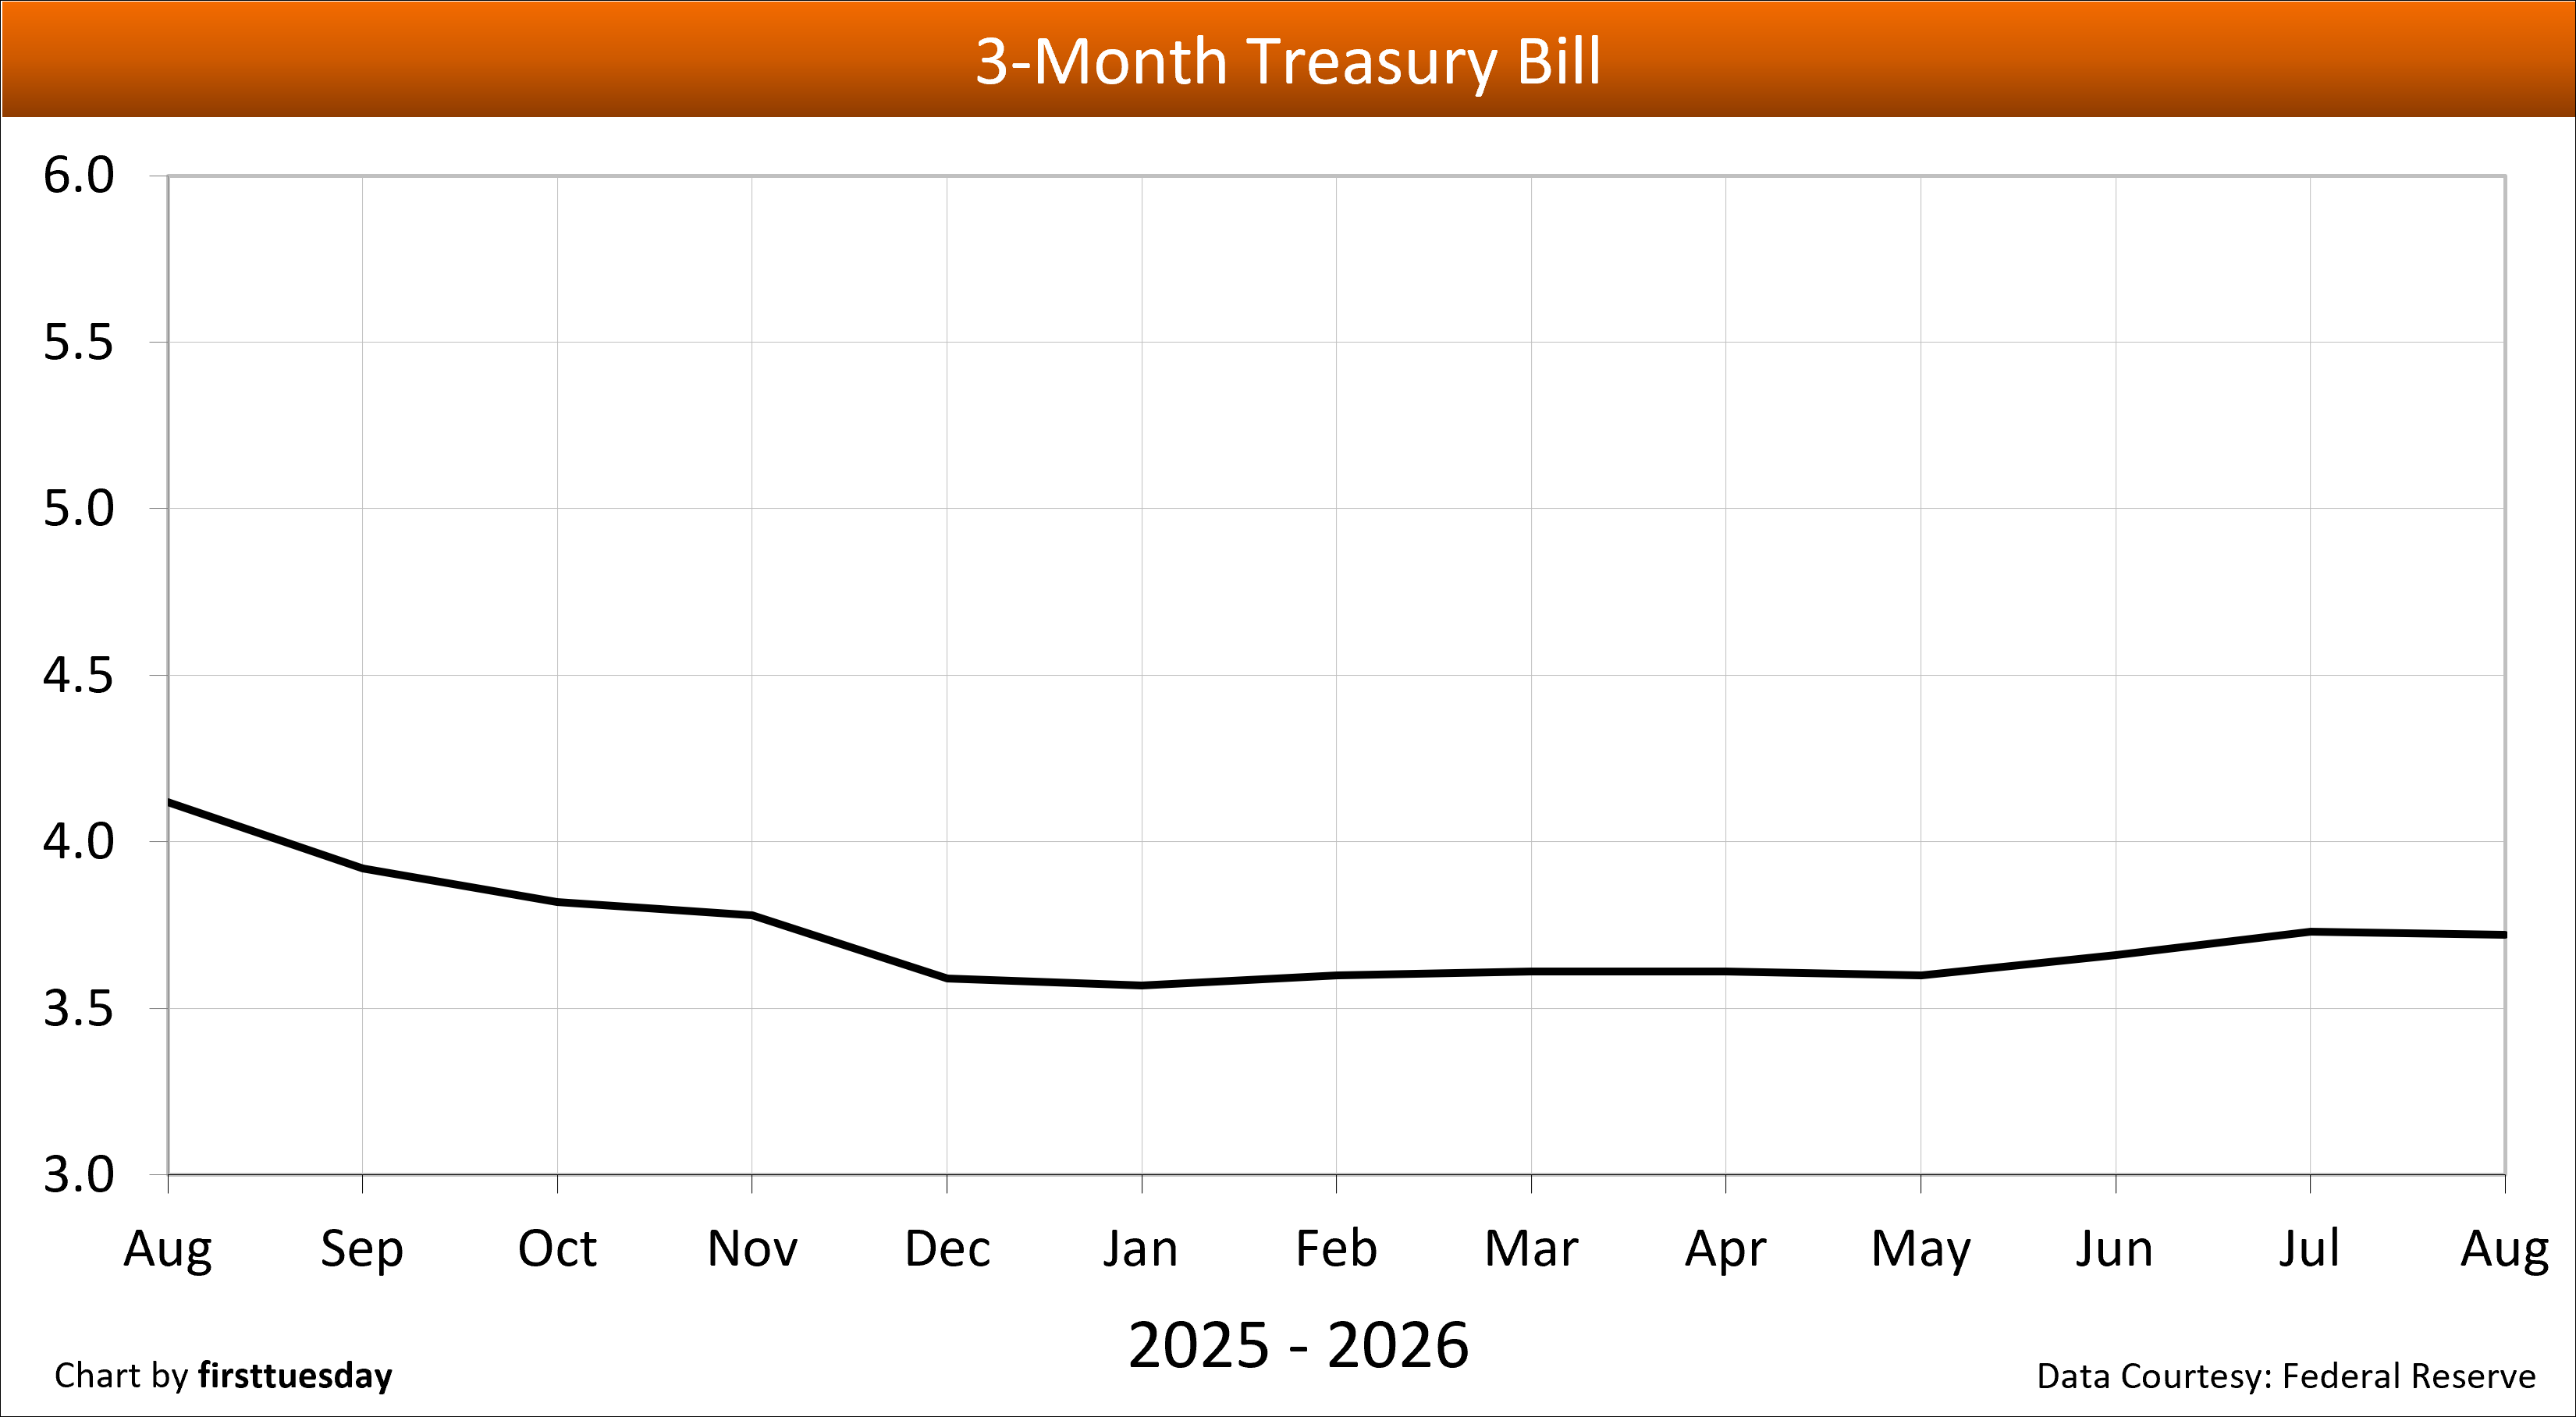
8. 3-month Treasury bill — Chart update 9/4/2026
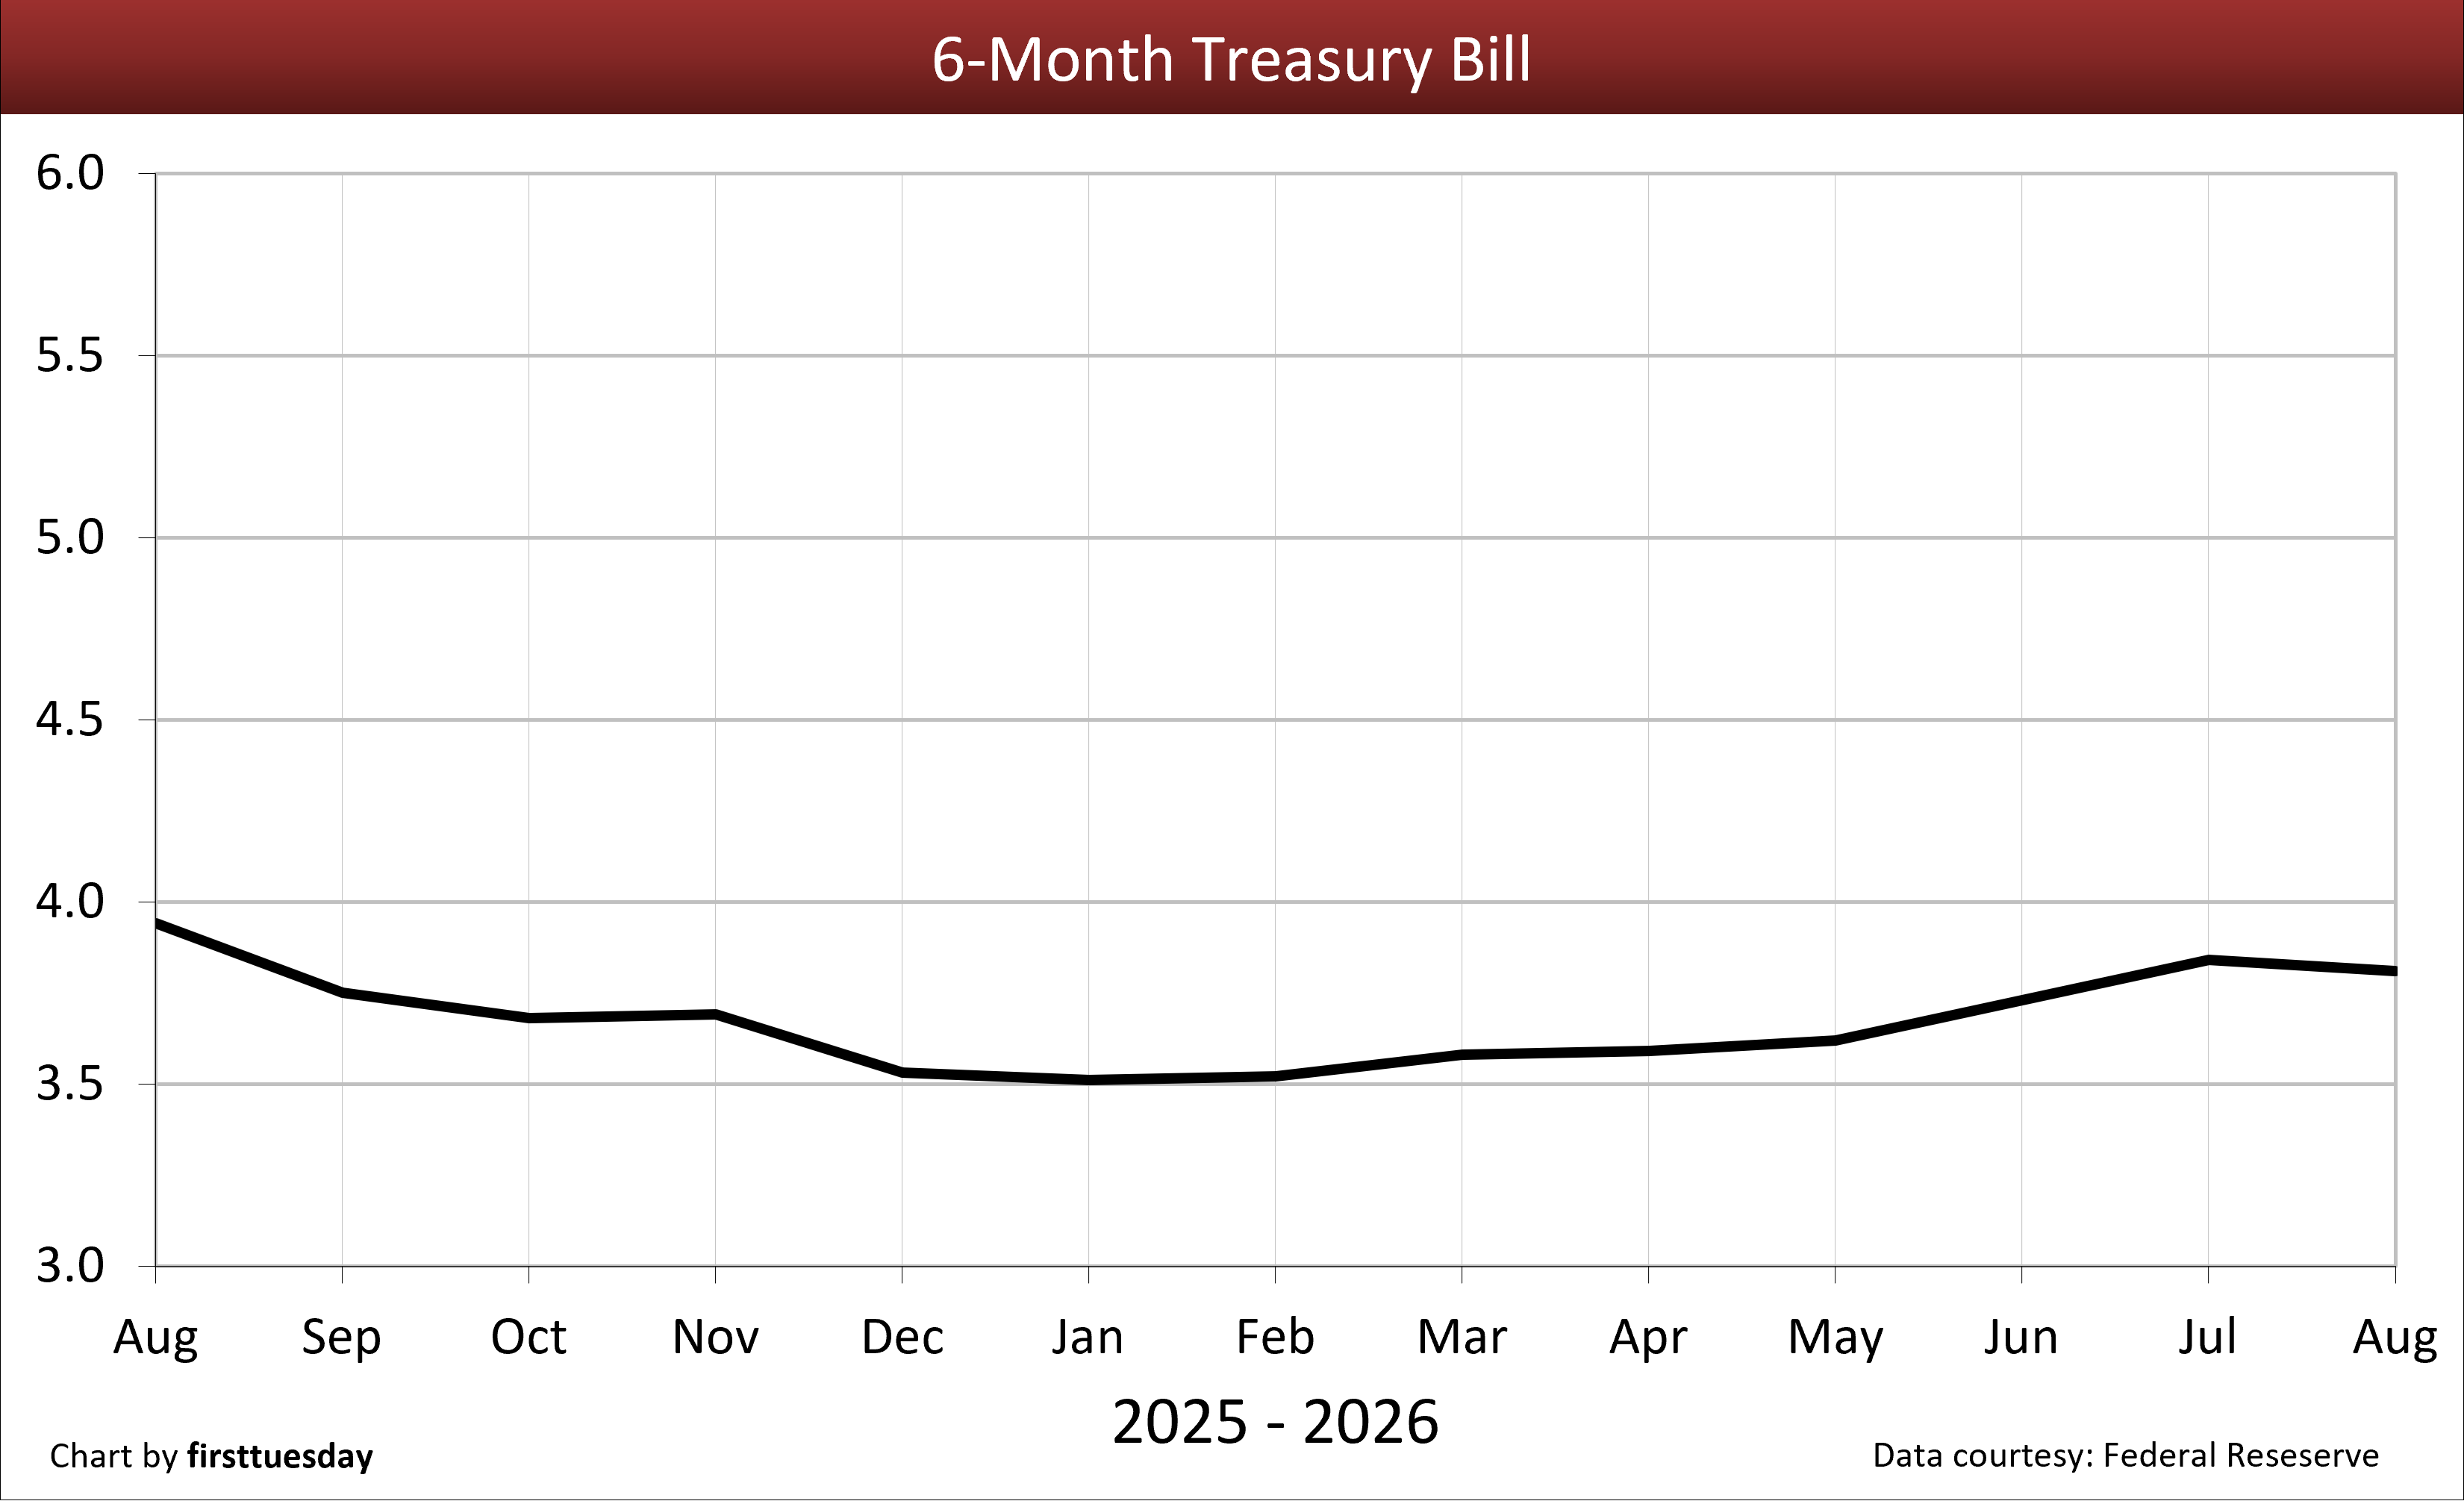
9. 6-month Treasury bill — Chart update 9/4/2026
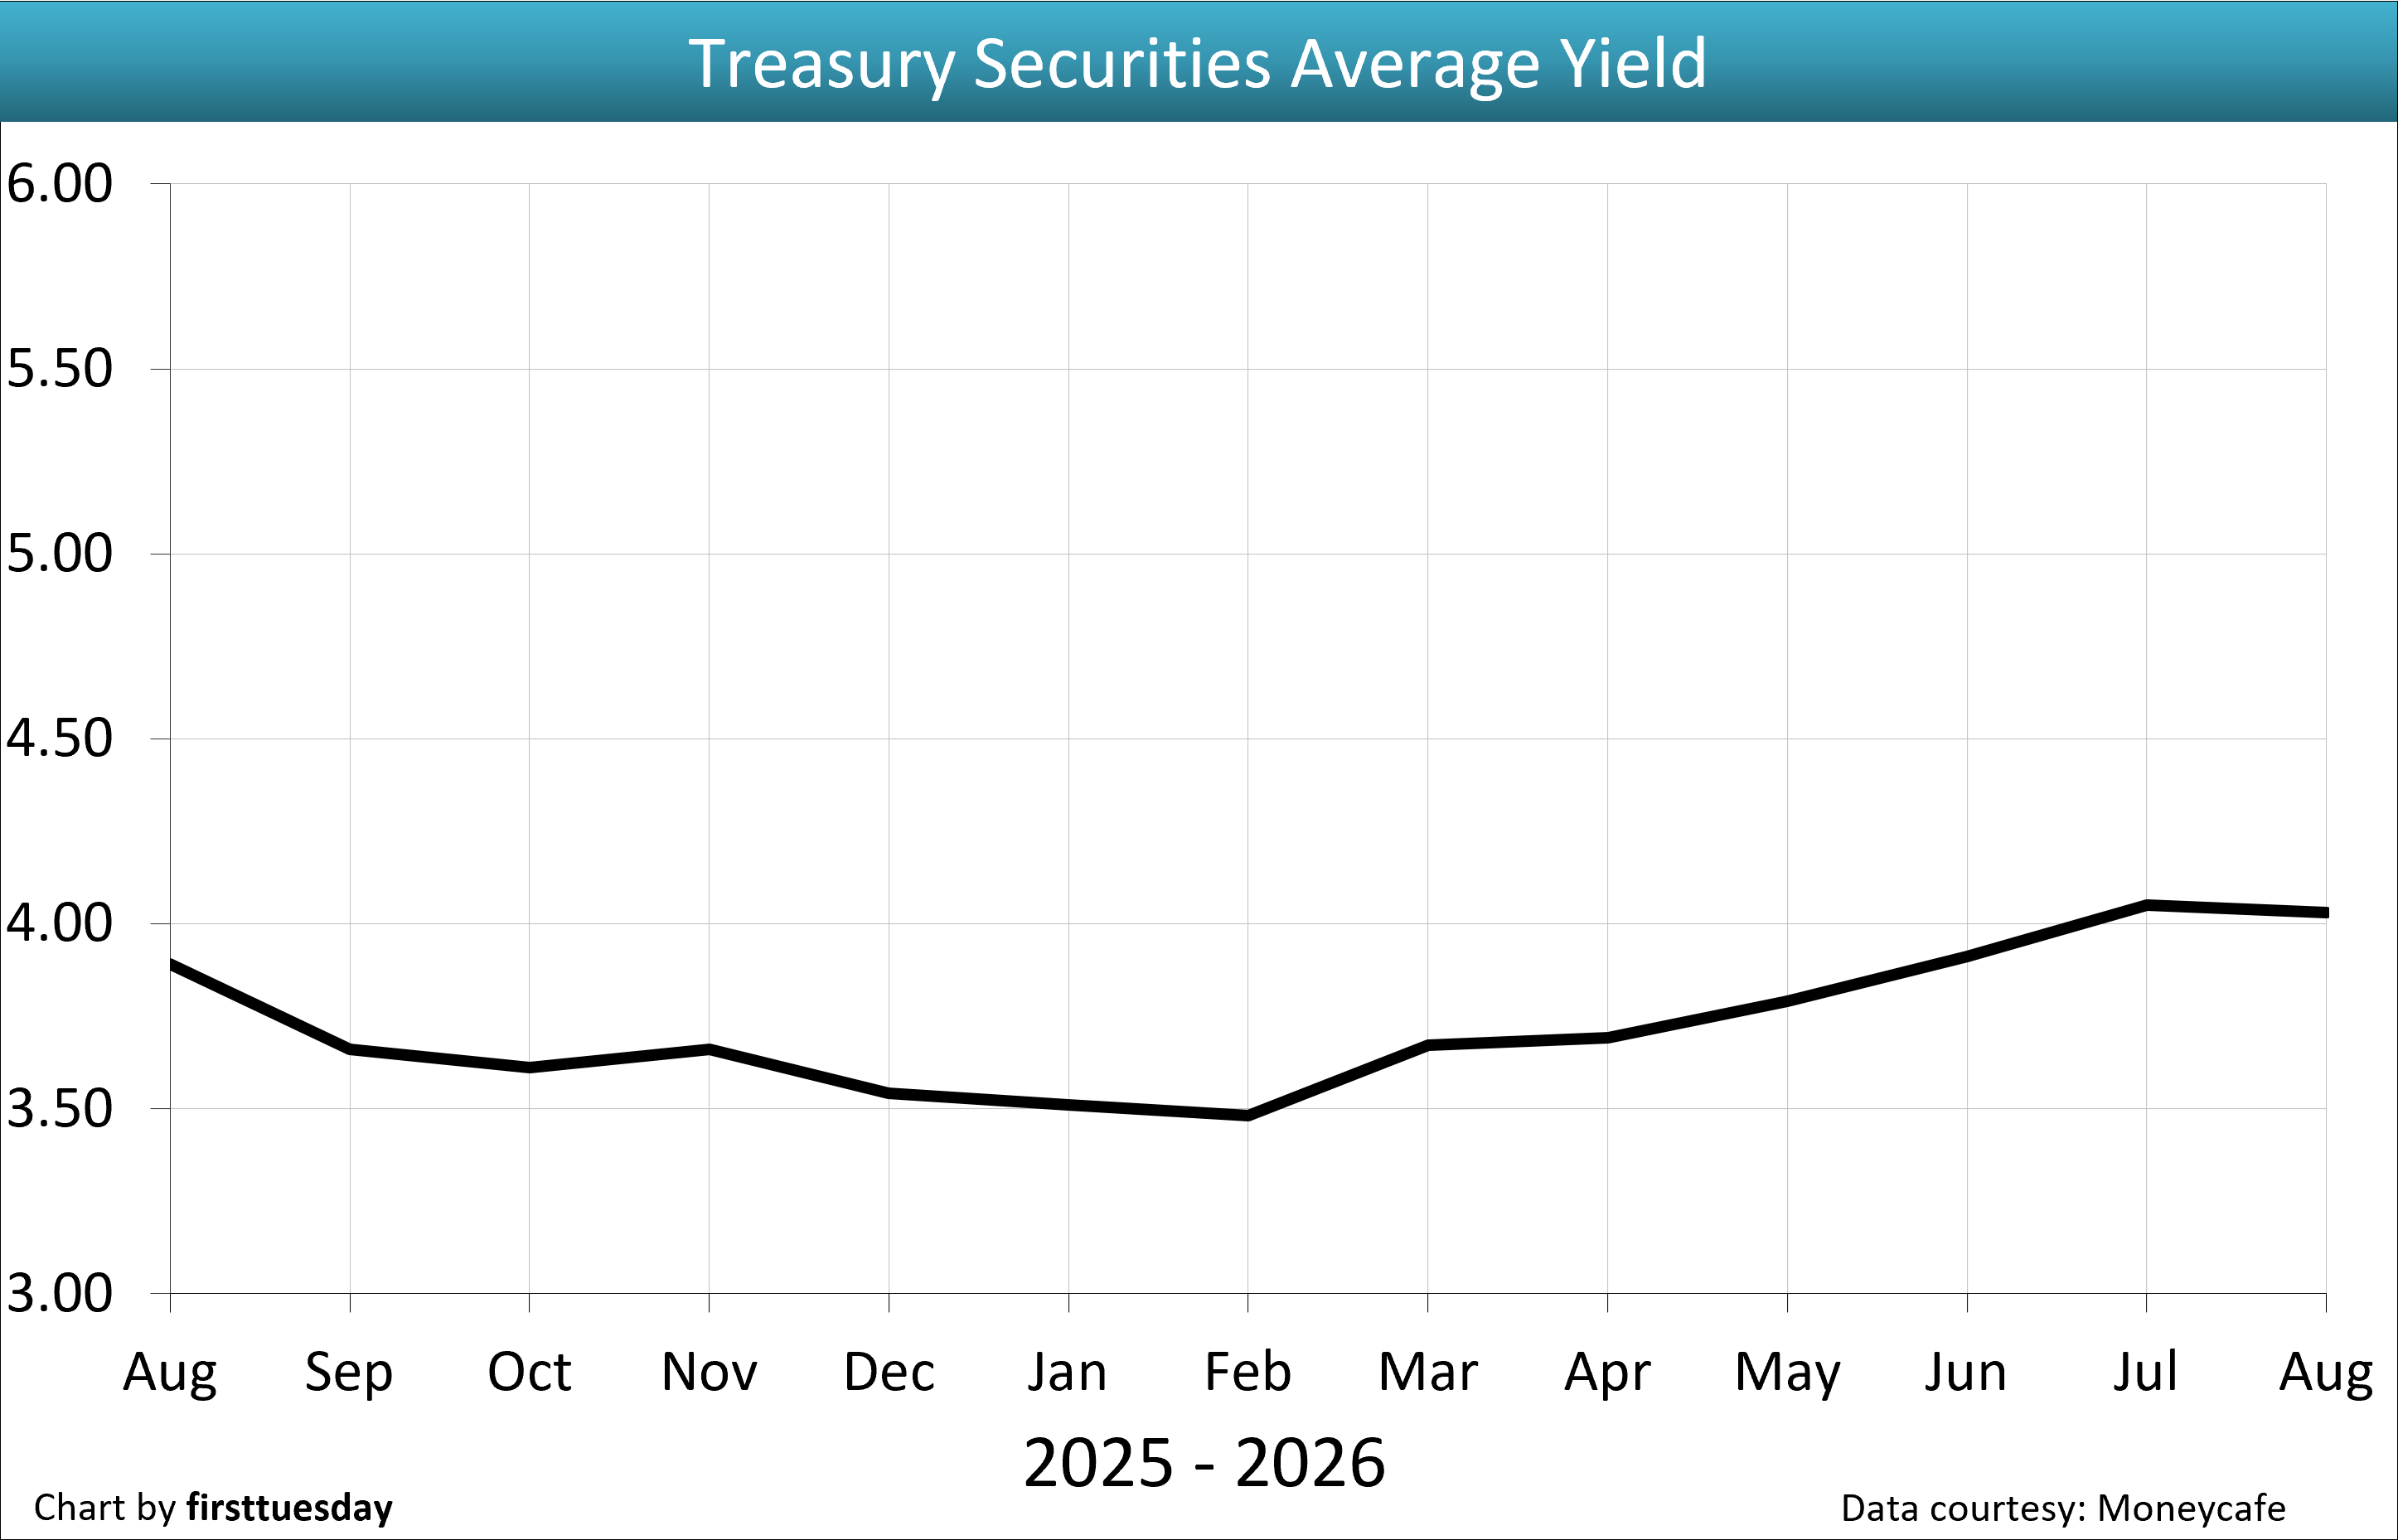
10. Treasury Securities average yield (CMT) — Chart update 9/4/2026
11. 12-month Treasury average — Chart update 9/4/2026
12. Secured Overnight Financing Rate (SOFR) — Chart update 9/25/2026
13. Applicable federal rates — Chart update 9/4/2026
 | ||
| Chart update 9/25/26 | ||
Current | Month ago 8/27/26 6.66% | Year ago 9/25/25 6.30% |
The average 30-year FRM rate in California is provided by the St. Louis Federal Reserve Bank.
| ||
 | ||
| Chart update 9/4/26 | ||
August 2026 Average 6.67% | July 2026 Average 6.54% | August 2025 Average 6.59% |
 | ||
| Chart update 9/25/26 | ||
Current 9/24/26 6.42% | Month ago 8/27/26 5.98% | Year ago 9/25/25 5.49% |
The average 15-year FRM rate in California is provided by the St. Louis Federal Reserve Bank.
| ||
 | ||
| Chart update 9/4/26 | ||
August 2026 6.39% | July 2026 6.35% | August 2025 5.94% |
The 5/1 average adjustable rate mortgage (ARM) rate shows the average rate for the first five years after origination. After the initial five-year period, the ARM rate is adjusted annually based on an index figure, such as a certain Treasury Bill rate (which reflects Federal Reserve rate movements) or the Secure Overnight Financing Rate (SOFR). The average ARM rate is provided by Freddie Mac’s survey of the U.S. | ||
 | ||
| Chart update 9/25/26 | ||
Current 9/25/26 5.21% | Month ago 8/21/26 4.74% | Year ago 9/26/25 4.19% |
This rate is a leading indicator of the direction of future Freddie Mac rates. The 10-year rate historically runs closer to 4% during a stable money market. The rate is influenced by worldwide demand for the dollar and anticipated future domestic inflation. | ||
 | ||
| Chart update 9/4/26 | ||
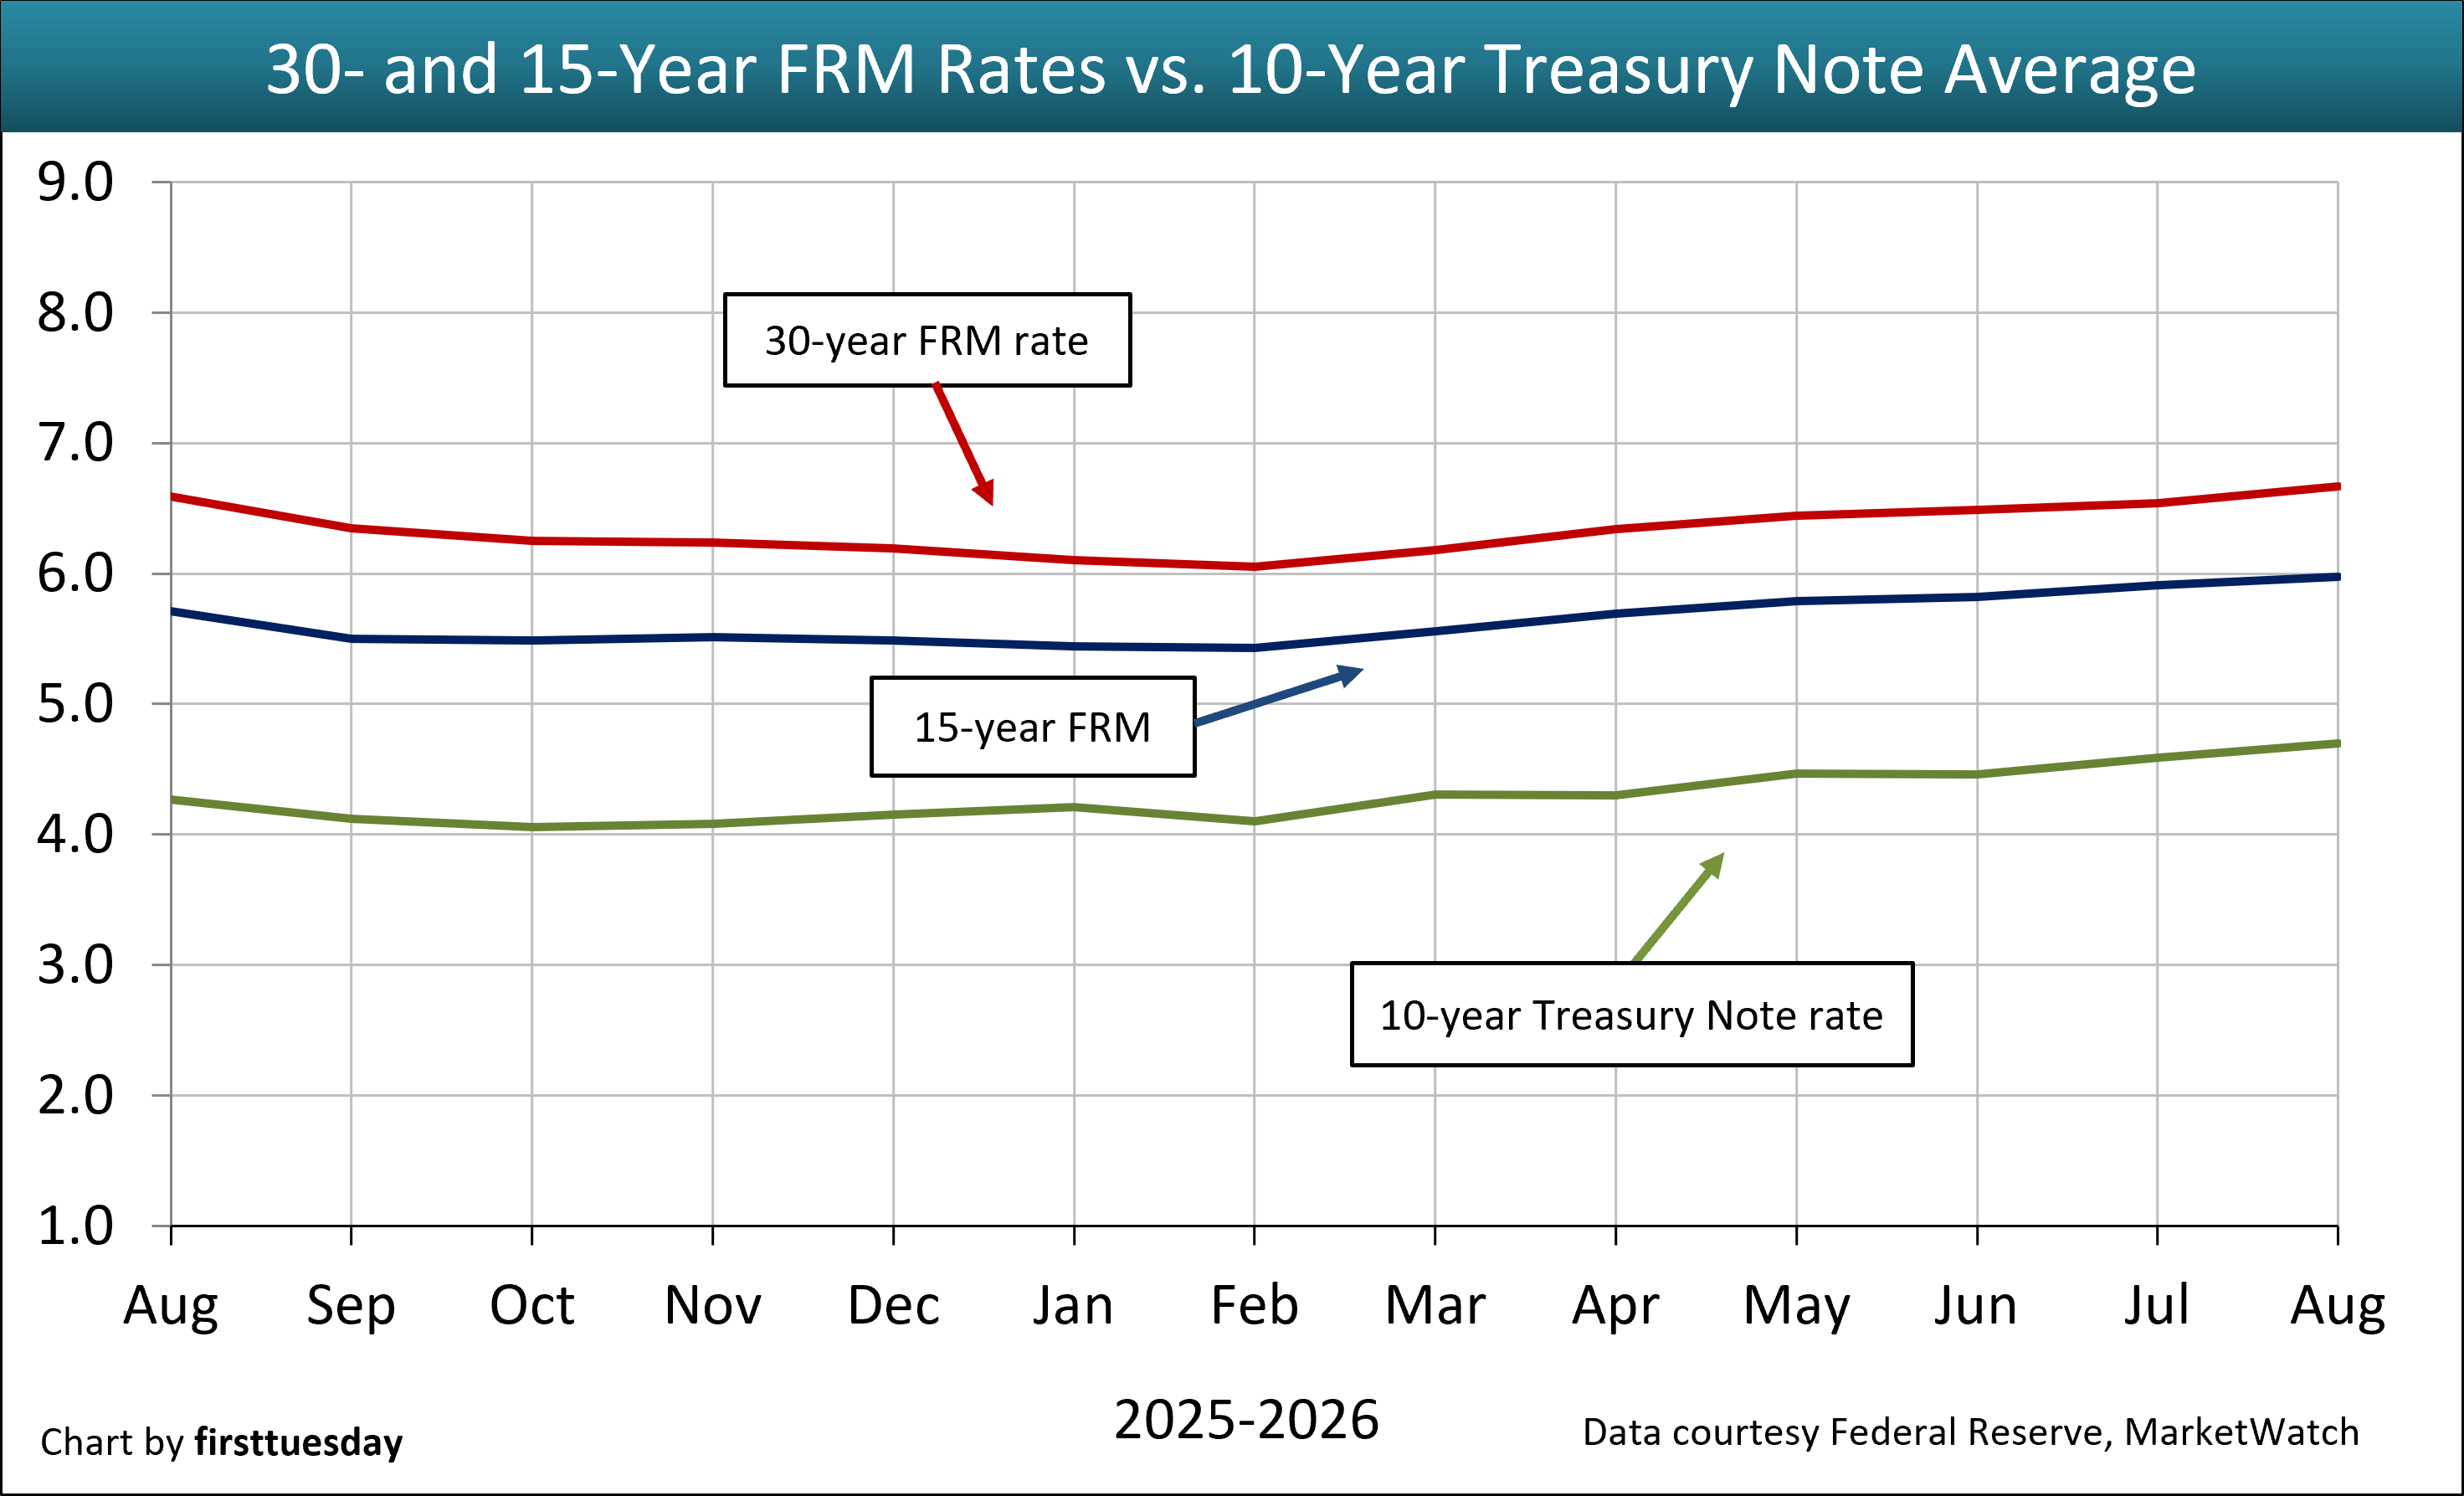
Avg 15-year August 2026 5.98% | Avg 30-year August 2026 6.67% | Avg 10-year T-Note August 2026 4.70% |
The average 15- and 30-year conventional commitment rates are the rates at which a lender commits to lend mortgage money in the United States-West/California for the duration of the life of each respective mortgage as reported by Freddie Mac. The green line reflects the 10-year Treasury Note Average, a leading indicator of the direction of future Freddie Mac rates. It is composed of the level of worldwide demand for the dollar and anticipated future domestic inflation.
| ||
 | ||
| Chart update 9/25/26 | ||
Current 9/24/26 4.11% | Month Ago 8/27/26 3.80% | Year Ago 9/25/25 3.95% |
This rate determines the minimum interest rate the seller must use in a delayed §1031 transaction and report when not receiving interest on §1031 monies held by a facilitator/accommodator. This rate also sets the amount of the ordinary income the facilitator/accommodator must report. | ||
 | ||
| Chart update 9/4/26 | ||
August 2026 3.72% | July 2026 3.73% | August 2025 4.12% |
The 3-Month Treasury Bill rate is heavily influenced by the Federal Reserve through the Fed Funds Rate as the base price of borrowing money in the short-term. It is used in determining the 3-month:10-year yield spread used to predict the likelihood of a recession one year forward. The posted rate is the monthly average for the listed month. Rates are released with a one-to-two month reporting delay.
| ||
 | ||
| Chart update 9/4/2026 | ||
August 2026 3.81% | July 2026 3.84% | August 2025 3.94% |
The six-month T-Bill rate is one of several indices used by lenders to periodically adjust the adjustable rate mortgage (ARM) rate. The adjusted rate equals the indexed rate (at the time of adjustment or an average of several prior rates) plus the lender’s profit margin. The posted rate is the monthly average for the listed month. Rates are released with a one-to-two month reporting delay. | ||
 | ||
| Chart update 9/4/26 | ||
August 2026 4.03% | July 2026 4.05% | August 2025 3.89% |
This index is one of several indexes used by lenders as stated in their ARM note to periodically adjust the note’s interest rate. The ARM interest rate equals T-Bill yield, plus the lender’s profit margin. The index is an average of T-Bill yields with maturities adjusted to one year. | ||
 | ||
| Chart update 9/4/26 | ||
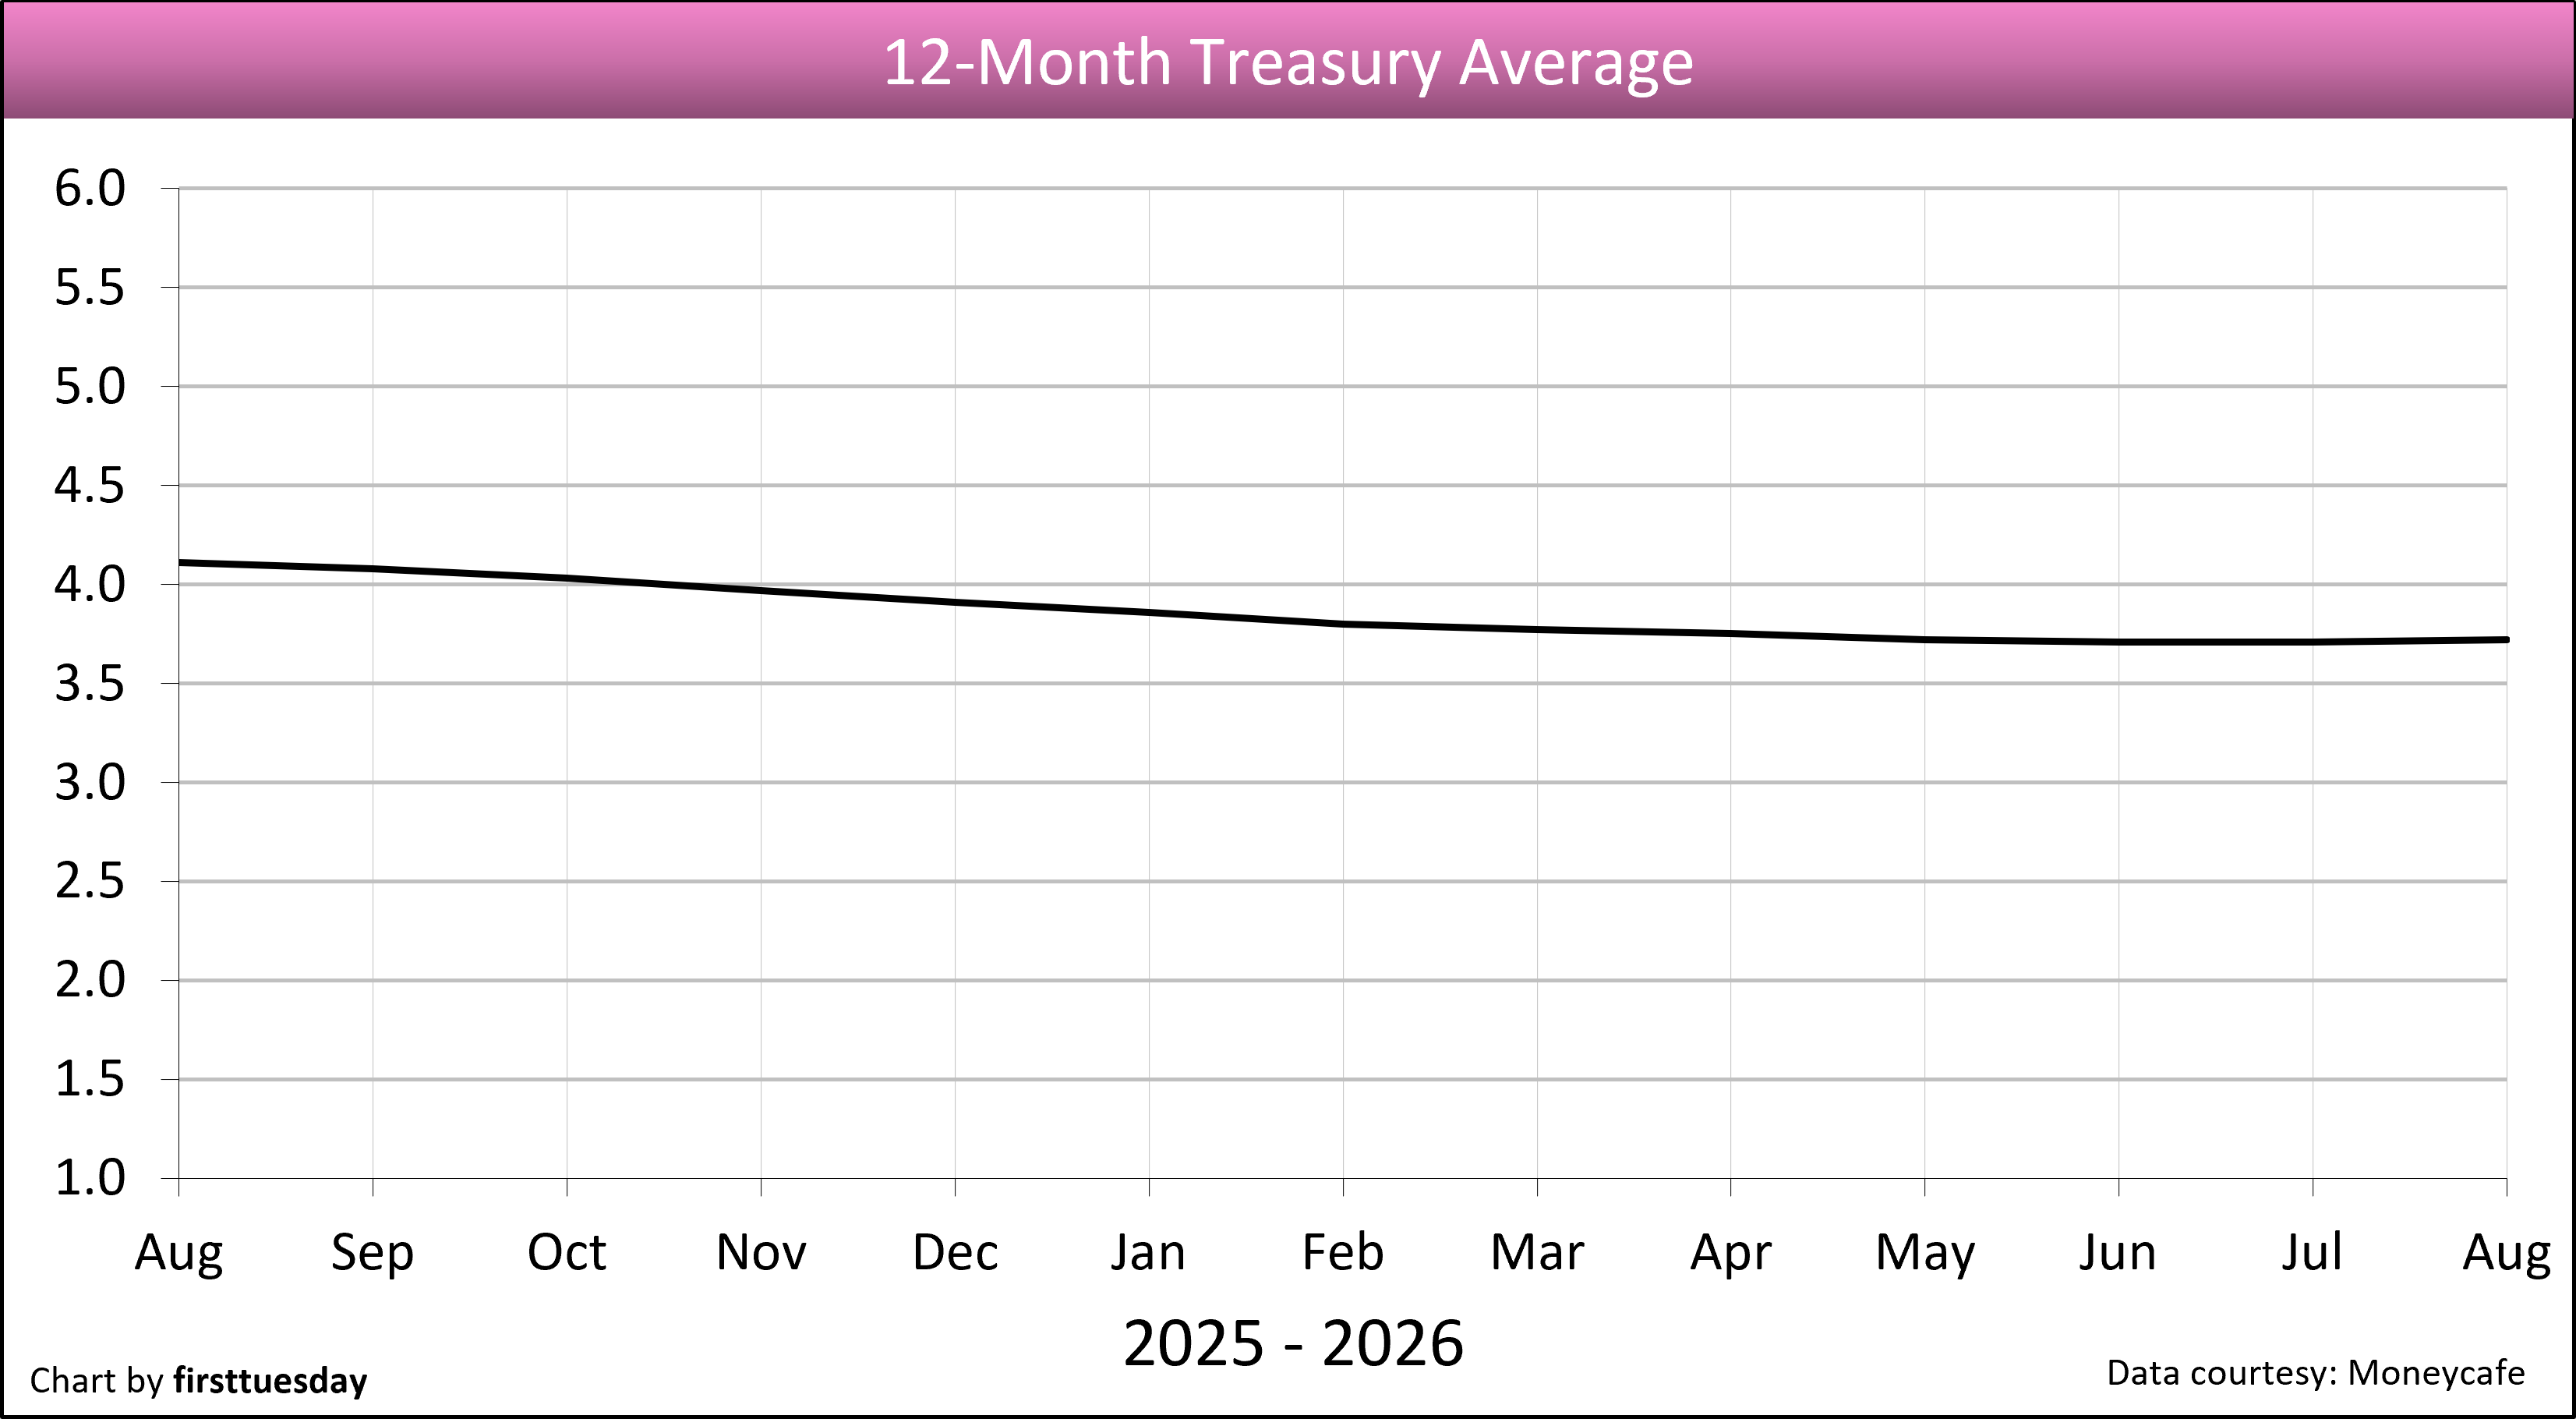
Current August 2026 3.72% | Month ago July 2026 3.71% | Year ago August 2025 4.11% |
This index is one of several indices used by lenders as stated in their ARM note to periodically adjust the note’s interest rate. This figure is an average of the one-year T-Bill rates for the past 12 months. The ARM interest rate equals the 12-Month Treasury Average yield plus the lender’s profit margin. There is a one-to-two month lag in data reporting for the 12-Month Treasury Average. | ||
 | ||
| Chart update 9/25/26 | ||
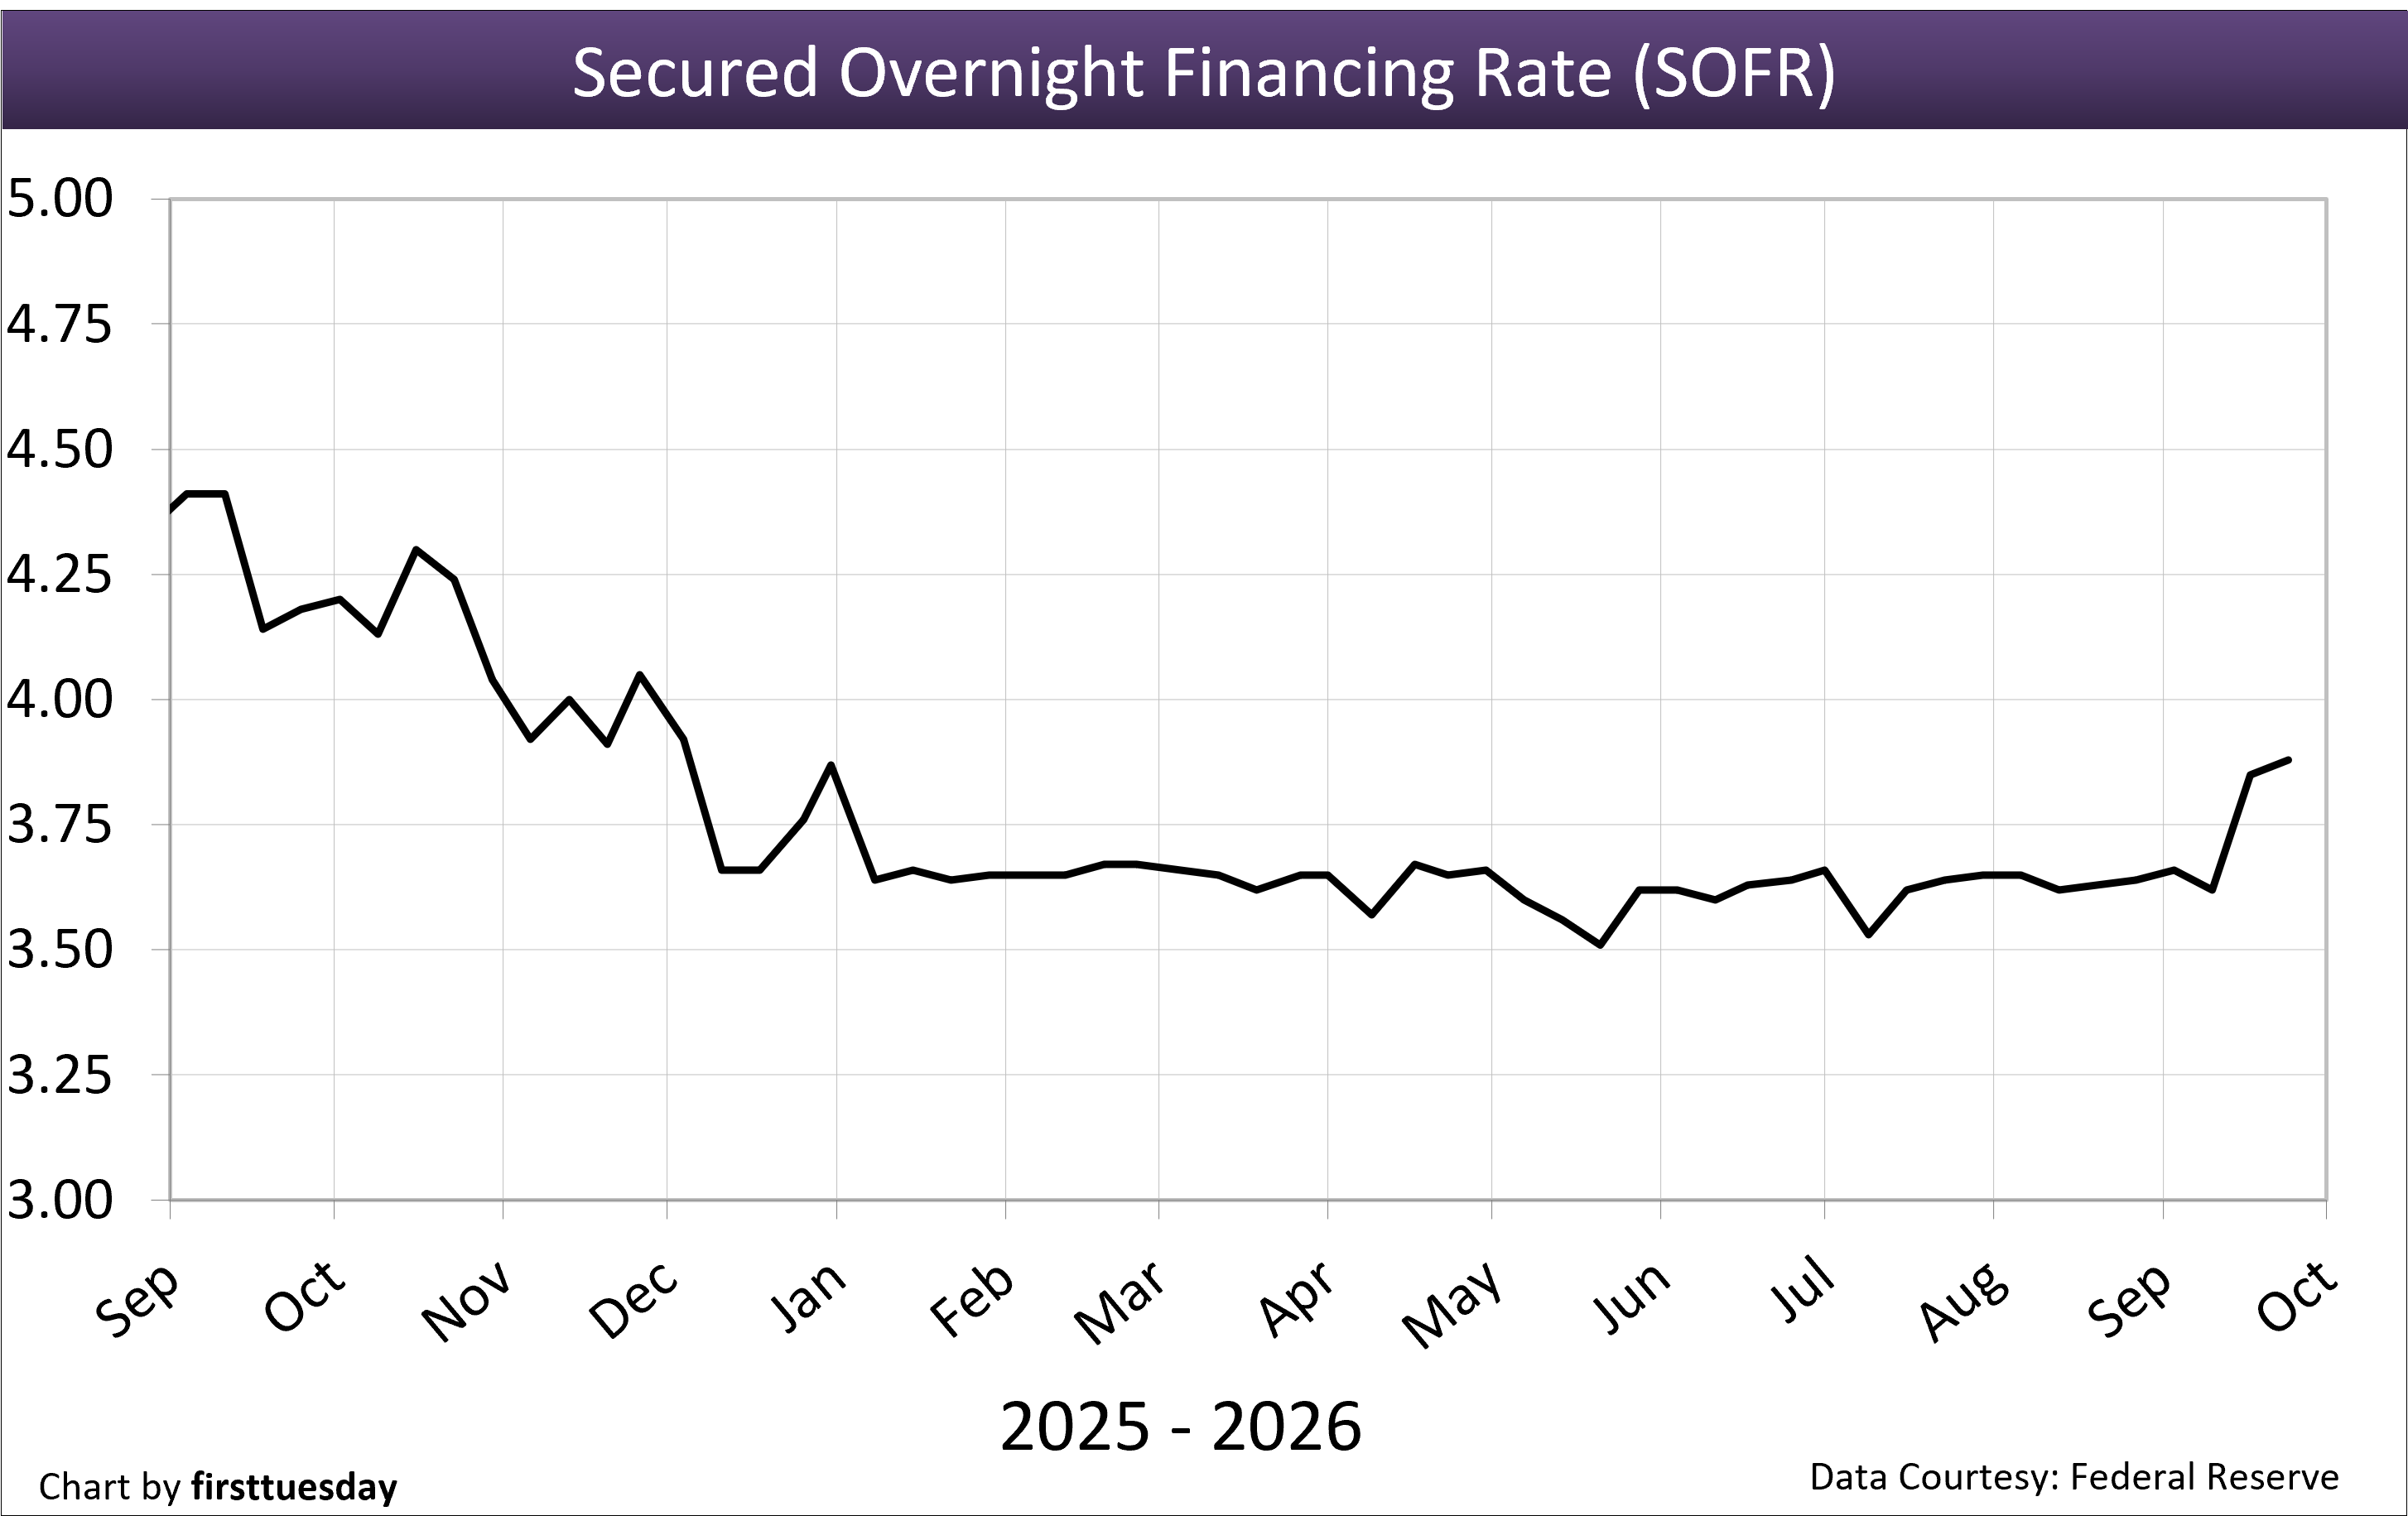
Current 9/24/26 3.88% | Month ago 8/27/26 3.64% | Year ago 9/25/25 4.18% |
This index is one of several indices used by lenders as stated in their ARM note to periodically adjust the note’s interest rate. It replaced the LIBOR in 2021, which was found to be manipulated in the years leading up to the 2008 recession and financial crisis. The ARM interest rate equals the SOFR rate plus the lender’s profit margin. The rate is based on overnight borrowing in the U.S. Treasury repo market. The SOFR is produced in a transparent manner and is based on observable transactions, rather than models, and, unlike the LIBOR, is not dependent on bank estimates. | ||
 | ||
| Chart update 9/4/26 | ||
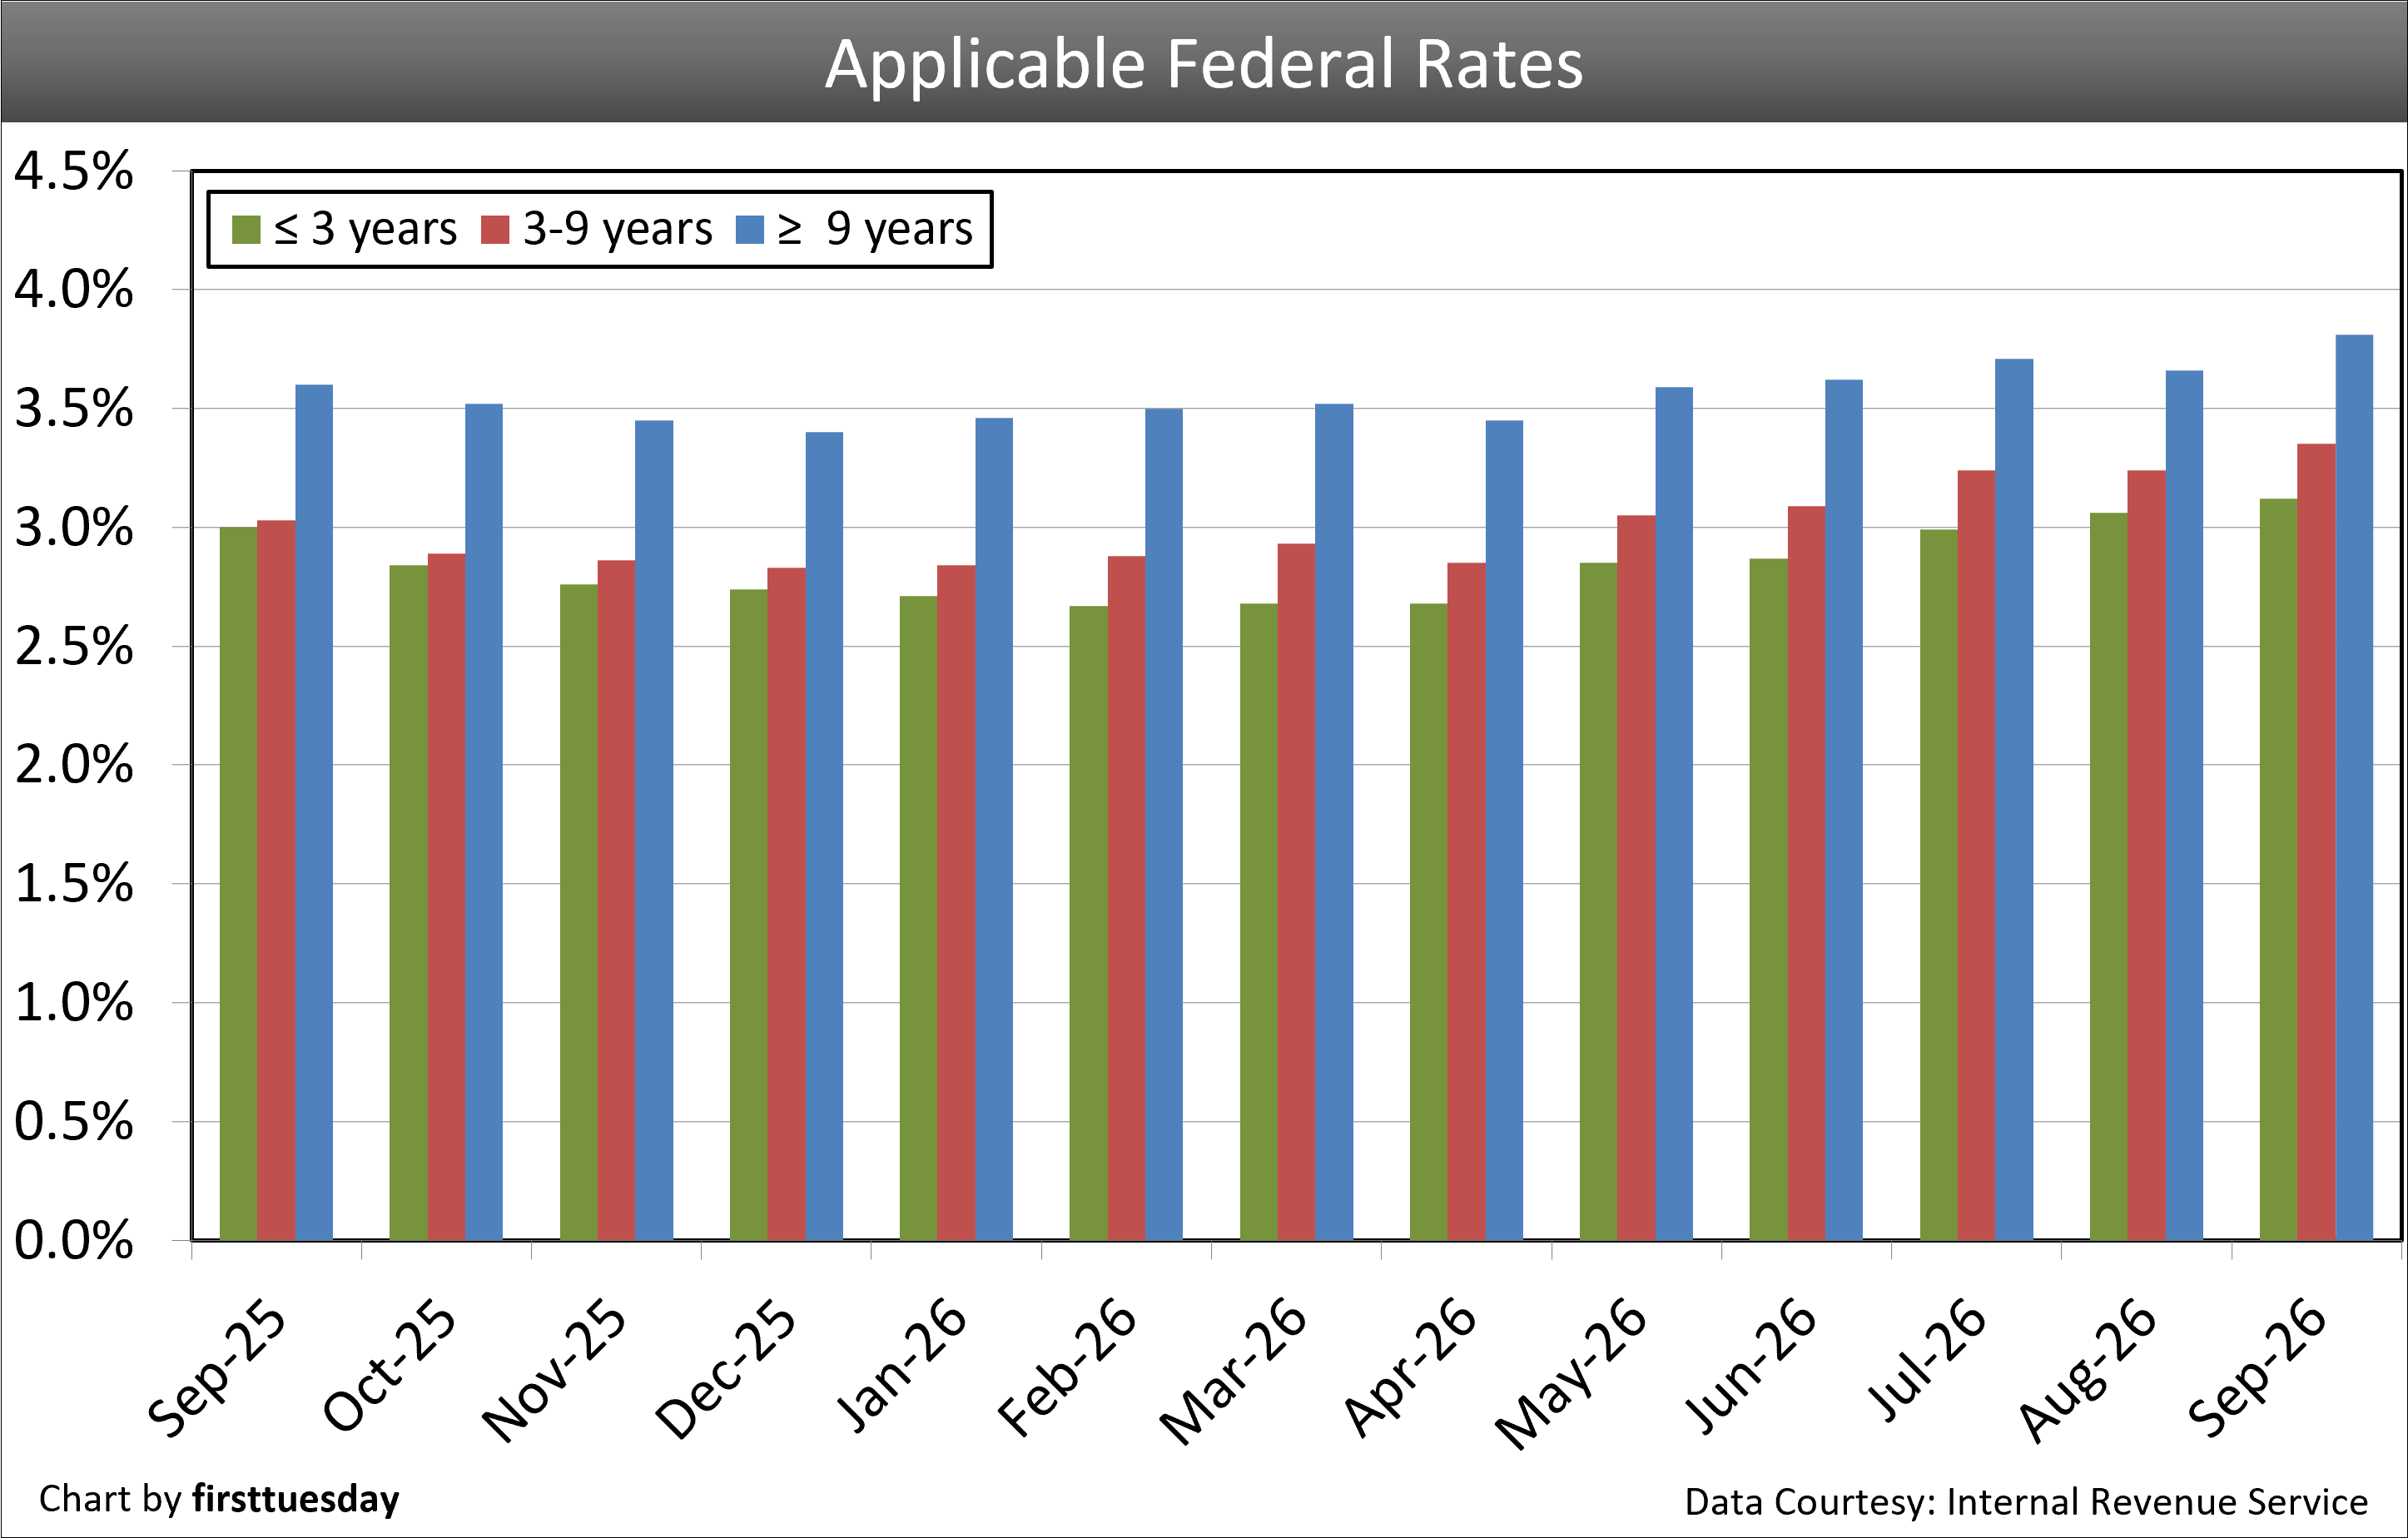
Short (3 years or less) September 2026 3.12% | Medium (3 to 9 years) September 2026 3.35% | Long (9+ years) September 2026 3.81% |
These rates determine minimum interest yield reportable on carryback financing. The applicable federal rate (AFR) category is determined by the carryback due date. Rates are for monthly payments, reported for the coming month.
| ||








It’s interesting that rates are still hovering near 7% even with the Fed holding steady. Are we seeing any regional differences in how lenders are pricing these trends?
Keeping up with trending mortgage rates helps real estate agents provide smarter guidance and make informed decisions in a constantly changing market. Staying updated allows them to better understand buyer behavior and shifting property trends.
Interesting that rates are still trending despite the Fed’s latest pause. Are we seeing more buyers lock in now or waiting for the next dip?
Very informative analysis, thanks!
** With mortgage rates trending in mid-2026, it would be helpful to see a breakdown of how these rates vary by region and loan type rather than just a national average
With mortgage rates shifting in mid-2026, it’s crucial for prospective homebuyers to track how rate fluctuations could impact affordability and long-term costs.
With mortgage rates trending this high in mid-2026, it’s clear that affordability remains the biggest hurdle for first-time buyers. I’d love to see a follow-up article breaking down how these rates compare regionally—some markets must be hit much harder than others.
With rates shifting in 2026, it’s clear that waiting on the sidelines could cost homeowners significantly more over the life of their mortgage. Would love to see a follow-up breaking down how these trends vary by state and loan type.
With mortgage rates still trending upward in mid-2026, it’s becoming increasingly important for prospective homebuyers to lock in rates early rather than waiting for potential dips that may not materialize.
Trending mortgage rates continue to shape buyer demand and housing affordability.
Trending mortgage rates matter because they directly influence buying power, affordability, and overall real estate activity. As market uncertainty continues to shape California property values.
With rates shifting in mid-2026, it’s clear that buyers need to track weekly changes rather than locking in too early—especially given the timing around June’s market adjustments mentioned in this update.