
Why this matters: Without better numbers, vacancy rates and net absorption in the third quarter of 2026 for Southern California commercial real estate spell trouble while an official recession remains undeclared, much like during the Vietnam conflict.
The commercial property landscape
The third quarter (Q3) 2026 reports on the Southern California (SoCal) commercial property market are in, courtesy of VOIT Real Estate Services.
SoCal’s commercial market — which includes San Diego, Orange County, Los Angeles and the Inland Empire — continues to struggle to fill vacancies.
The industrial real estate market is a different landscape than earlier in the decade, when vacancy rates were as low as 1% in most markets during 2021-2022. Now, industrial vacancy rates are between 5% and 9%, with Los Angeles and Orange County on the lower end, and San Diego and the Inland Empire on the higher end.
The vacancy rate is the percentage of available properties or spaces that are unoccupied at a given time. It measures the proportion of rental space that is not currently occupied by tenants.
Rising vacancy rates signal a declining demand for commercial space. In turn, high vacancy rates put downward pressure on rental rates and property values. Persistent and widespread vacancies reduce a property’s income and value, making it an important metric for commercial landlords, investors, tenants and agents.
Office real estate has been languishing since the pandemic era coinciding with the explosion in remote work and trade wars. Businesses with return-to-office policies haven’t filled the vacancy gap in the following years. More recently, in the past two years, vacancy rates in the office sector are leveling off from their peak due to the conversion of offices into residential and other commercial uses.
Retail real estate is experiencing relatively lower vacancy rates than the industrial and office sectors. However, going into 2027, retail businesses struggle to remain profitable while competing against the rising trend in eCommerce and attempting to attract consumers who have less income to spend on discretionary purchases.
Read on for a deeper analysis into SoCal’s industrial, office and retail property markets.
San Diego County — industrial, office and retail
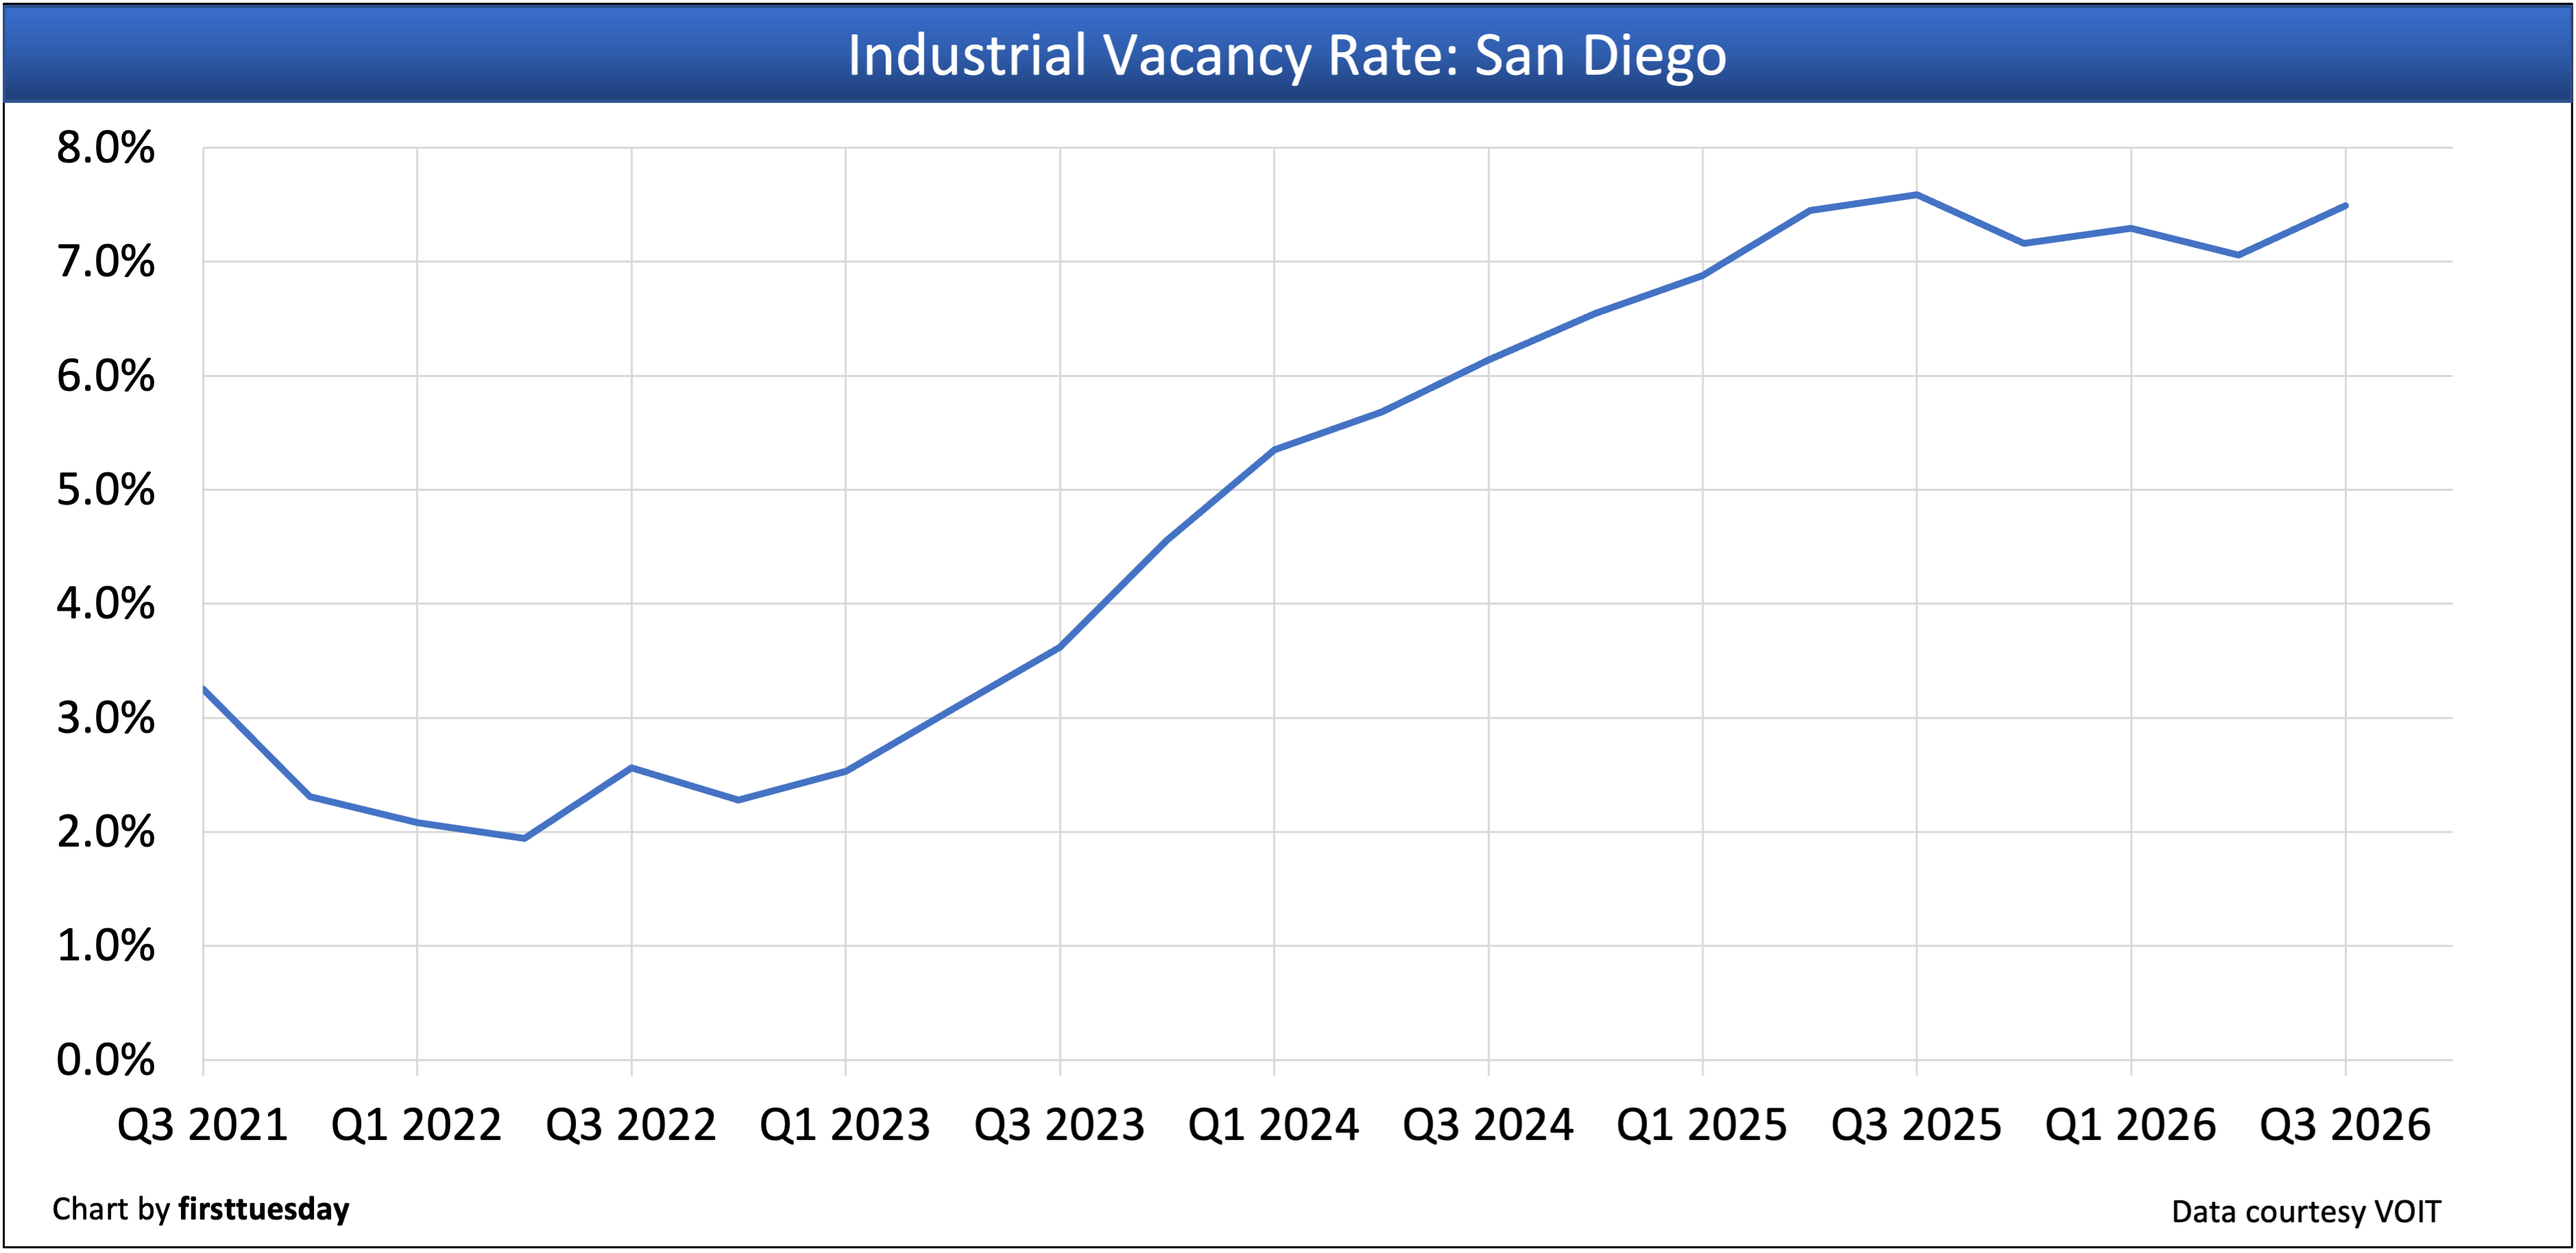
San Diego County’s industrial vacancy rate is:
- 7.49% in Q3 2026;
- up from 7.14% in Q2 2026; and
- up from 7.22% in Q3 2025.
Conclusion: Availability measures the share of space marketed for lease, whether occupied or vacant. The availability rate remained at 10.35% in Q3 2026, relatively unchanged from the previous quarter, when it reached its highest level since 2014.
San Diego County’s industrial net absorption — the total change in occupied industrial space during the quarter — is:
- +81,720 square feet in Q3 2026;
- up from -206,681 square feet in Q2 2026; and
- up from -236,106 square feet in Q3 2025.
Conclusion: Industrial net absorption totaled a positive 1 million square feet through the first three quarters of 2026. However, without the Amazon building completed in Q1, net absorption for 2026 is negative.
San Diego County’s office vacancy rate is:
- 15.00% in Q3 2026;
- down from 15.08% in Q2 2026; and
- down from 15.10% in Q3 2025.
Conclusion: The availability rate is 18% in Q3 2026. In San Diego’s Downtown district, availability is as high as 31%.
San Diego County’s office net absorption rate — the total change in occupied office space during the quarter — is:
- +25,601 square feet in Q3 2026;
- up from -7,766 square feet in Q2 2026; and
- up from -195,639 square feet in Q3 2025.
Conclusion: Despite positive office net absorption in Q3 2026, total office net absorption through the first three quarters of 2026 remained negative at -47,245 square feet.
San Diego County’s retail vacancy rate is:
- 4.38% in Q3 2026;
- down from 4.41% in Q2 2026; and
- up from 4.20% in Q3 2025.
Conclusion: Obsolete retail sites in San Diego continue to find higher and better uses, keeping overall vacancy low.
San Diego County’s retail net absorption rate — the total change in occupied retail space during the quarter — is:
- +29,718 square feet in Q3 2026;
- up from -125,227 square feet in Q2 2026; and
- up from -118,152 square feet in Q3 2025.
Conclusion: The total net absorption rate for 2026 thus far is -246,733 square feet. Store closures are amplified going into 2027 amid competition from online shopping, higher operating costs and changing consumer habits.
Orange County — industrial and office
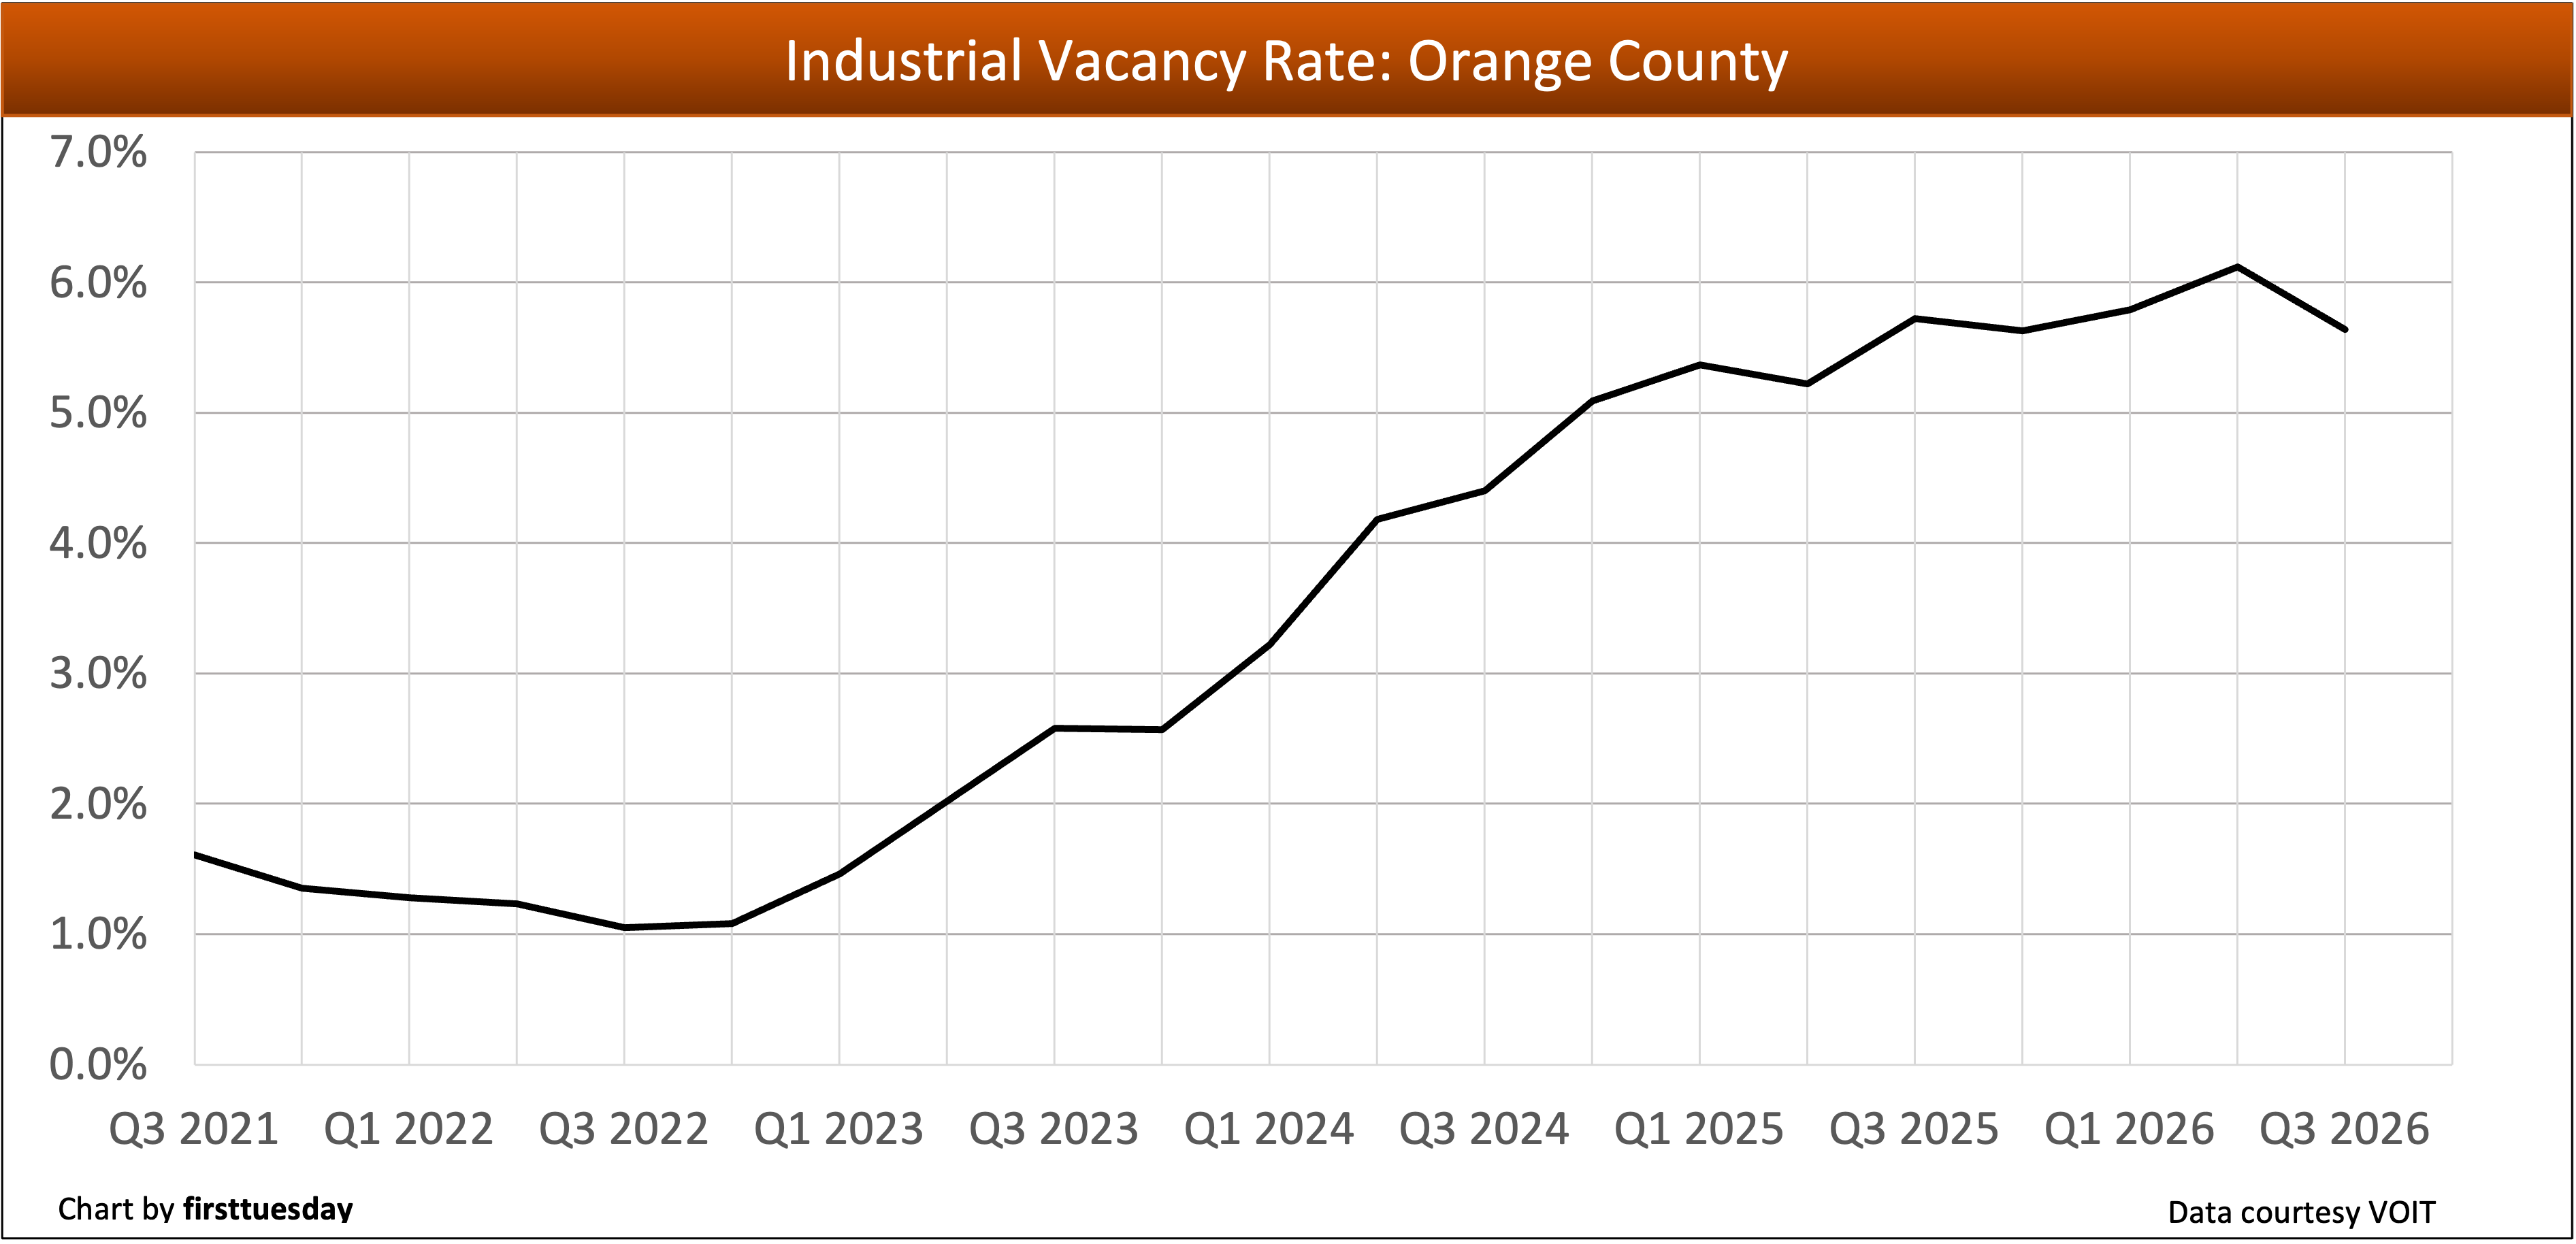
Orange County’s industrial vacancy rate is:
- 5.64% in Q3 2026;
- down from 6.12% in Q2 2026; and
- down from 5.72% in Q3 2025.
Conclusion: Industrial vacancy rates continue to flatten quarter-over-quarter, and most likely will continue to going into 2027. Industrial buildings with higher square footage tend to have more vacancies, up to 10.68%, and buildings with lower square footage tend to be less vacant, as low as 1.86%.
Orange County’s industrial net absorption rate is:
- +870,309 square feet in Q3 2026;
- up from -237,674 square feet in Q2 2026; and
- up from -612,876 square feet in Q3 2025.
Conclusion: Large-sized industrial move-ins accounted for most of the positive absorption.
Orange County’s office vacancy rate is:
- 12.61% in Q3 2026;
- down from 13.03% in Q2 2026; and
- down from 15.16% in Q3 2025.
Conclusion: The removal of office buildings from the market accounts for the decrease in vacancy rates.
Orange County’s office net absorption rate is:
- +233,194 square feet in Q3 2026;
- down from +308,223 square feet in Q2 2026; and
- down from +415,296 square feet in Q3 2025.
Conclusion: Orange County’s office market recorded its fifth consecutive quarter of positive net absorption in Q3 2026.
Los Angeles County — industrial
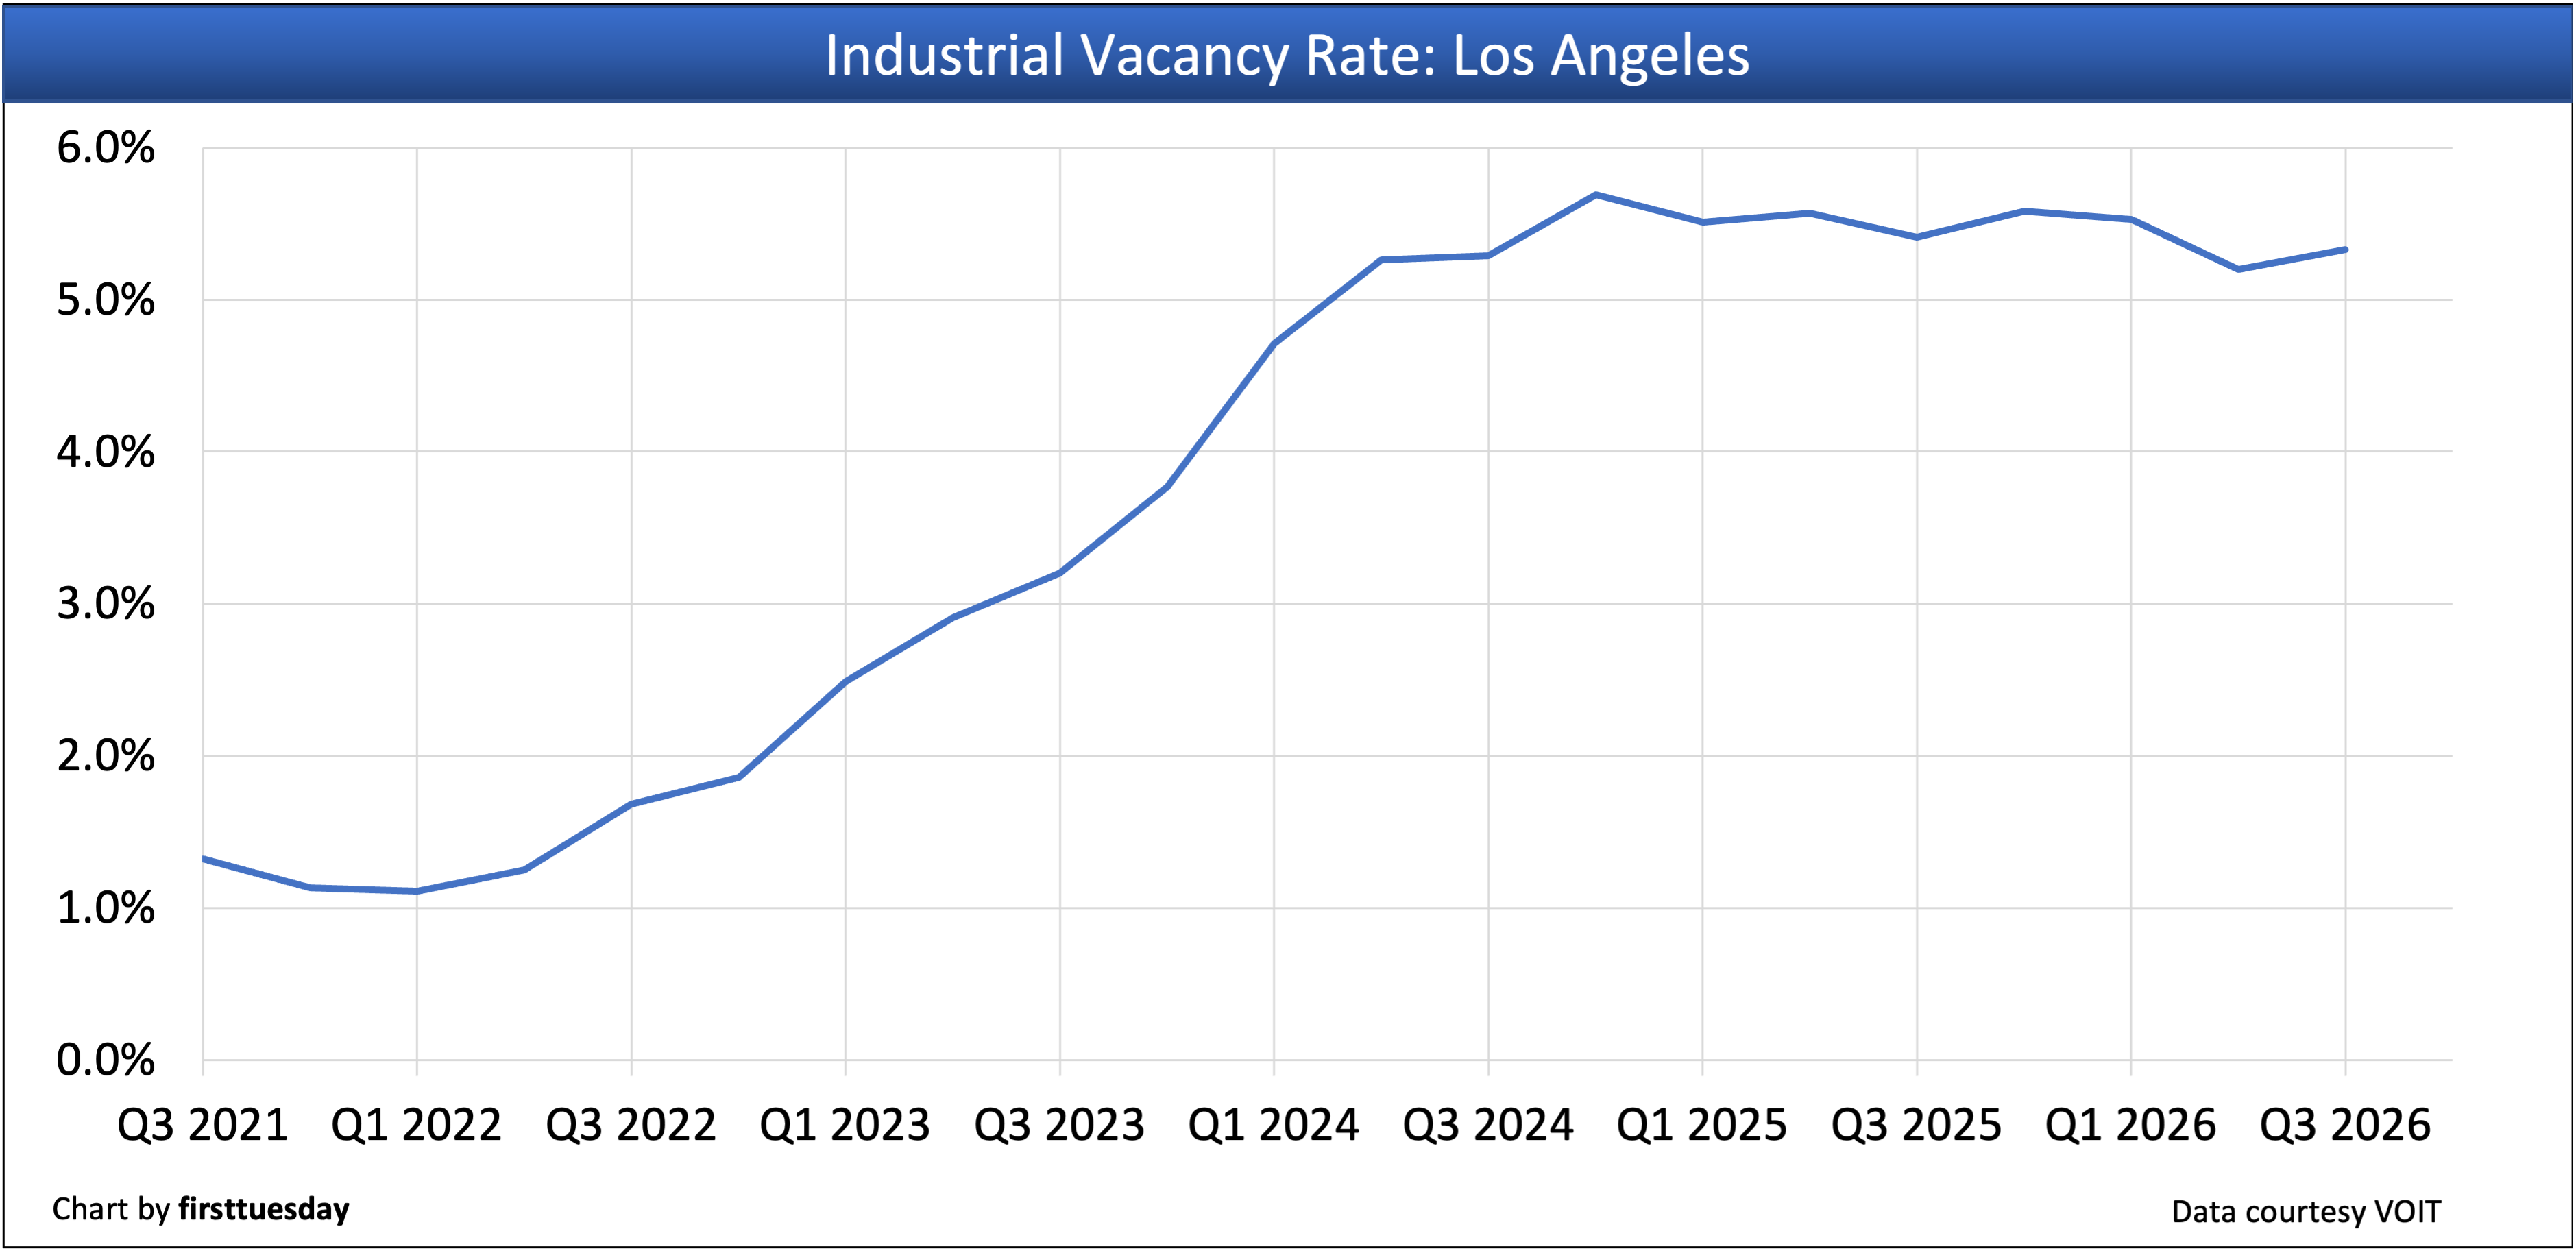
Los Angeles County’s industrial vacancy rate is:
- 5.33% in Q3 2026;
- up from 5.20% in Q2 2026; and
- down from 5.41% in Q3 2025.
Conclusion: Vacancy rose in Q3 2026 in response to new construction and more move-outs than move-ins.
Los Angeles County’s industrial net absorption rate is:
- -526,709 square feet in Q3 2026;
- down significantly from +2,798,764 square feet in Q2 2026; and
- down significantly from +2,122,617 square feet in Q3 2025.
Conclusion: Though negative in Q3 2026, net absorption year-to-date is positive with 2.8 million square feet.
Inland Empire — industrial
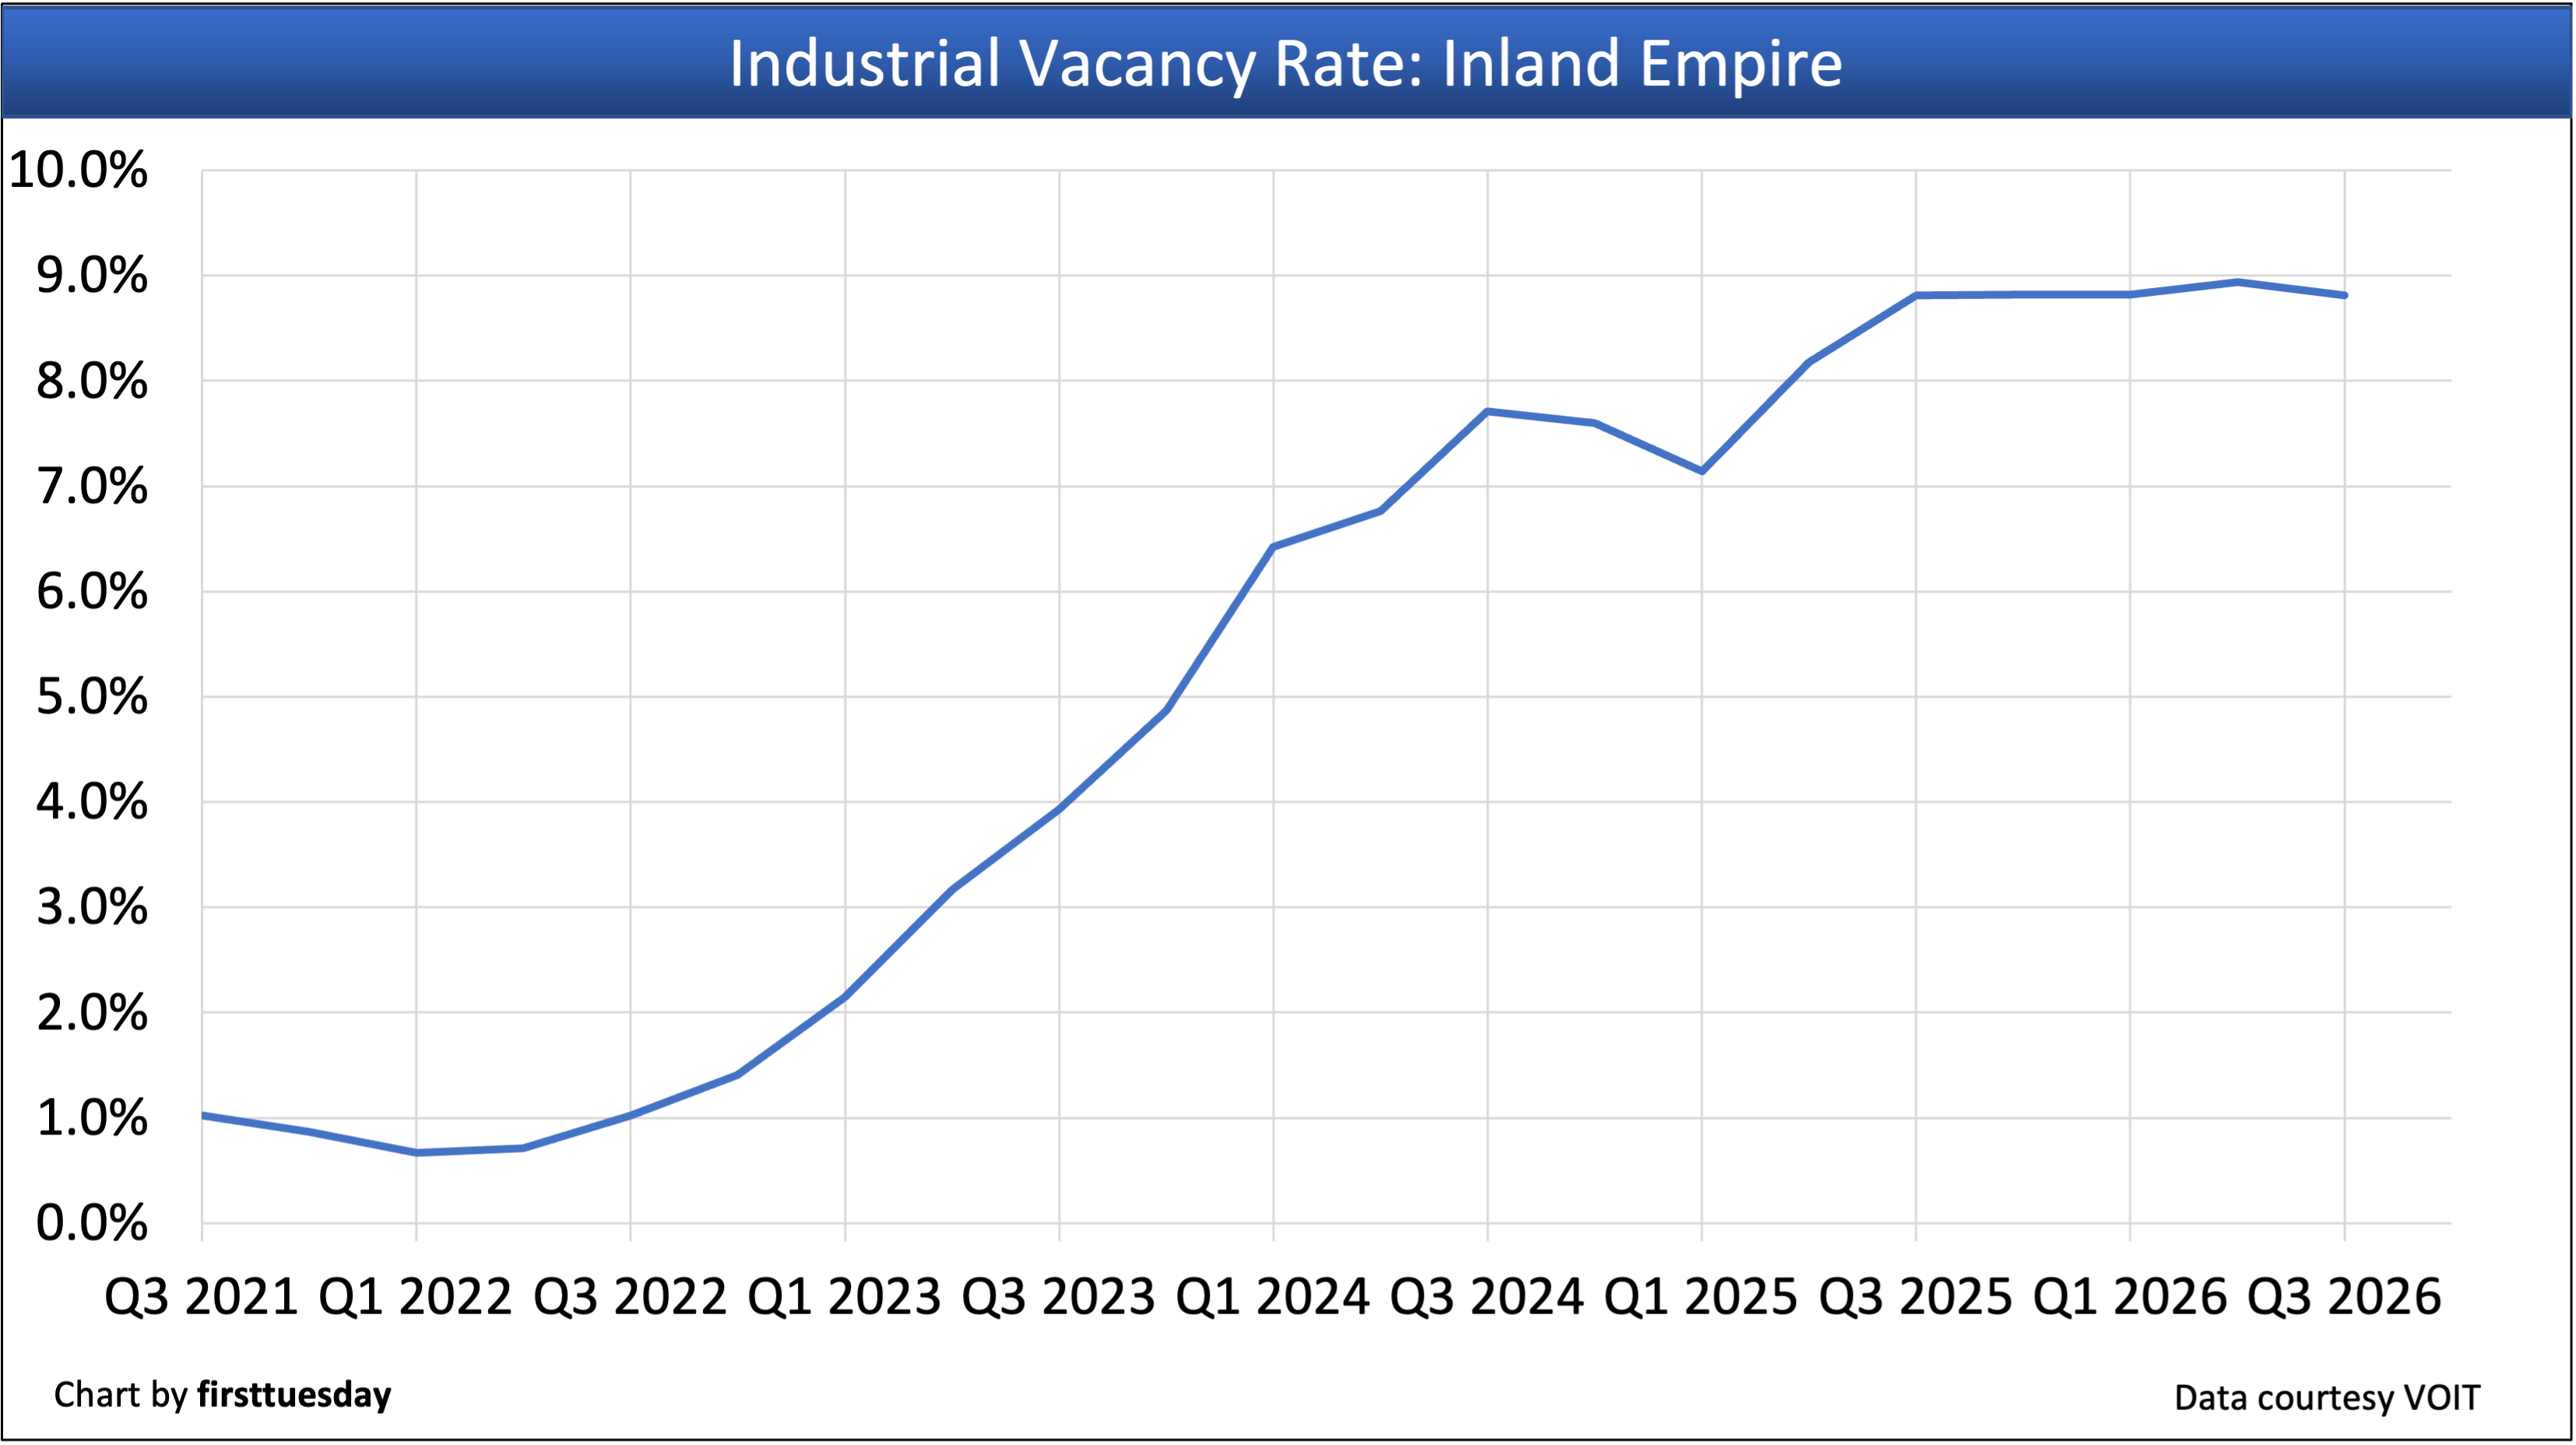
The Inland Empire’s industrial vacancy rate is:
- 8.81% in Q3 2026;
- down from 9.21% in Q2 2026; and
- down from 8.97% in Q3 2025.
Conclusion: Vacancies are elevated and new construction is low to level out the supply-demand imbalance for Inland Empire industrial real estate.
The Inland Empire’s industrial net absorption rate is:
- +3,208,934 square feet in Q3 2026;
- up significantly from -2,572,415 square feet in Q2 2026; and
- up significantly from -873,976 square feet in Q3 2025.
Conclusion: After consecutive quarters of negative net absorption, a strong rebound in Q3 2026 brought 2026 net absorption into positive territory at 1.2 million square feet.
Related articles: