
Why this matters: Vacancy and net absorption rates for the Southern California commercial property market worsened for most sectors. The two which have flattened, not forming a peak, were due to one-off construction events of completions and repurposing activity.
The third quarter (Q3) 2025 reports on the Southern California (SoCal) commercial property market are in, courtesy of VOIT Real Estate Services.
SoCal’s commercial market — comprised of San Diego, Orange County, Los Angeles and the Inland Empire — have continued to weaken since the 2020 pandemic period.
More recently, in 2025, chaotic national and global trade and migration policies led to uncertainty for participants in real estate transactions. Tenant demand for additional space is down, a trend taking a wait-and-see approach.
Industrial vacancy rates in 2025 have risen year-over in all SoCal counties, Los Angeles experiencing a slight one-off increase. Industrial real estate in SoCal is in a period of constantly increasing vacancies year-to-year since 2022, with no change in the trend for the foreseeable future.
Office vacancy rates are severely elevated while rising in San Diego County, but holding flat in Orange County due solely to conversions permanently removing office space from the market. New laws mandating permits for conversions of buildings to housing be issued solely by administrative approval based on preemptive state zoning codes intend to encourage a quicker pace of conversion to housing.
Meanwhile, retail operators in San Diego tend to close rather than open as recessionary and other suppressive economic conditions creep in to increase vacancy rates.
Read on to get a more nuanced picture of the SoCal commercial market.
San Diego County — industrial, office and retail
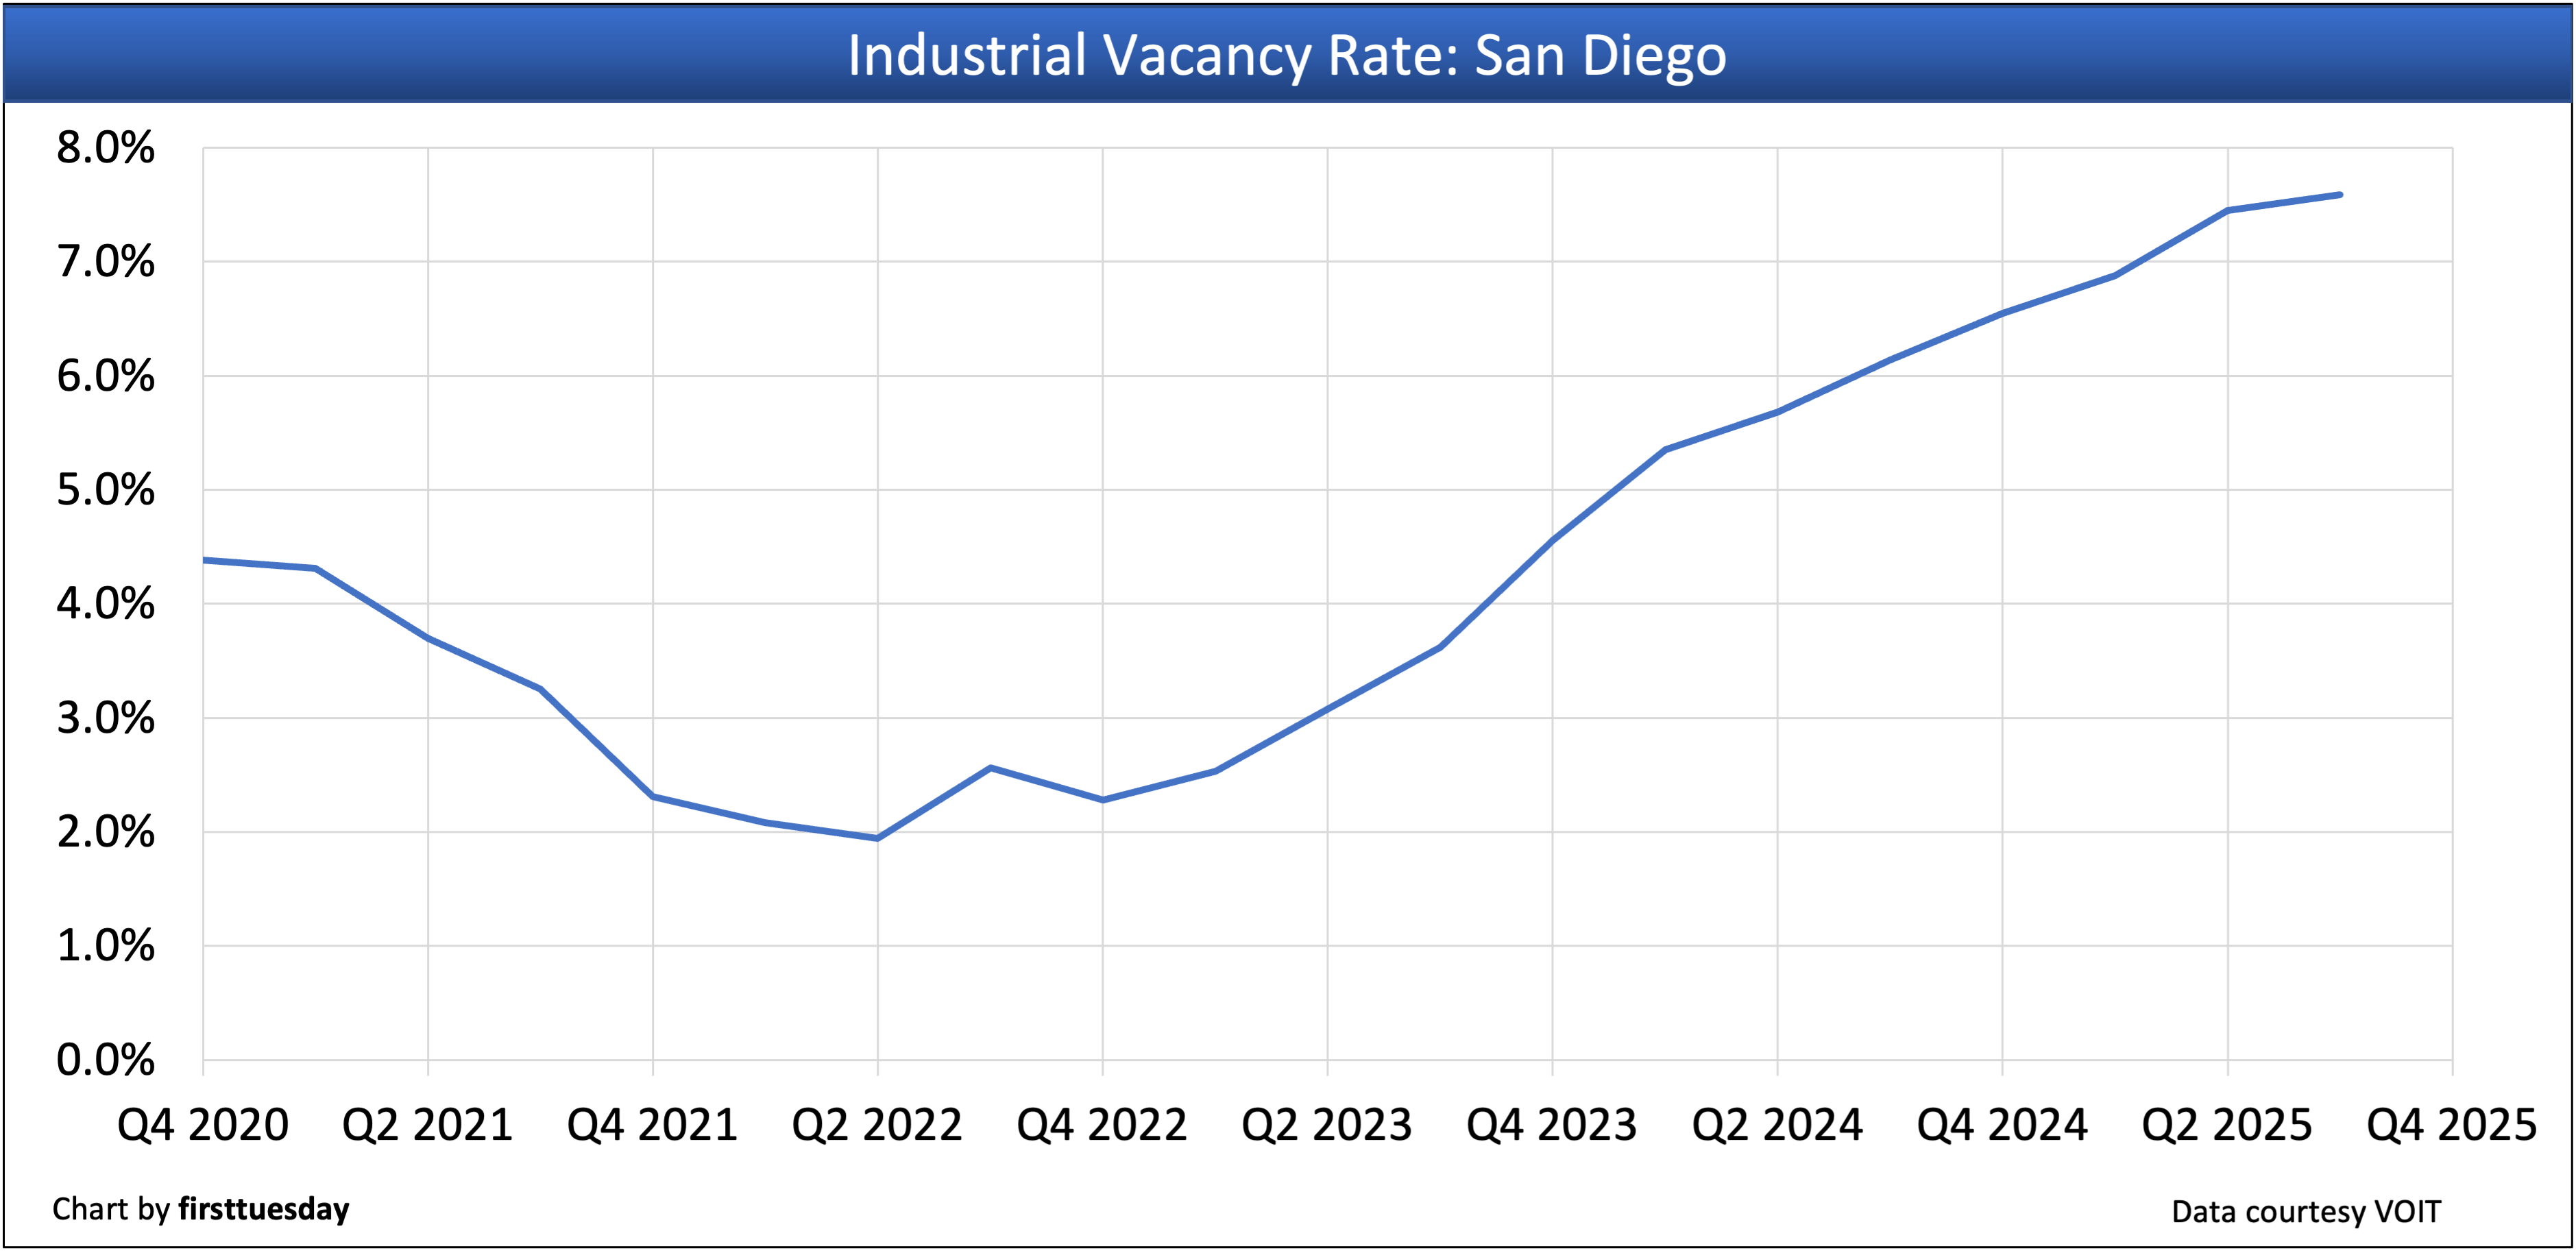
San Diego County’s industrial vacancy rate is:
- 7.59% in Q3 2025;
- up from 7.34% in Q2 2025; and
- up sharply from 5.91% in Q3 2024.
Conclusion: The San Diego industrial vacancy rate continues to increase. The vacancy rate has tripled since 2022 with no sign the pace of increase is ebbing.
San Diego’s industrial net absorption rate — the total change in occupied industrial space during the quarter — is:
- -283,871 square feet in Q3 2025;
- up from -804,382 square feet in Q2 2025; and
- down from -145,088 square feet in Q3 2024.
Conclusion: The current occupancy trend continues to weaken with three consecutive years of negative net absorption with no sign of abatement. The last time San Diego industrial experienced consecutive years of negative net absorption was 2008-2009, further indication of today’s undeclared real estate recession.
San Diego County’s office vacancy rate is:
- 14.23% in Q3 2025;
- up from 14.03% in Q2 2025; and
- up steadily from 12.44% in Q3 2024.
Conclusion: Three consecutive years of vacancy rate increases and a vacancy rate approaching 15% signals a continuing degrading in the San Diego office market.
San Diego County’s office net absorption rate — the total change in occupied office space during the quarter — is:
- -222,683 square feet in Q3 2025;
- less decline than -376,685 square feet in Q2 2025; and
- down year-over from +158,758 square feet in Q3 2024.
Conclusion: Anticipate a continuing decline in occupancy until the San Diego office sector fully adjusts to the greatly reduced need for employee workspace and additional conversion of office buildings to housing.
San Diego County’s retail vacancy rate is:
- 4.50% in Q3 2025;
- up from 4.37% in Q2 2025; and
- up from 4.14% in Q3 2024.
Conclusion: Expect store closures amid worsening recessionary conditions with vacancies piling up for lack of business expansion and job creation.
San Diego County’s retail net absorption rate — the total change in occupied retail space during the quarter — is:
- -159,387 in Q3 2025;
- up from -202,502 in Q2 2025; and
- down from +92,750 in Q3 2024.
Conclusion: The net absorption trend since 2017 in San Diego was mostly negative and will continue negative for the next few years of consumer retreat.
Orange County — industrial and office
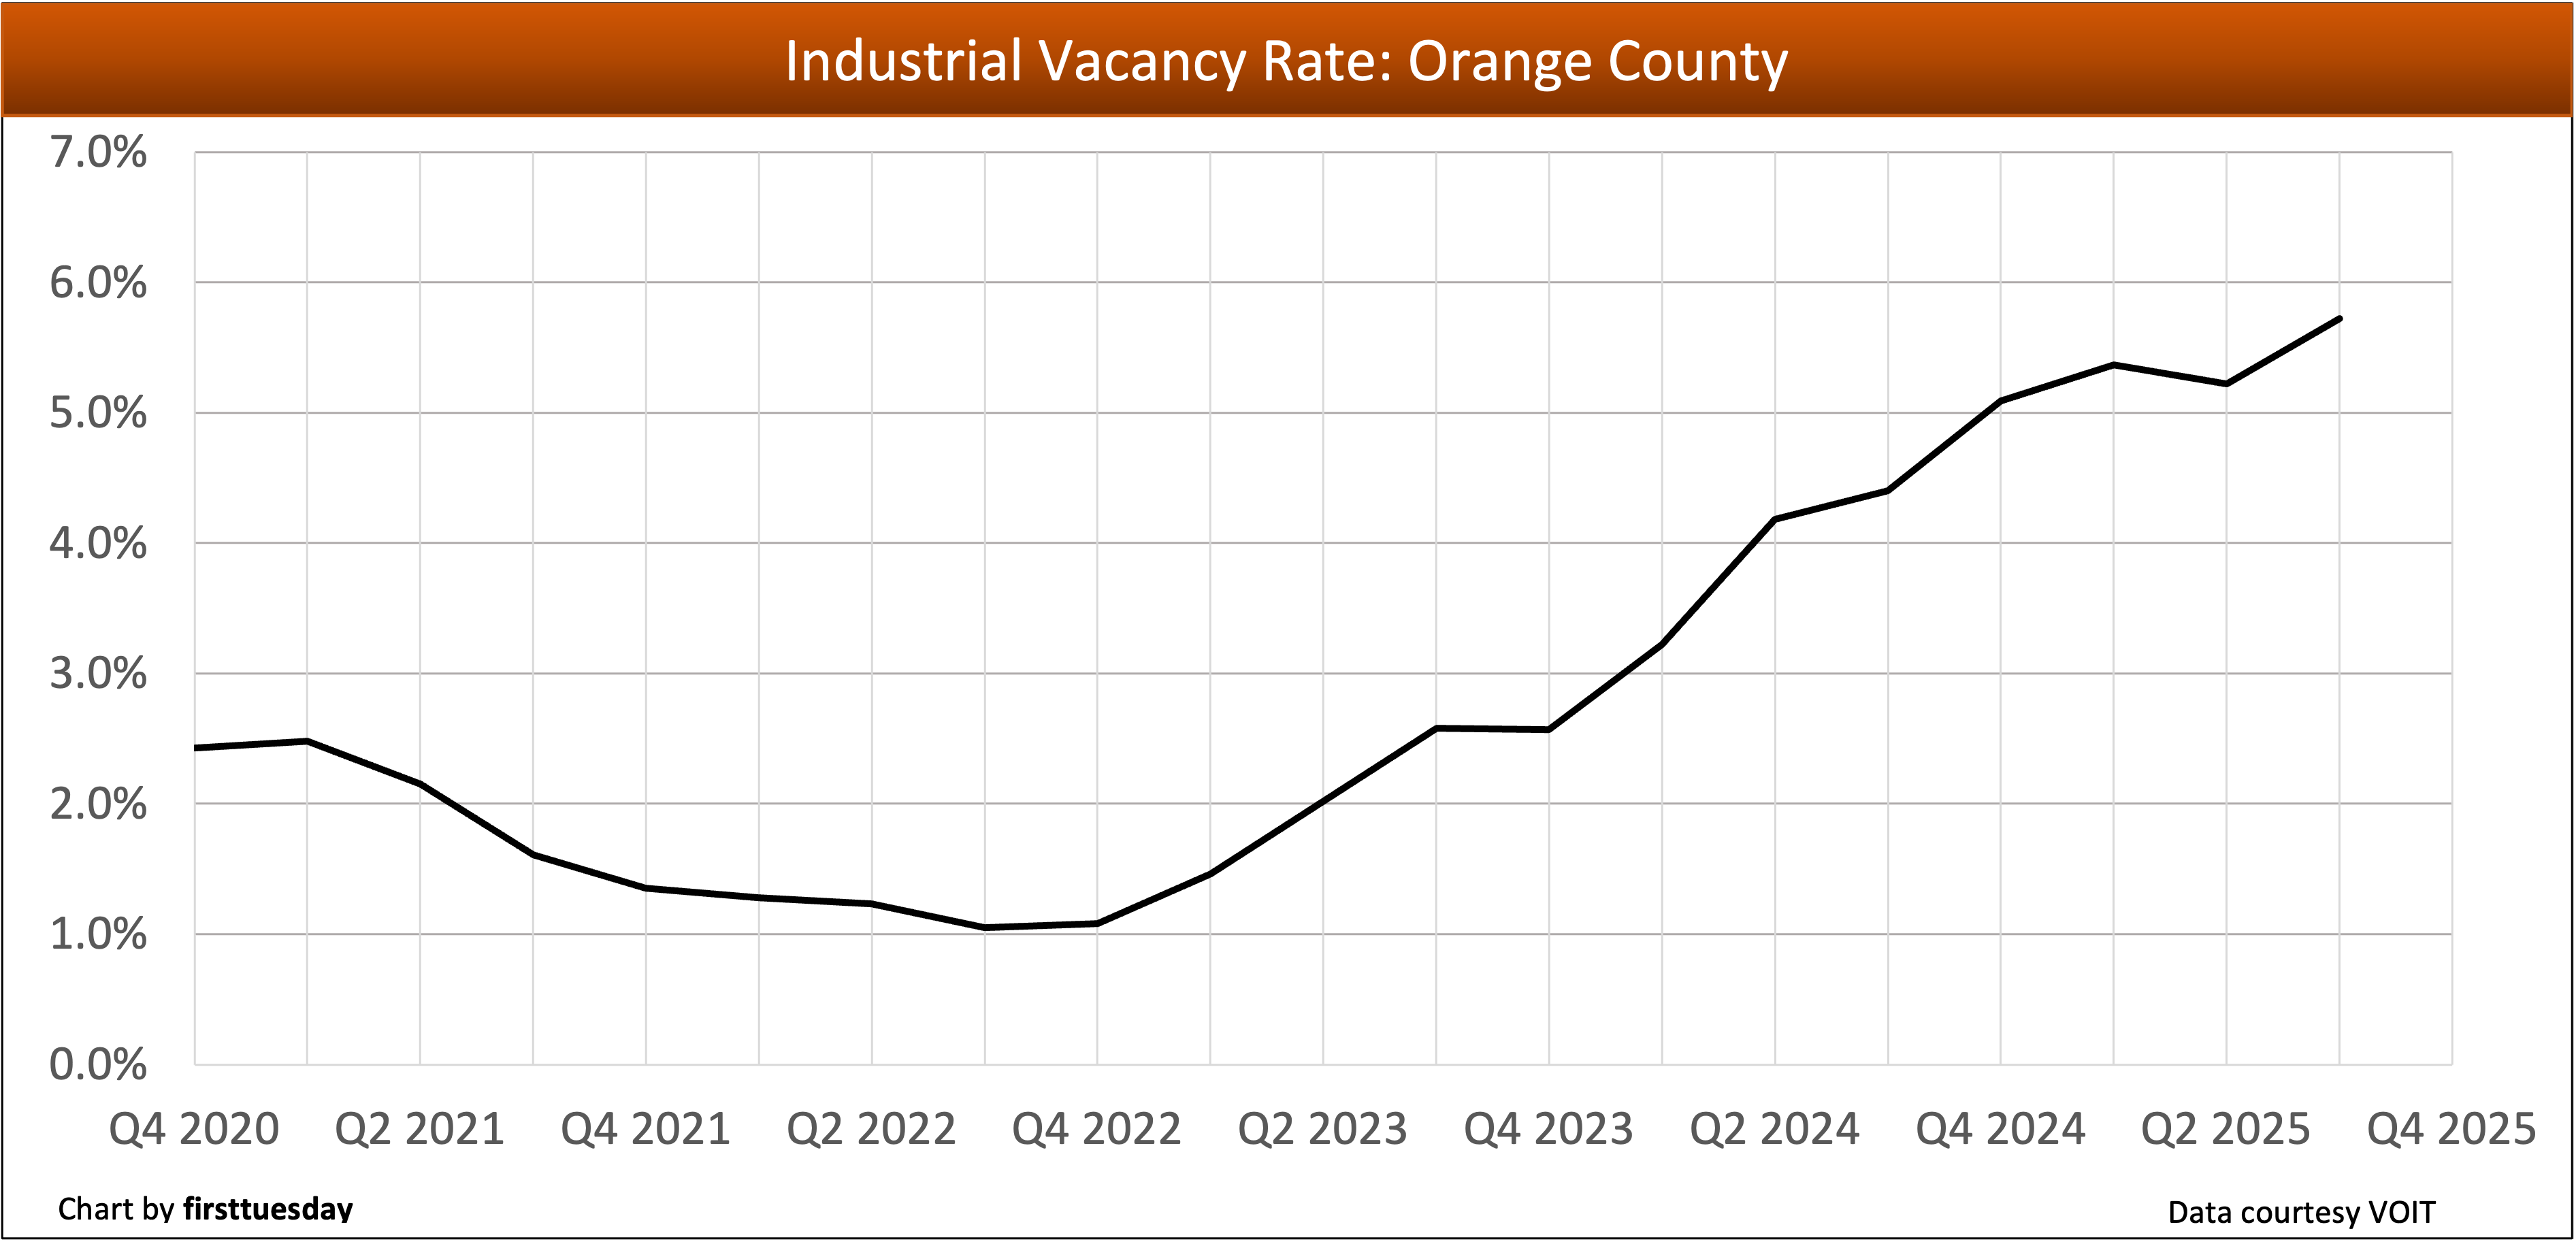
Orange County’s industrial vacancy rate is:
- 5.72% in Q3 2025;
- up from 5.19% in Q2 2025; and
- up significantly from 4.40% in Q3 2024.
Conclusion: Orange County industrial vacancy rates after bottoming in 2022 is quickly trending above normal turnover rates due primarily to lesser priced rents in neighboring counties and reduced imports.
Orange County’s industrial net absorption rate is:
- -612,876 square feet in Q3 2025;
- down from +336,362 square feet in Q2 2025; and
- down from -481,755 square feet in Q3 2024.
Conclusion: Orange County industrial absorption was negative in 2024 and remained deeply negative in 2025, an accumulation portending significant rent reduction for several years of stubborn adjustment.
Orange County’s office vacancy rate is:
- 15.16% in Q3 2025;
- down from 15.79% in Q2 2025; and
- down from 16.10% in Q3 2024.
Conclusion: As vacant office buildings continue to be repurposed as housing, the vacancy rate will continue to decline even as businesses retain less office space.
Orange County’s office net absorption rate is:
- +415,296 square feet in Q3 2025;
- up from -277,724 square feet in Q2 2025; and
- up from +33,181 square feet in Q3 2024.
Conclusion: After three consecutive quarters of negative absorption, the rate turned positive this quarter, driven primarily by office conversions repurposing vacant buildings.
Los Angeles County — industrial
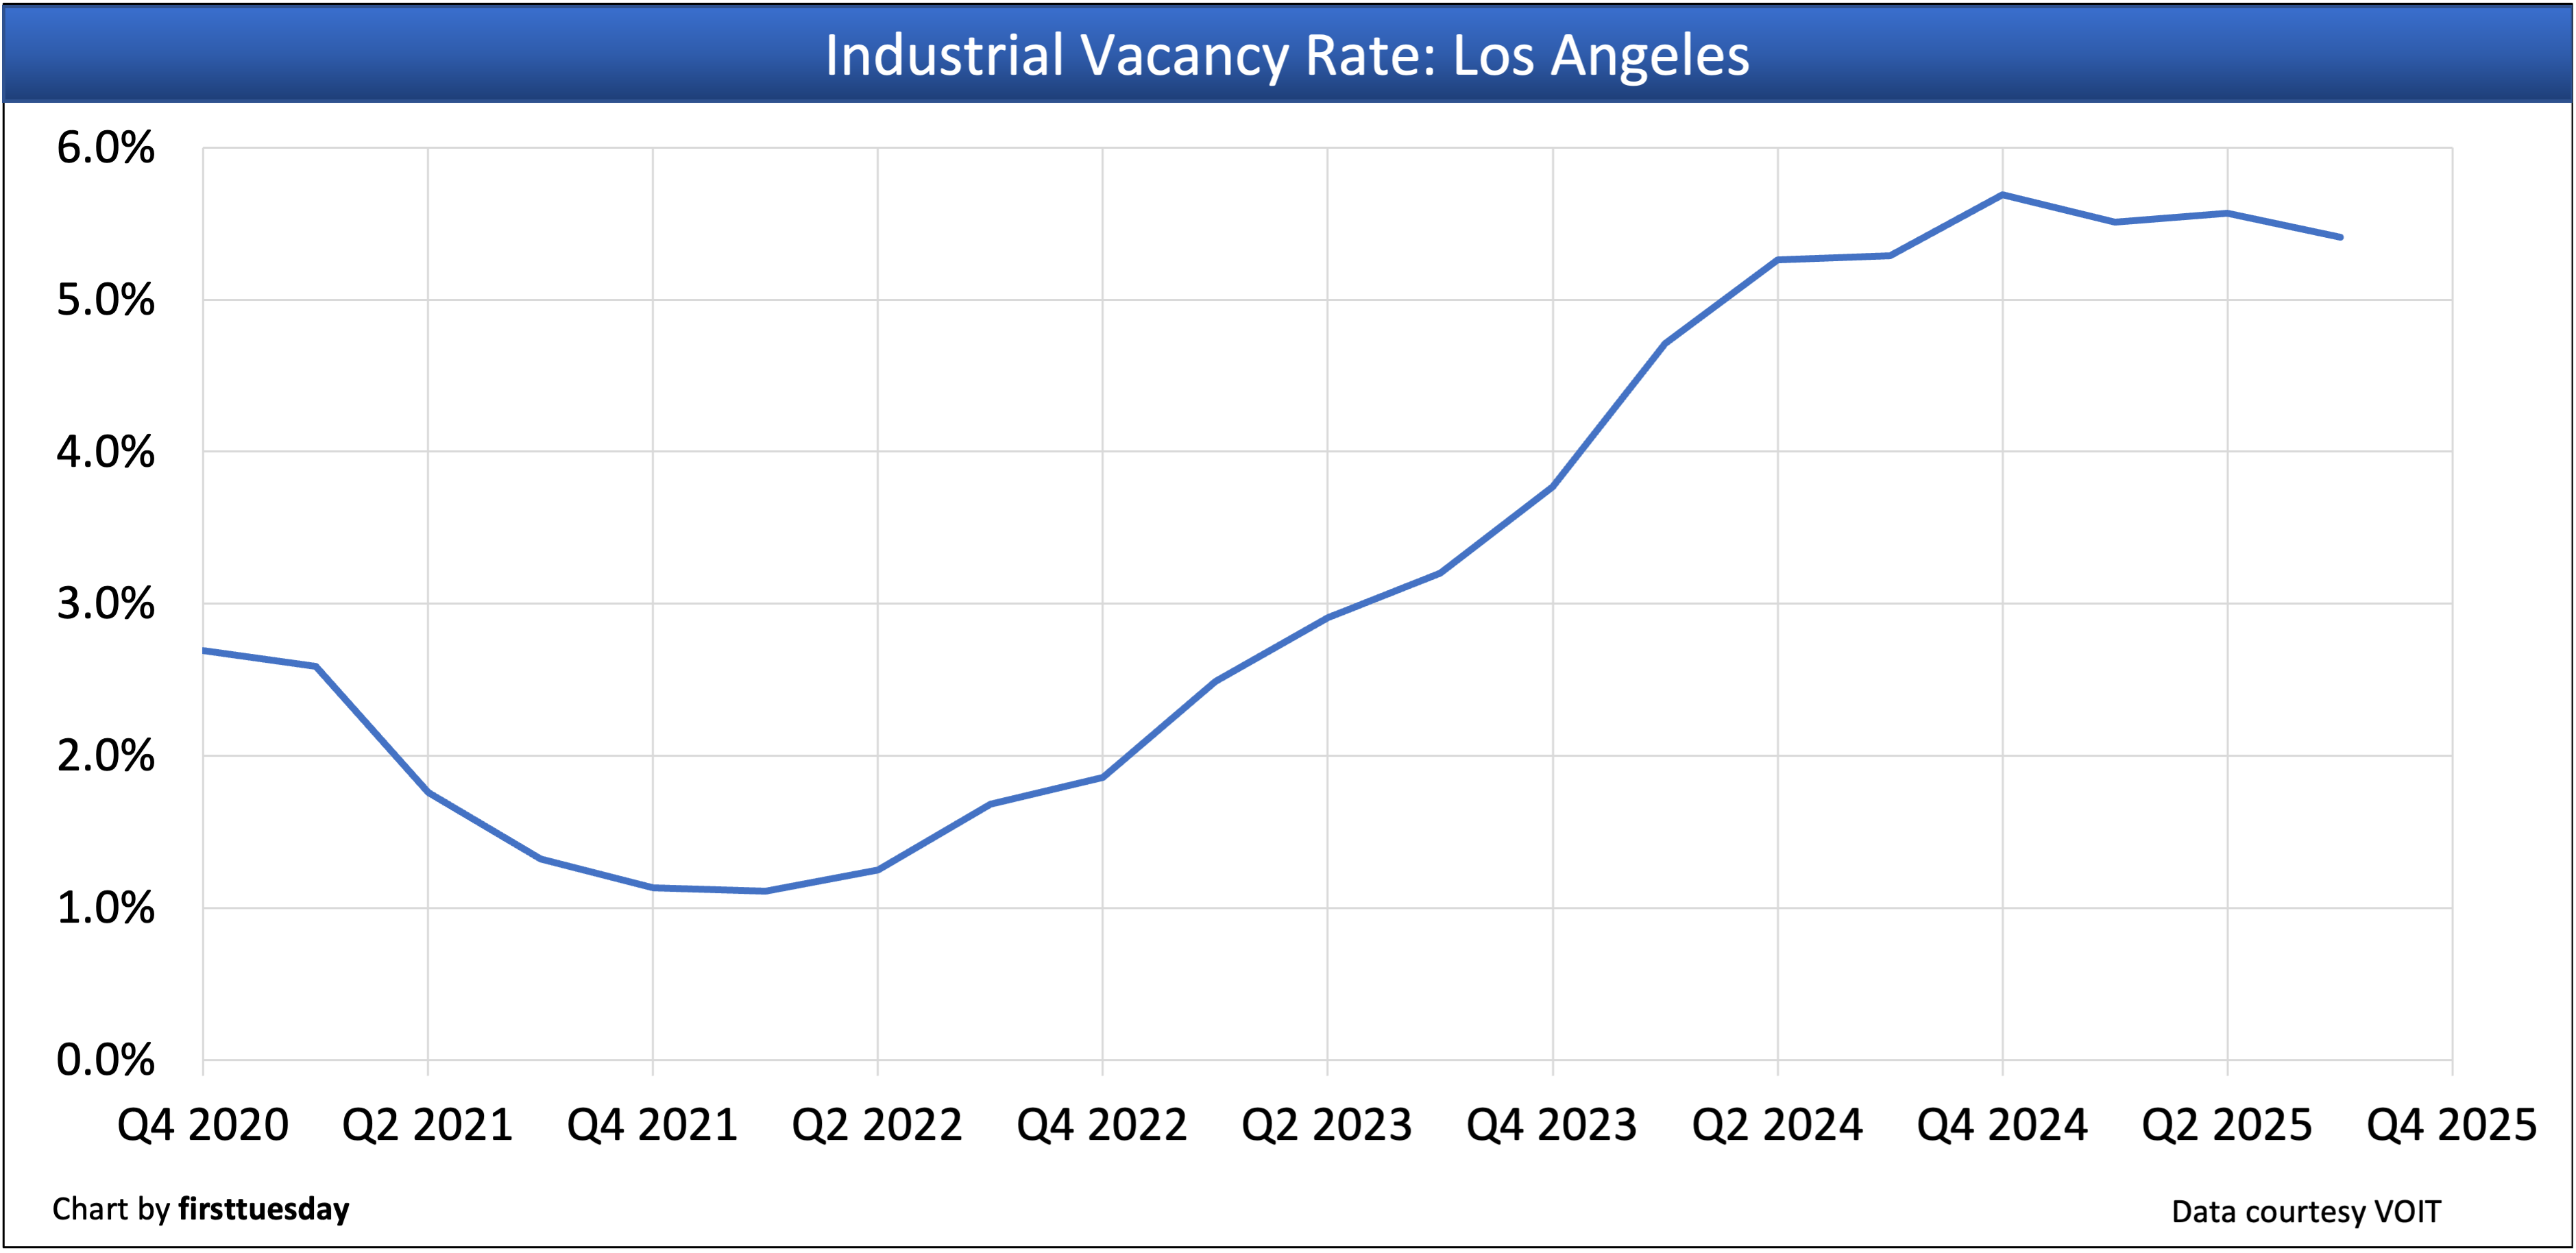
Los Angeles County’s industrial vacancy rate is:
- 5.41% in Q3 2025;
- down from 5.57% in Q2 2025; and
- up from 5.29% in Q3 2024.
Conclusion: The industrial vacancy rate in Los Angeles has settled into a plateau trend. This bucks the steady rise in vacancies in neighboring counties. Going forward, global and local economic conditions suggest an increase in the Los Angeles industrial vacancy rate.
Los Angeles County’s industrial net absorption rate is:
- +2,122,617 square feet in Q3 2025;
- up drastically from -766,211 square feet in Q2 2025; and
- up significantly from -778,339 square feet in Q3 2024.
Conclusion: Several large development projects contributed to the significant growth in Los Angeles’ industrial net absorption rate this past quarter.
Inland Empire — industrial
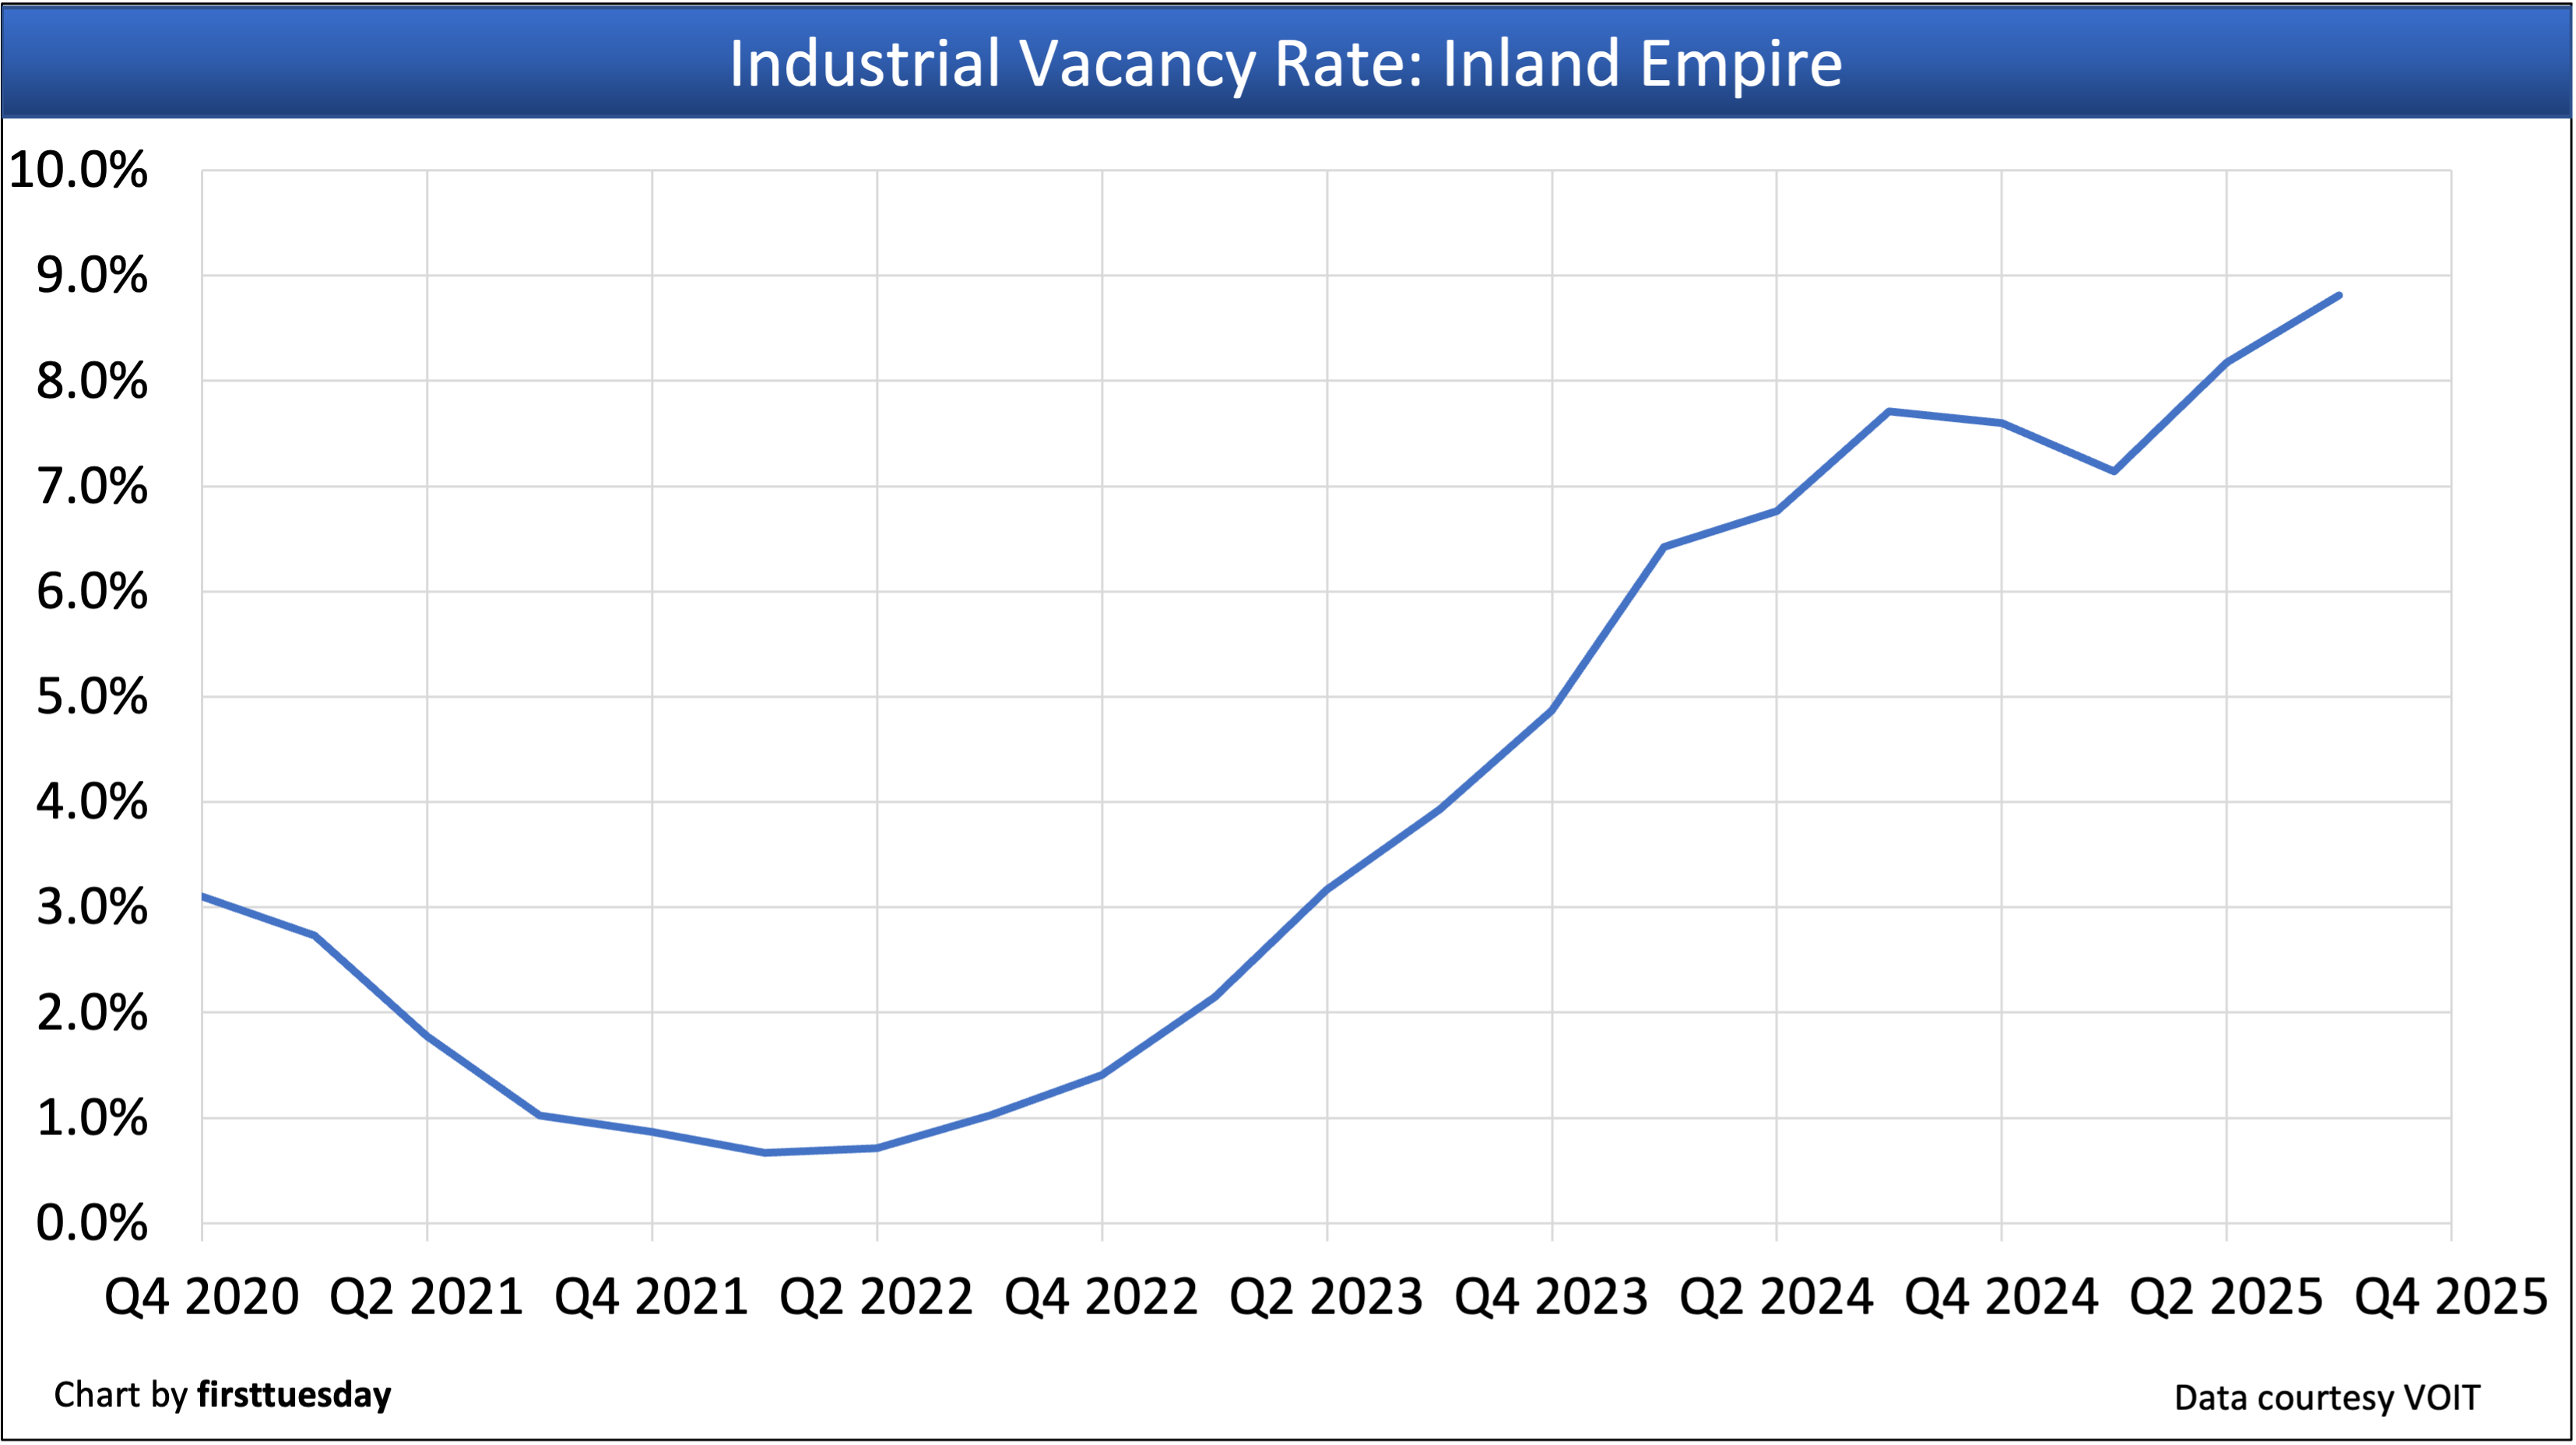
The Inland Empire’s industrial vacancy rate is:
- 8.81% in Q3 2025;
- up from 7.96% in Q2 2025; and
- up from 8.03% in Q3 2024.
Conclusion: Vacancies are trending slowly but steadily upward for Inland Empire industrial real estate, partly due to new additions to the supply.
The Inland Empire’s industrial net absorption rate is:
- -743,803 square feet in Q3 2025;
- up from -2,309,757 square feet in Q2 2025; and
- down from -40,980 square feet in Q3 2024.
Conclusion: The uncertainly surrounding global trade and migrant worker policies are the forces now driving the need for industrial real estate and likely to cause reduced absorption of square footage.
Related articles:
SoCal’s commercial property market struggles to find tenants — Q2 2025


I agree with the author