
Why this matters: The Southern California (SoCal) commercial property market struggles to recover from economic, trade and geopolitical uncertainties that make long-term leasing decisions less attractive for qualified tenants, leaving commercial property languishing — but there are some areas of improvement.
Landlords lean into brokers for assistance
The second quarter (Q2) 2026 reports on the Southern California (SoCal) commercial property market are in, courtesy of VOIT Real Estate Services.
SoCal’s commercial market, comprised of San Diego, Orange County, Los Angeles and the Inland Empire, continues to struggle to retain tenants as tenants endeavor to remain solvent.
Landlords are left to decide whether to offer attractive concessions, reduce the asking rent (and by how much), improve the property with upgrades, or convert property to a different use.
To debate about these pricing decisions, landlords initially choose to hire a commercial real estate broker.
A commercial broker commits to working with a commercial landlord using a Landlord Representation Agreement form to hire a broker to locate a user seeking a leasehold interest in a property. [See RPI Form 106]
A landlord representation agreement is the leasing equivalent of a seller representation agreement for selling ownership of a property. [See RPI Form 102]
Industrial real estate, which during the past several years has remained the bright spot in the commercial property market, has met recent headwinds with abusive tariffs, endless trade disputes, and now growing fuel prices. Economic instability, foreign policy concerns, port and border closures, and inflationary pressures all contribute to a cautionary, wait-and-see tenant behavior.
Los Angeles industrial is seeing a recent upturn in occupancies, but it may take another couple of quarters to tell whether a reinvigoration persists. Read on to see how each SoCal region fares with their industrial property market.
Read on for a deeper analysis of the office and retail sectors as well.
San Diego County — industrial, office and retail
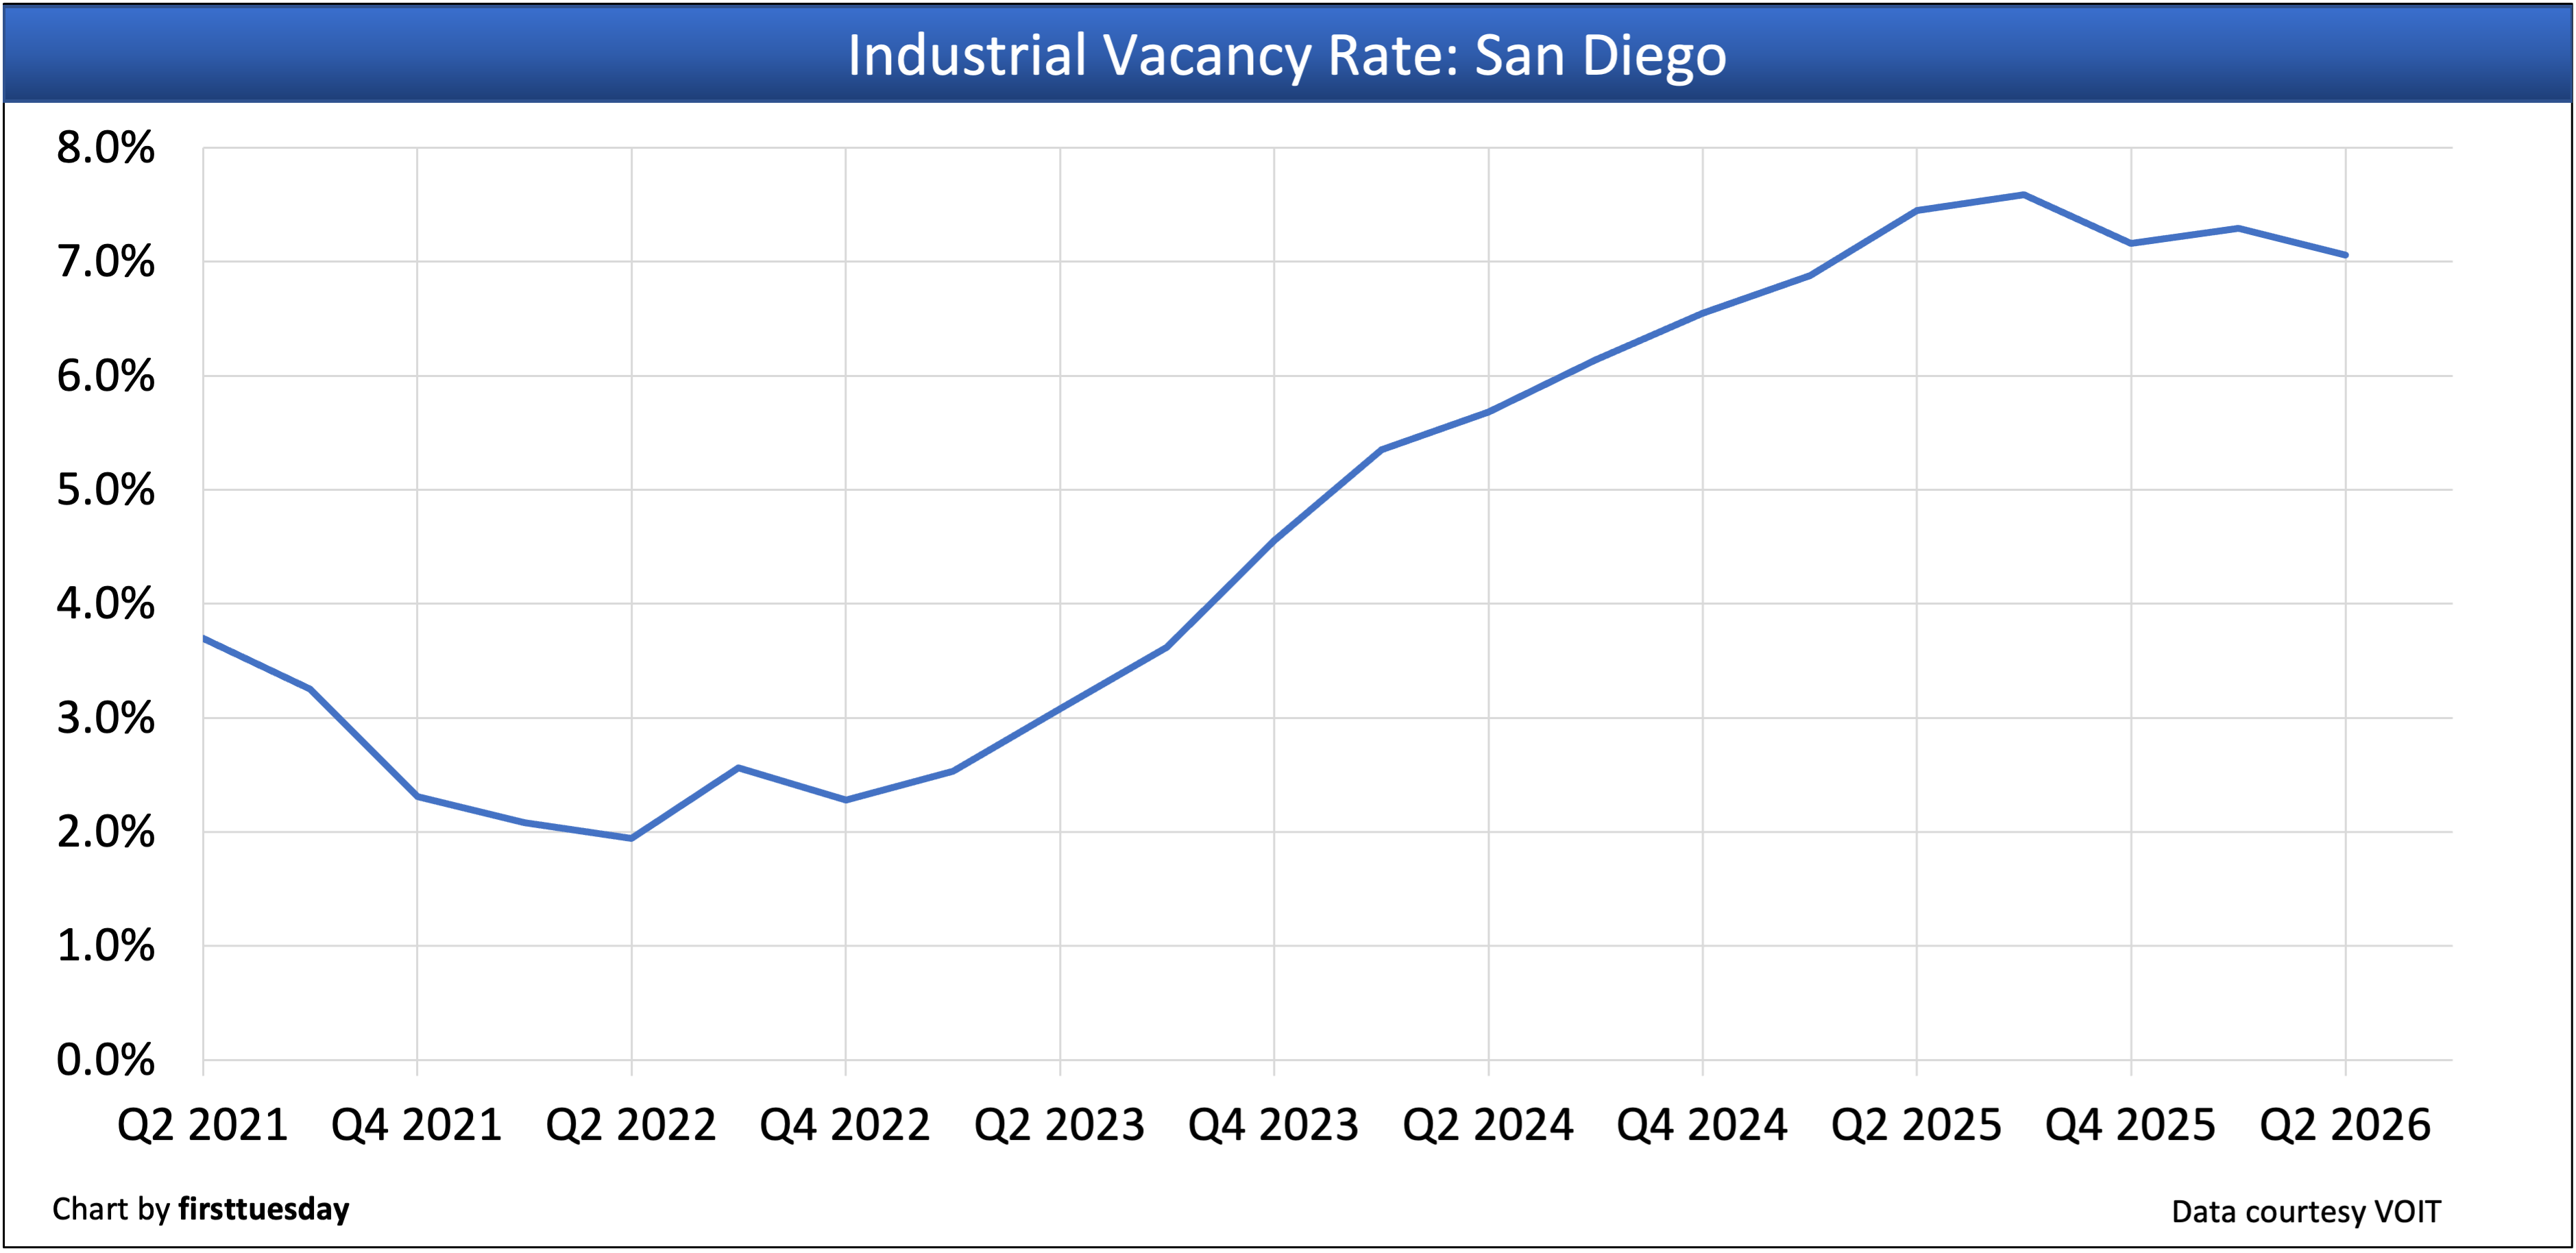
San Diego County’s industrial vacancy rate is:
- 7.06% in Q2 2026;
- up from 6.91% in Q1 2026; and
- up from 6.90% in Q2 2025.
Conclusion: The availability rate — which measures space available for lease, regardless of occupancy status — rose to 10.33% of the county’s total inventory. This is the highest level since 2014 and the cyclical occurrence of a recession has not yet occurred.
San Diego County’s industrial net absorption — the total change in occupied industrial space during the quarter — is:
- -236,119 square feet in Q2 2026;
- down significantly from +1,129,686 square feet in Q1 2026; and
- up from -686,919 square feet in Q2 2025.
Conclusion: Industrial net absorption is back down into negative territory after a massive Amazon warehouse was completed in Q1 2026. The net absorption rate for the year is currently positive with 893,567 square feet. Without Amazon’s contribution, the net absorption would be negative for the year.
San Diego County’s office vacancy rate is:
- 13.40% of existing square feet in Q2 2026;
- flat from 13.45% of existing square feet in Q1 2026; and
- up slightly from 13.13% of existing square feet in Q2 2025.
Conclusion: San Diego office vacancy rates are flat quarter-over-quarter but has risen slightly year-over-year. The availability rate for Downtown San Diego is at an elevated 30%.
San Diego County’s office net absorption rate — the total change in occupied office space during the quarter — is:
- +10,513 square feet in Q2 2026;
- down from +41,945 square feet in Q1 2026; and
- up from -334,480 square feet in Q2 2025.
Conclusion: Subleasing has led to satisfying the demand for office space in San Diego.
San Diego County’s retail vacancy rate is:
- 4.59% of existing square feet in Q2 2026;
- down slightly from 4.64% of existing square feet in Q1 2026; and
- up from 4.42% of existing square feet in Q2 2025.
Conclusion: Obsolete retail properties across San Diego continue to be put to higher and better uses as retail operators meet financial challenges and shutter stores.
San Diego County’s retail net absorption rate — the total change in occupied retail space during the quarter — is:
- +93,856 square feet in Q2 2026;
- up from -199,589 square feet in Q1 2026; and
- up from -251,443 square feet in Q2 2025.
Conclusion: Despite the positive figure for Q2, 2026 remains negative thus far. There has only been one year with positive net absorption in the retail market since 2017.
Orange County — industrial and office
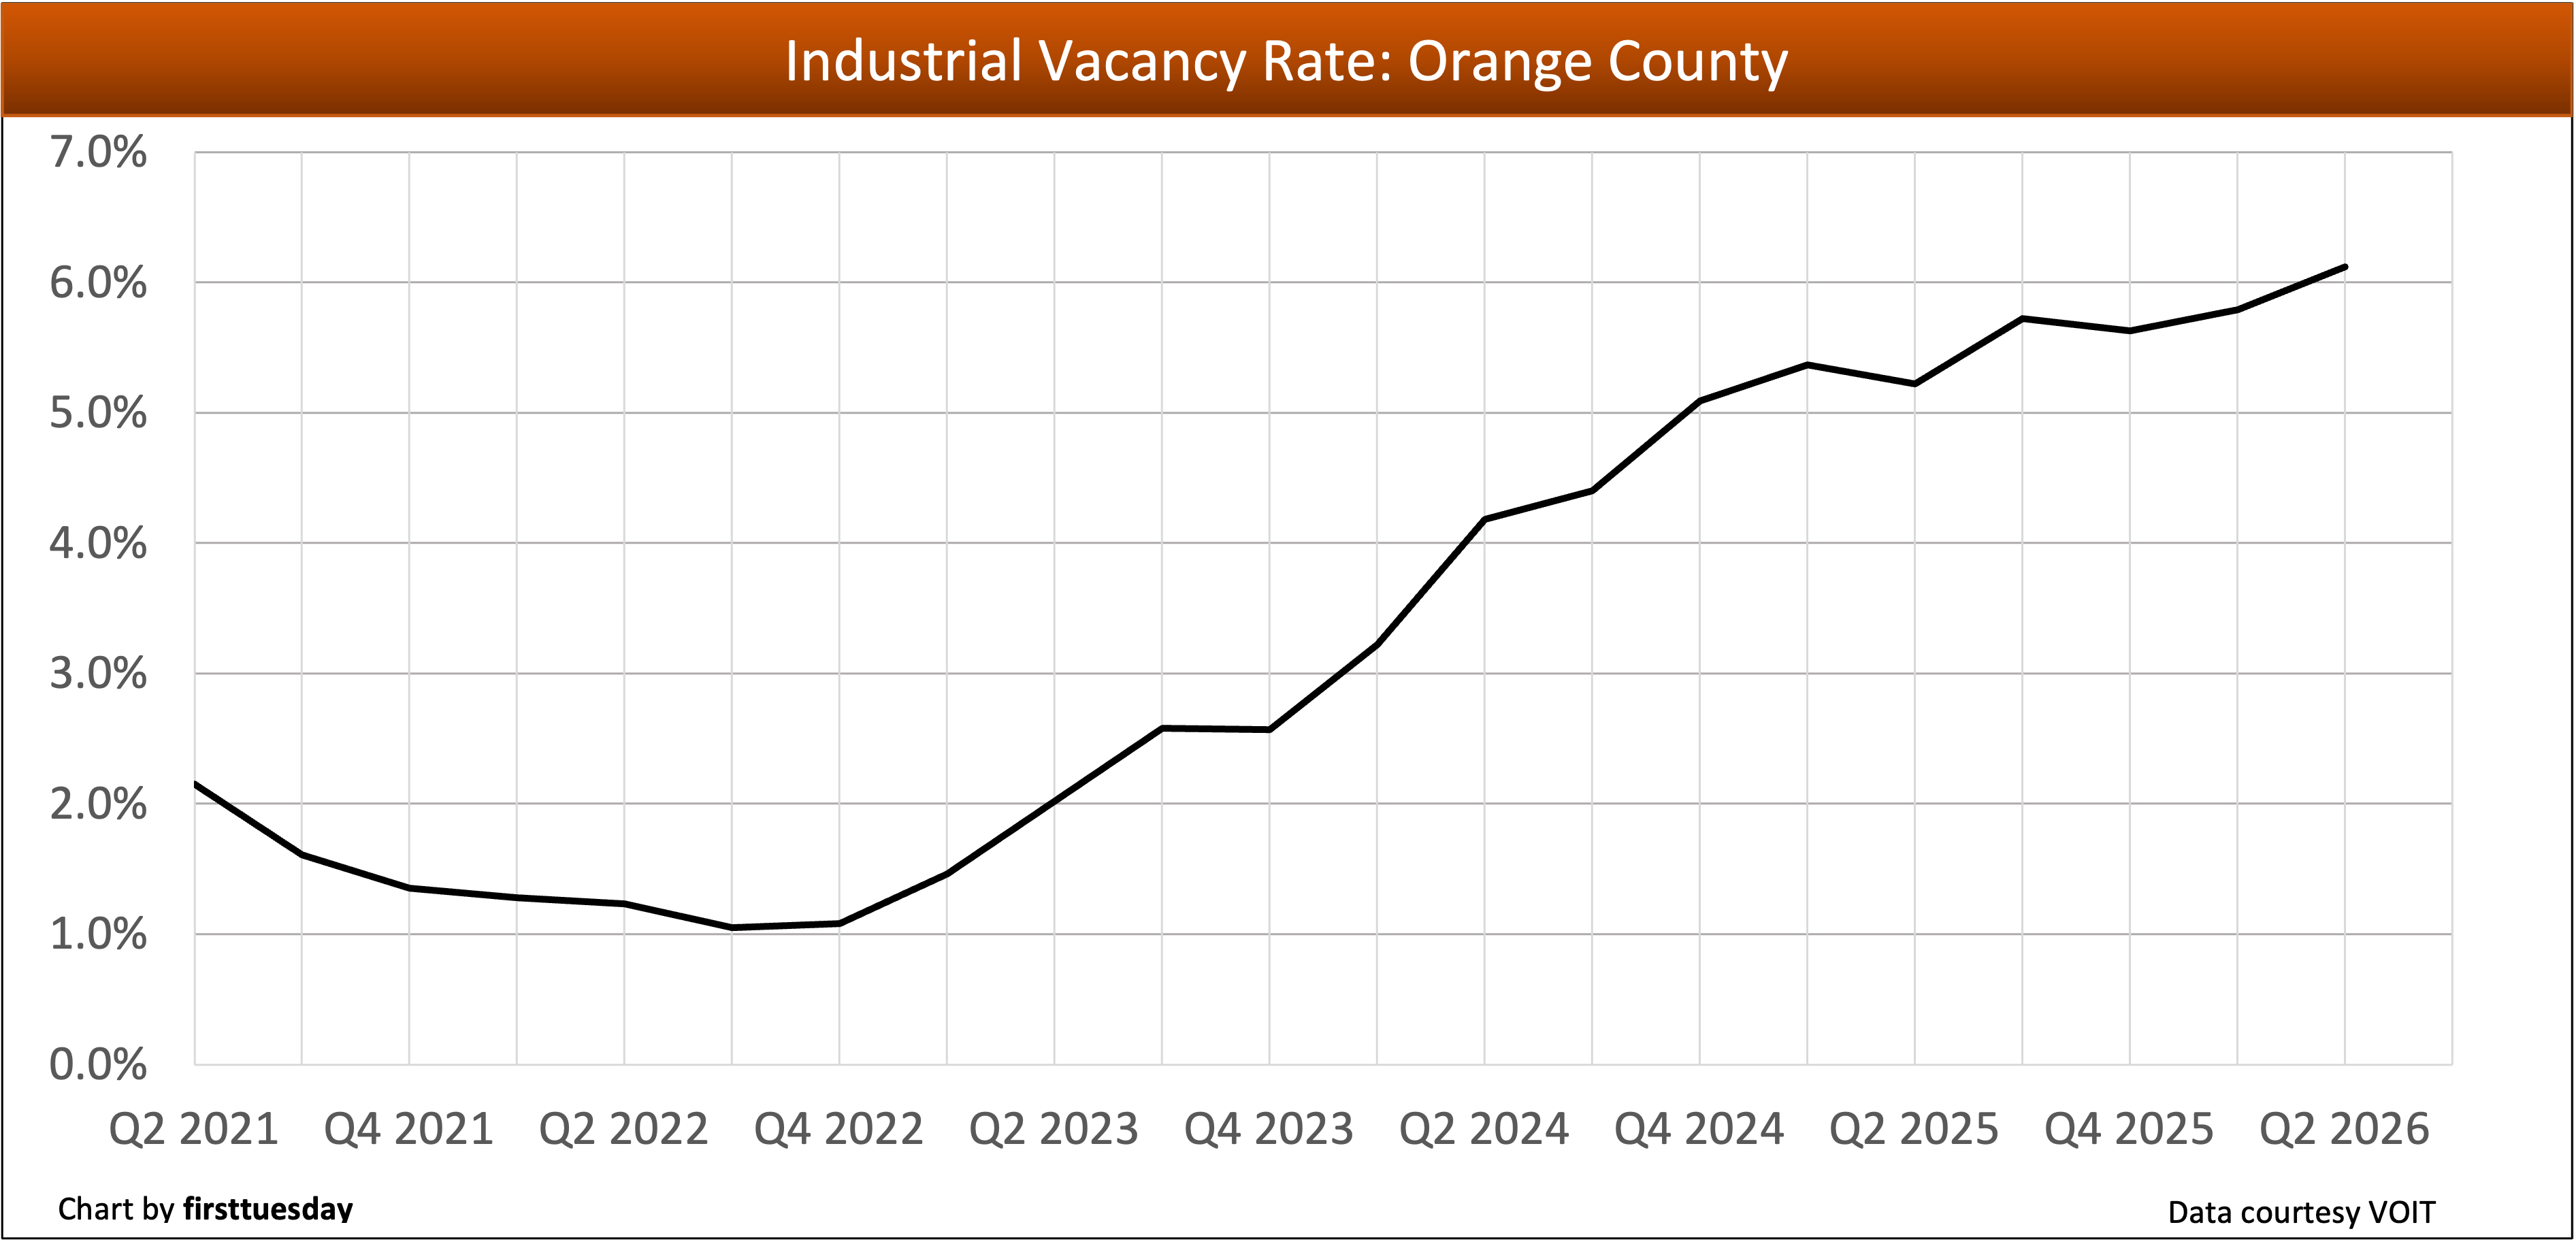
Orange County’s industrial vacancy rate is:
- 6.12% in Q2 2026;
- up from 5.79% in Q1 2026; and
- up from 5.19% square feet in Q2 2025.
Conclusion: At 6.12%, Orange County industrial vacancy rates sit at roughly twice its 10-year average of 2.98%.
Orange County’s industrial net absorption rate is:
- -237,674 square feet in Q2 2026;
- down from +531,781 square feet in Q1 2026; and
- down from +336,362 square feet in Q2 2025.
Conclusion: Large tenant move-outs accounted for the quarter’s negative absorption rate in Q2 2026.
Orange County’s office vacancy rate is:
- 13.03% in Q2 2026;
- down from 13.52% in Q1 2026; and
- down from 15.79% in Q2 2025.
Conclusion: Office-to-residential conversions have reversed the rising trend for Orange County’s elevated office vacancy rate.
Orange County’s office net absorption rate is:
- +308,223 square feet in Q2 2026;
- up from +292,601 square feet in Q1 2026; and
- up from -277,724 square feet in Q2 2025.
Conclusion: Demand is currently up for Orange County office, mainly driven by larger tenants.
Los Angeles County — industrial
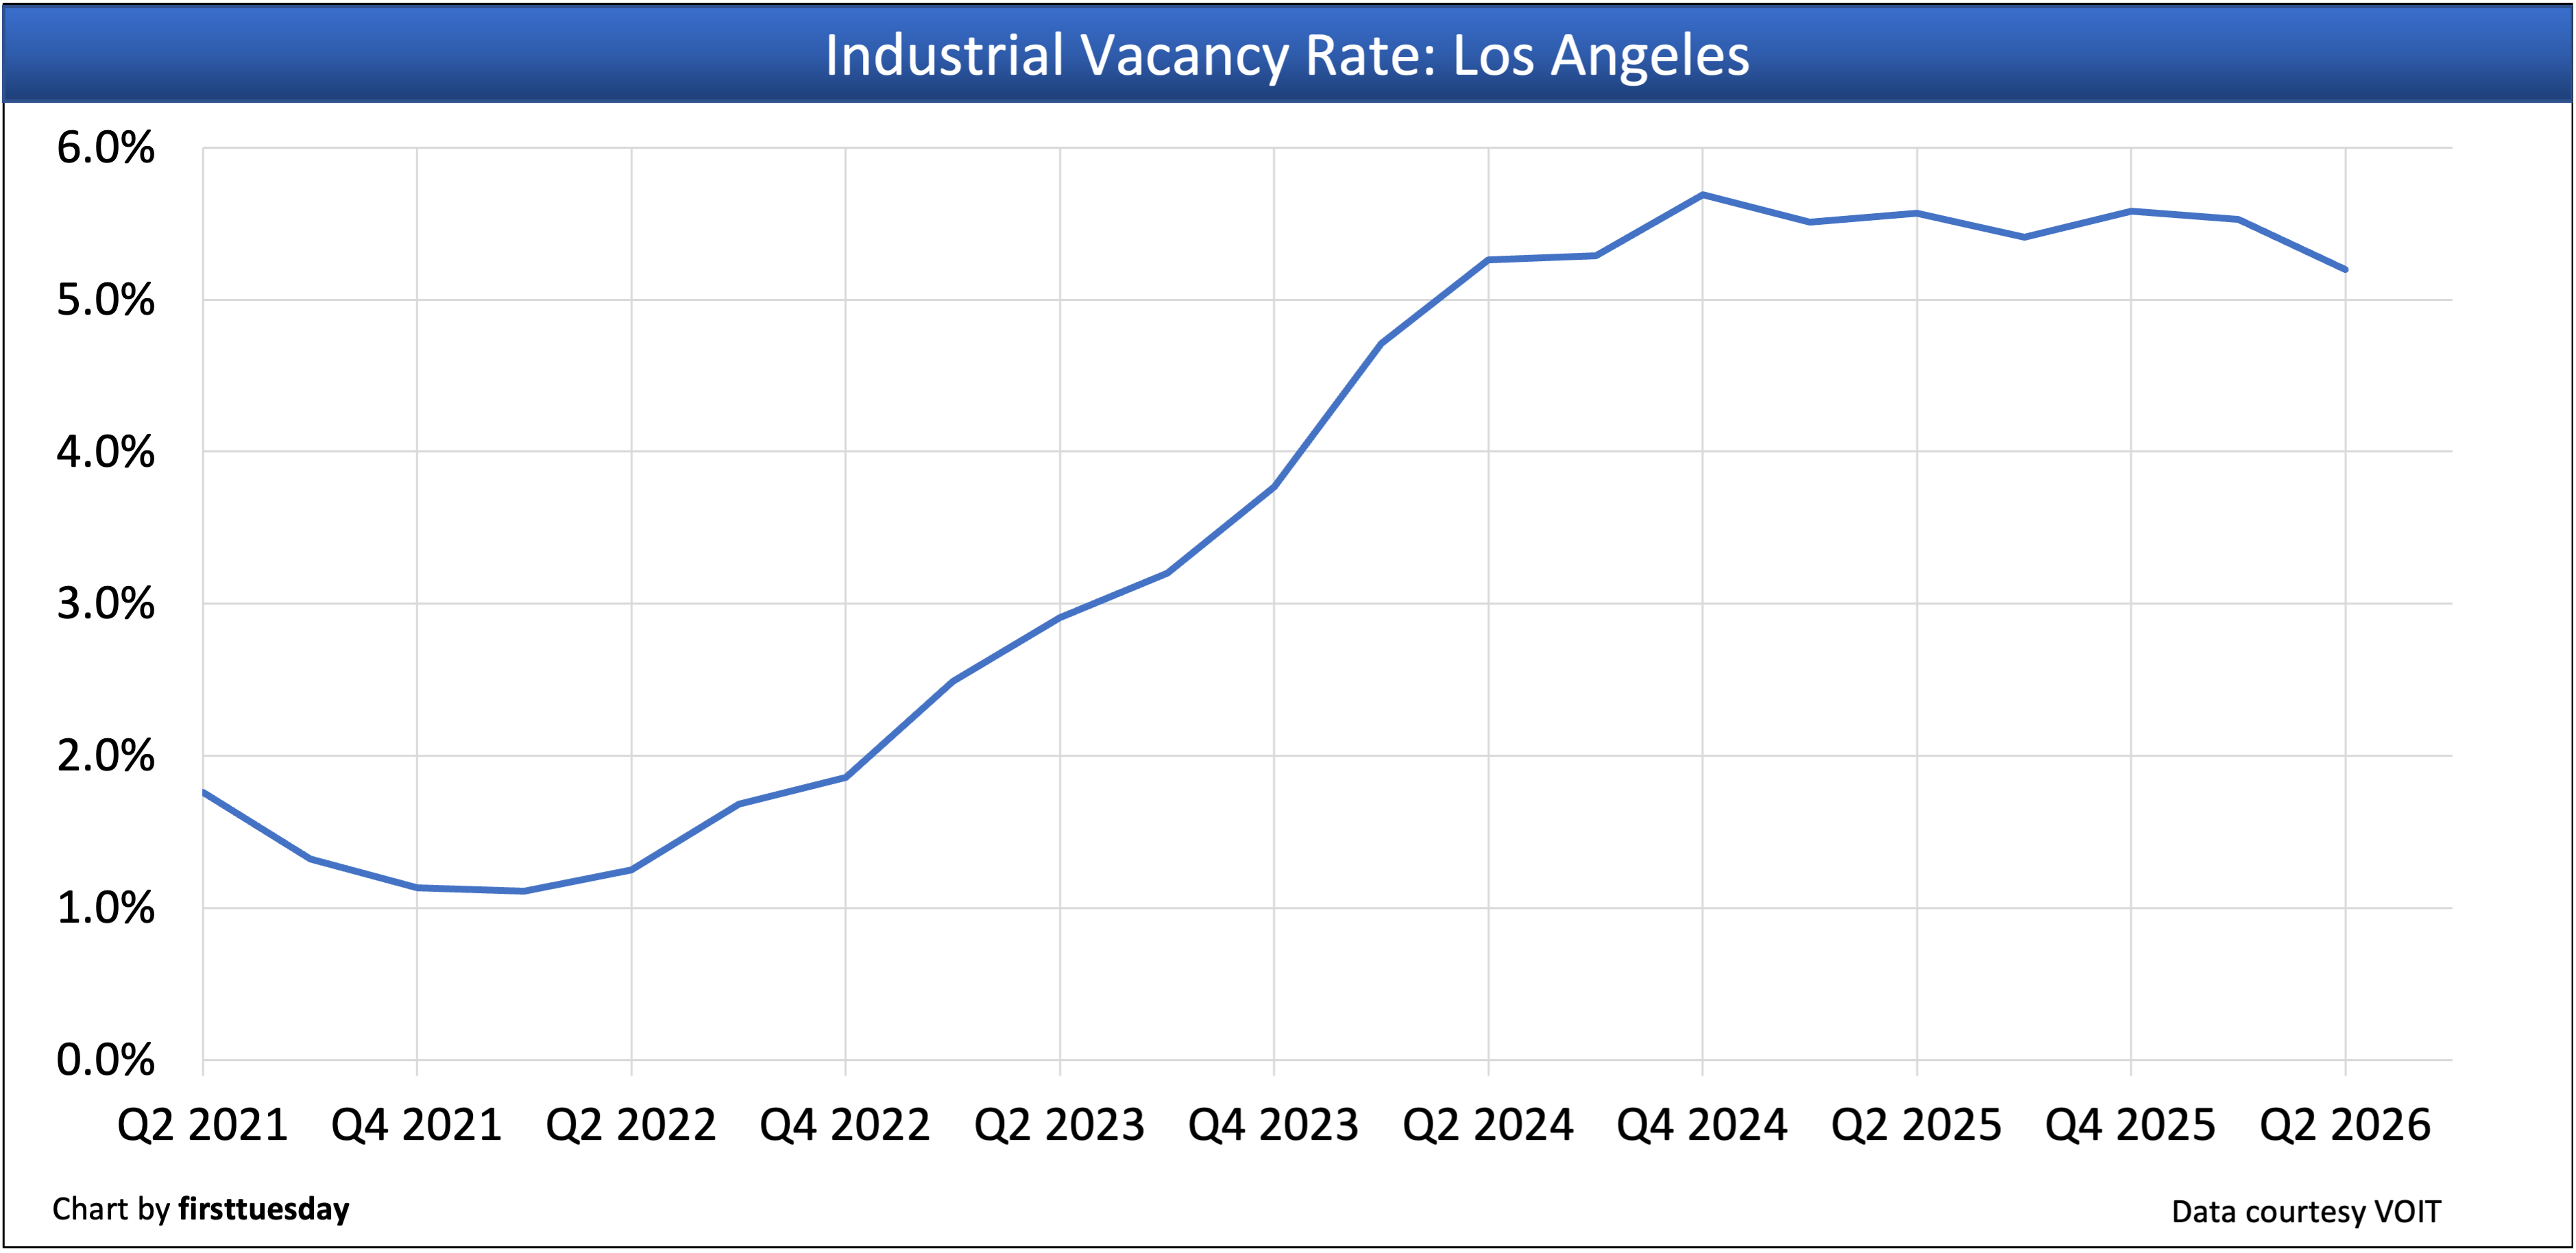
Los Angeles County’s industrial vacancy rate is:
- 5.20% in Q2 2026;
- down from 5.53% in Q1 2026; and
- down from 5.57% in Q2 2025.
Conclusion: The current cycle peaked at 5.69% vacant in Q4 2024. With Q2 2026 at 5.20%, following 5.53% in Q1 2026, the current market continues to tighten.
Los Angeles County’s industrial net absorption rate is:
- +2,798,764 square feet in Q2 2026;
- up significantly from +540,615 square feet in Q1 2026; and
- up significantly from -766,211 square feet in Q2 2025.
Conclusion: Positive net absorption of over 2 million square feet in Q2 2026 marks the second consecutive quarter of positive net absorption and the first back-to-back quarterly gains in over two years.
Inland Empire — industrial
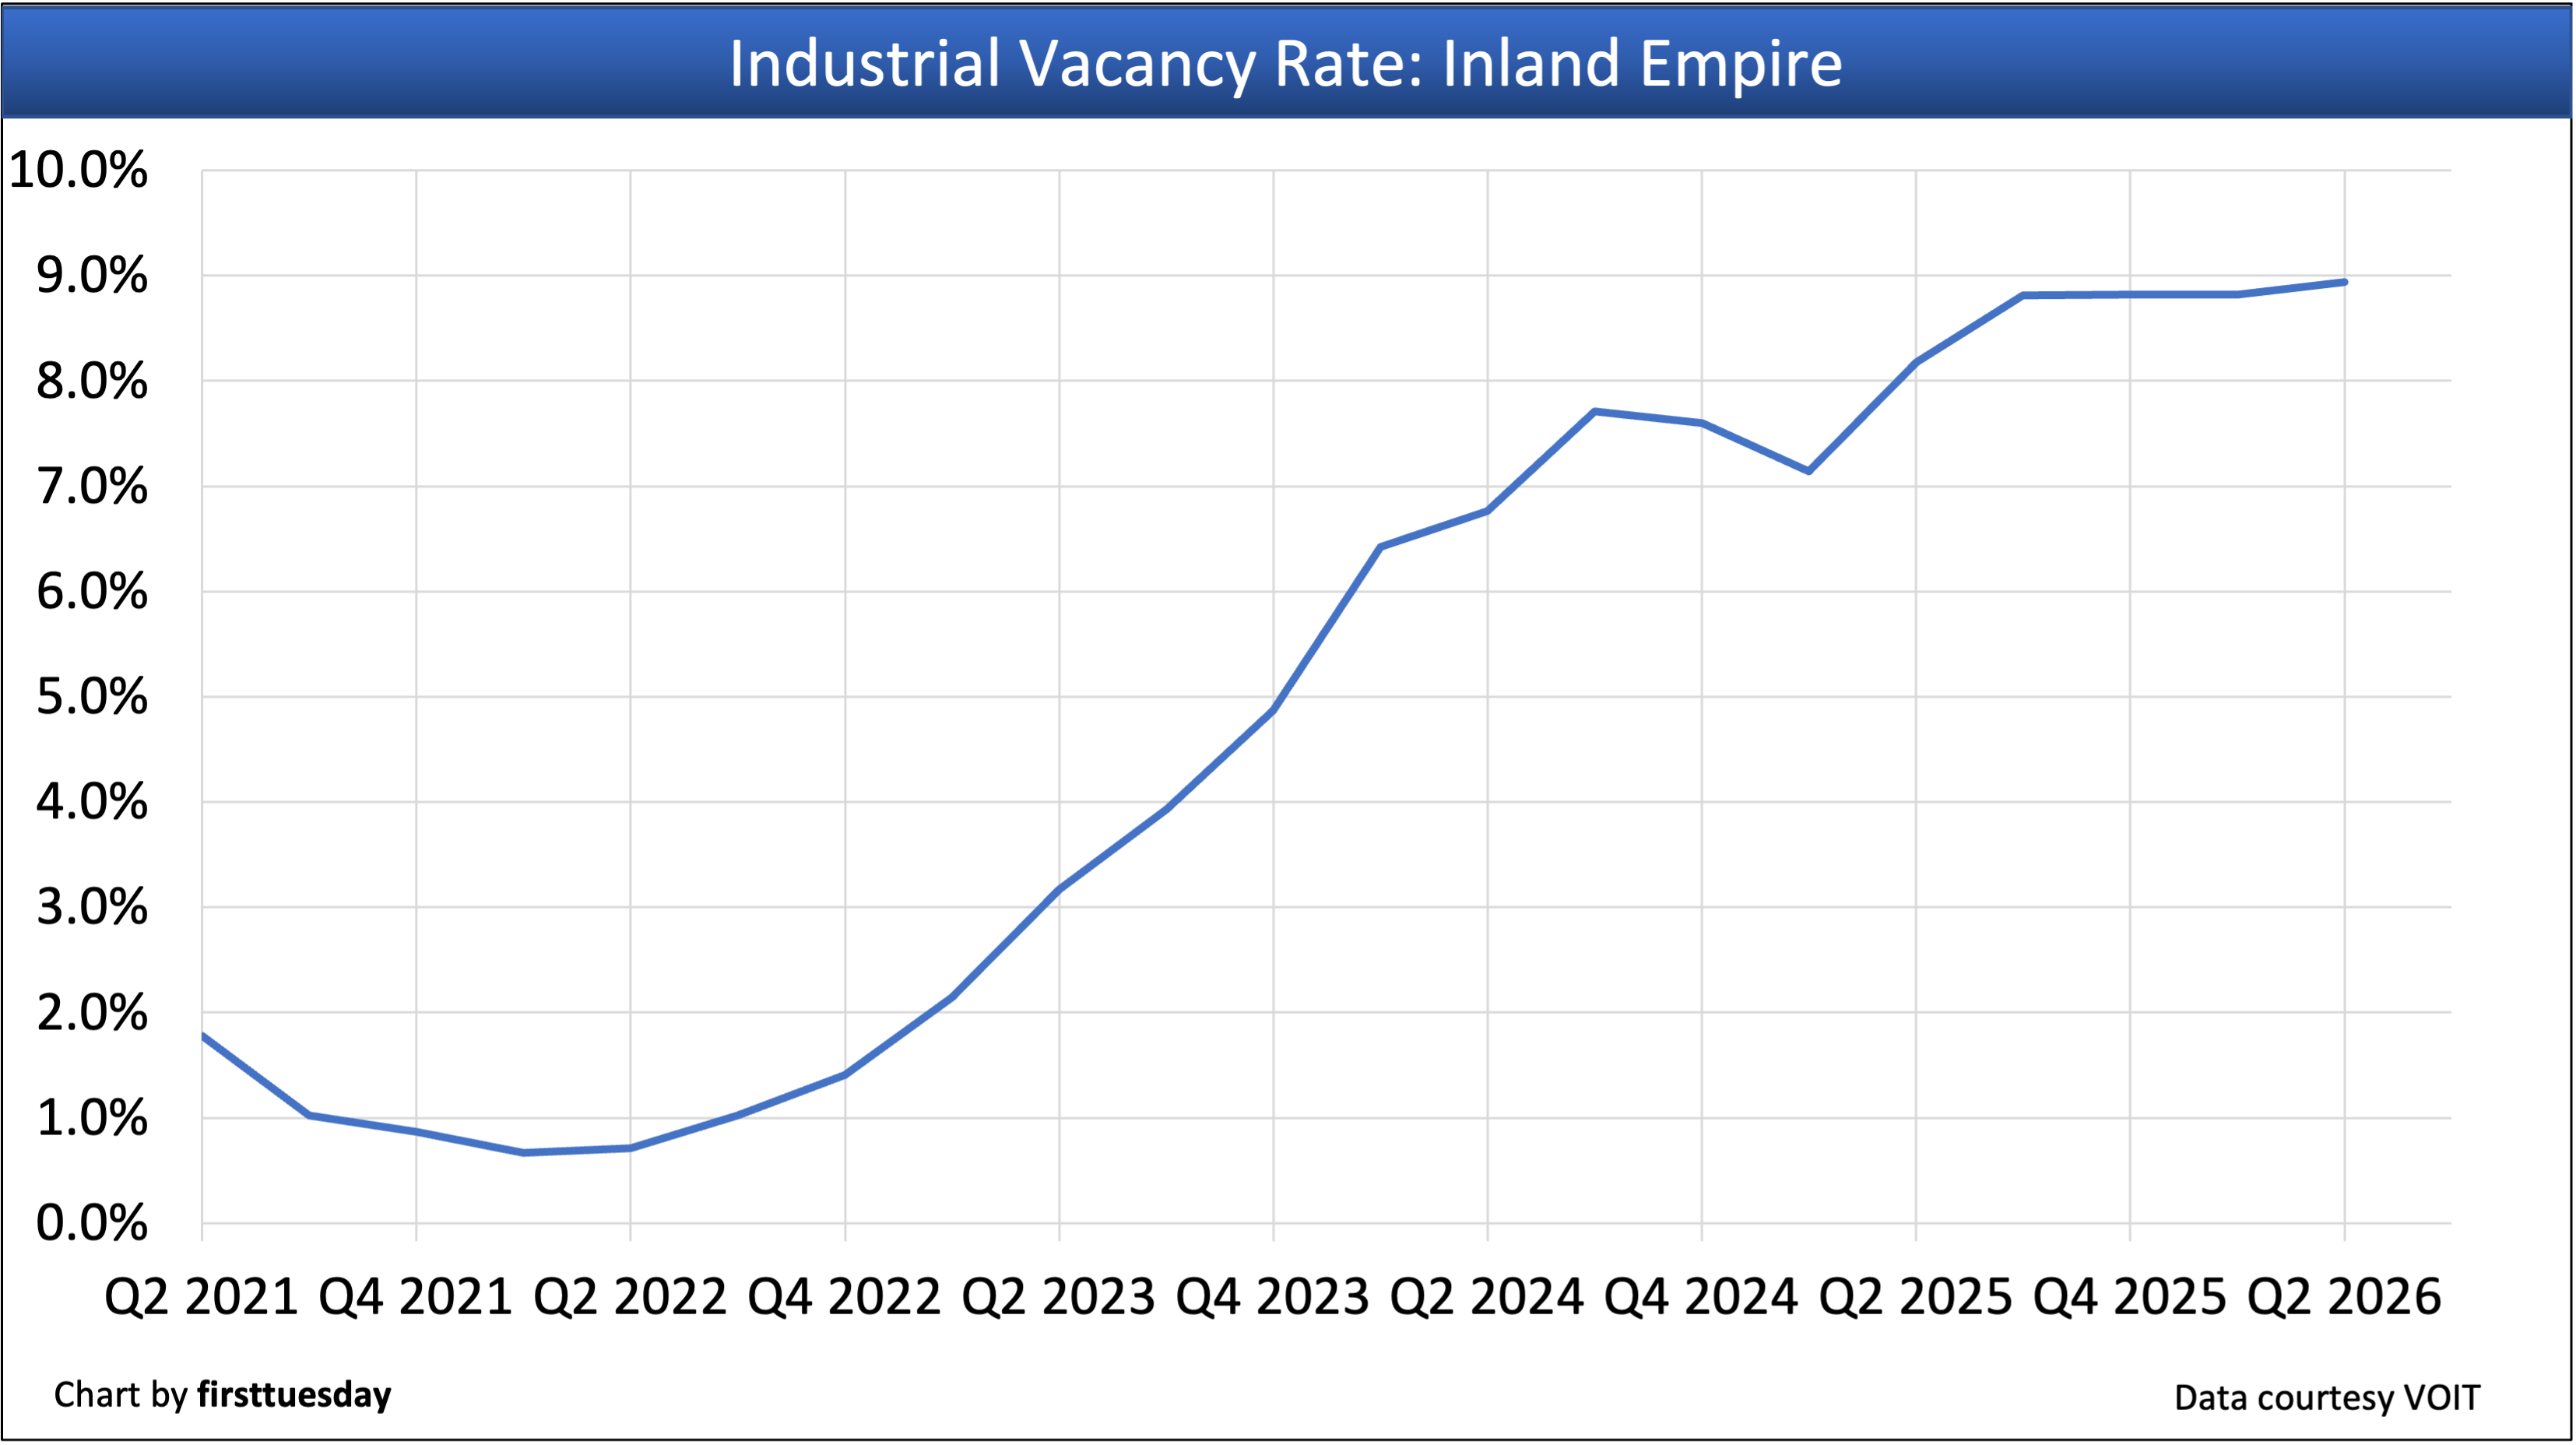
The Inland Empire’s industrial vacancy rate is:
- 8.94% in Q2 2026;
- up from 8.85% in Q1 2026; and
- up from 8.09% in Q2 2025.
Conclusion: Vacancy and availability continue to rise. With more vacant space than there are tenants, aggressive landlords are eager to offer concessions and reduced rents.
The Inland Empire’s industrial net absorption rate is:
- -1,357,964 square feet in Q2 2026;
- down significantly from +1,392,430 square feet in Q1 2026; and
- up from -2,738,425 square feet in Q2 2025.
Conclusion: Essentially all of the prior quarter’s gains were lost in Q2 2026.
Related articles:
SoCal’s commercial property market struggles to find tenants — Q2 2025