
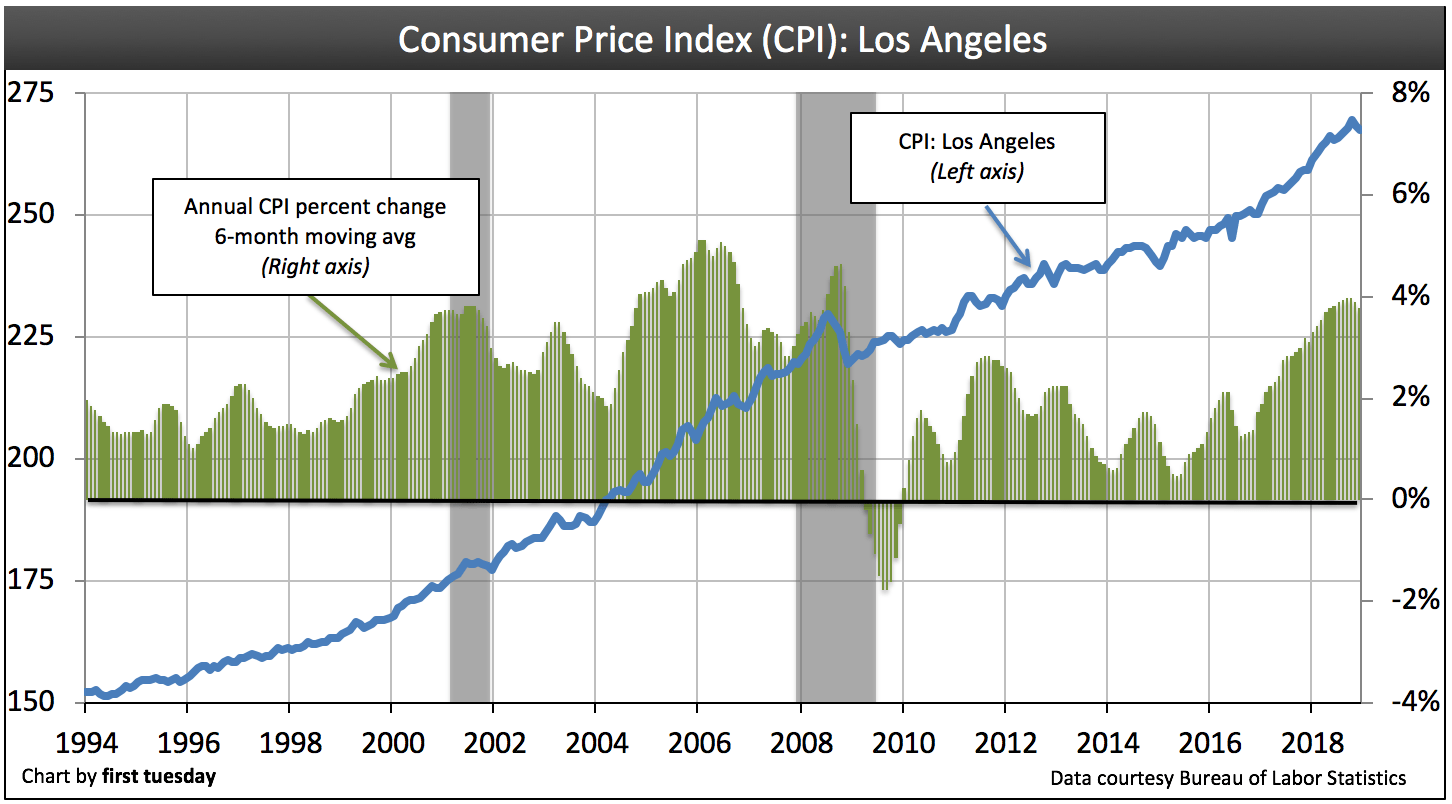
The consumer price index (CPI) for Los Angeles rose 3.2% from December 2017 to December 2018. The most recent CPI data shows San Diego’s CPI rose by 3.3% and San Francisco’s CPI rose 4.5% over the previous year. For perspective, 2% annual inflation is a rate sufficiently neutral to ward off deflation and induce consumer spending. In turn, spending keeps employment at optimum levels to support demand for housing.
California’s healthy CPI growth is complicated by high demand for rentals and overly restrictive zoning on new multi-family construction. Slow growth in new construction and wages lagging behind home price and rent increases are part of why Los Angeles residents spend so much of their income on rent.
The 3.2% rise in Los Angeles portends a parallel rise in rents over the next year or two. Rents tend to hold tight in their increases to CPI movement and personal income levels, while asset prices (homes and securities) are driven by wealth levels of personal cash reserves and the ability to borrow. Still, home prices are anchored over the long term to inflation, a fact reflected in the mean price trendline for real estate. Therefore, the rapid price increases seen in California from 2012-2018 are unsustained by incomes, and thus need to fall back in the coming years.
Updated January 29, 2019. Original copy released February 2014.
*1982-84=100
Chart update 01/29/19
| Dec 2018 | Dec 2017 | Year-over-year change | |
| CPI: Los Angeles | 267.6 | 259.2 | 3.2% |
| Dec 2018 | Dec 2017 | Year-over-year change | |
| CPI: San Francisco (not pictured) | 289.9 | 277.4 | 4.5% |
| 2nd half of 2018 | 2nd half of 2017 | Year-over-year change | |
| CPI: San Diego (not pictured) | 293.9 | 284.5 | 3.3% |
The basics of CPI
The consumer price index (CPI) measures and tracks the general increase in the price of goods and services consumed in the economy, called consumer price inflation. CPI is tracked by the Bureau of Labor Statistics. The Federal Reserve (the Fed) strongly considers CPI figures when determining monetary policy for the nation.
CPI is tracked in three regions of California:
- Los Angeles-Anaheim-Riverside (issued monthly);
- San Francisco-Oakland-San Jose (issued bi-monthly); and
- San Diego (issued semi-annually).
CPI goods and services include:
- food and beverages;
- rent or the homeowner’s equivalent;
- apparel;
- transportation;
- medical care;
- recreation;
- education and communication; and
- other goods and services.
Editor’s note — Remove the price of volatile commodities that vary wildly from day to day (i.e. energy and food) and you get core inflation. The Fed raises or lowers key interest rates in reaction to core inflation, not CPI.
Why doesn’t the Fed just look at CPI? Let’s say a drought hits the Salinas Valley and the price of lettuce spikes. If it lasts long enough, regional CPI will jump up to reflect this – but the relatively minor supply issue – shock – doesn’t warrant the Fed’s intervention to alter the nation’s monetary policy. The same holds true for energy price spikes. Commodity spikes either eventually adjust in price to the core rate of inflation trend line or become static at new price levels and no longer contribute to price inflation.
How real estate professionals use the CPI
CPI is useful for real estate professionals in setting:
- rents; and
- price expectations.
The CPI is often used to make future annual rent adjustments in long-term, nonresidential rental lease agreements. For residential rental rates, the annual change in the CPI provides guidance on the annual increase in the rent tenants are able to pay. Rent adjustments calculated by CPI cover the negative effect inflation has on the purchasing power of the landlord’s rental income.
Further, the CPI is easily understood and inexpensive to administer in nonresidential rental properties, since it’s publicly available. If not used directly, it indirectly influences the percentage figure negotiated for fixed annual rent adjustments in multi-year lease agreements.
Of course, there are disadvantages to using the CPI exclusively to adjust the price of rent. First, it does not represent actual changes in the property’s rental value based on current rents for comparable properties brought about by demographic changes. It also doesn’t take the landlord’s changing operating costs into account for gross lease arrangements. However, a separate provision may be included in lease agreements to manage increases in operating expenses. [See first tuesday Realtipedia volume, Real Estate Property Management Chapter 44: Rent Increases and CPI]
Unlike indexing consumer price inflation, a standardized index for asset price inflation doesn’t exist. Economists use the CPI (plus a demographic appreciation figure) to approximate long-term home price expectations (California is around 1.5% plus inflation of around 2%; hence 3.5% annual real estate price inflation).
The main difficulty with using the CPI for viewing asset price inflation is that home prices fluctuate drastically every few years. This activity was exemplified in 2013 when low-tier home prices soared as much as 40% year-over-year, to slow significantly the following year. Thus, CPI is not helpful in forecasting where asset prices such as home prices will be in, say, a year or two.
However, the CPI is very useful when forecasting what home prices will be over the course of several years. Home prices are mostly a reflection of the costs of labor and materials, items that pace with CPI. Further, incomes set the price (via mortgage borrowing) for homes, and incomes are closely tied to CPI.
Thus, home prices are intrinsically pulled toward the mean price trendline, based on CPI. Home prices oscillate above and below this line as other market factors push and pull to temporarily distort real estate prices (such as speculation, mortgage rates, distressed sales, jobs, business cycles, capitalization rates, construction starts, etc.).
CPI changes drive buyer purchasing power
The effect CPI has on buyer purchasing power is the index’s most significant aspect for real estate professionals. Here, it is the inextricable link between personal income and CPI that influences home prices.
Buyer purchasing power is determined by changes in:
- mortgage rates (which change erratically from day-to-day); and
- average income (which changes gradually).
Personal income for homebuyers generally adjusts upward in response to rising costs of living — CPI. This is so an employee’s standard of living doesn’t slip from year to year as they spend to consume the same level of goods and services.
The recent exception was the combined 2008 recession and financial crisis, followed by the elongated bumpy plateau recovery. During the recovery, average income slipped (though the incomes of those that remained employed generally rose). Most areas of the state didn’t catch up to pre-recession average income levels until 2012. That’s not considering the 2% annual rate of inflation for the intervening six years.
With reduced incomes, homebuyers are unable to qualify for as much mortgage principal as in years past. Thus, they need lower mortgage rates if they wish to qualify for the same mortgage amount. Luckily for homebuyers after the 2008 recession (and by the Fed’s design), mortgage rates were at historical low nominal rates until mid-2013.
Going forward, as the era of rising interest rates takes hold, homebuyers are going to need higher incomes to keep up the current dollar level of individual borrowing. Otherwise, home prices are expected to trend downward.
Buyer purchasing power fell at the end of 2016 as mortgage interest rates rose. Thus, home prices are likely to increase gradually through late-2017 when they will dip briefly in response to today’s higher interest rates.


“The decision of the MPC is consistent with the neutral stance of monetary policy in consonance with the objective of achieving the medium-term target for consumer price index (CPI) inflation of 4 per cent within a band of 2 per cent, while supporting growth,” the RBI said in a statement. The Monetary Policy Committee pegged CPI inflation in the range of 5.
Again and again you ignore Nothern California.