

Why this matters: Presently, new construction starts are remarkably inadequate, adversely affecting the pricing of inventory for sale and for rent in 2026. Real estate agents and brokers looking for guidance in available real estate data need to understand turnover of owner and tenant occupancy controls sales and leasing volume. For California, turnover is based on a balance between local inventories for-sale and for rent, residential construction starts and jobs.
Slow to move, both construction and pricing
Single family residential (SFR) construction starts during the six-month phase ending August 2026 were up 6% from the same phase one year earlier.
During the same six-month phase, multi–family construction starts were up 10% from a year earlier.
For a more balanced view, multi-family construction during the year 2025 experienced a 21% increase over the prior year, with starts on 47,200 new units. Multi-family rentals were in higher demand during this past decade compared to new SFRs since renting the family’s housing takes less of the monthly household income than ownership of similar property.
But to meet demand, new multi-family construction continues to hit national roadblocks in the form of labor and supply shortages, lack of local entrepreneurial general contractors and uncertainties about the cost of construction. Changes to the price of materials and labor are brought on by tariffs and military wars as well as attacks on immigration
This is on top of politically aggressive not-in-my-backyard (NIMBY) advocates. These are headwinds stopping normal turnover and thus sales and leasing.
However, the increasing necessity of California’s builder’s remedy goes beyond pressuring local agencies to increase permits, the remedy now demands permits by reducing local politics to solely administrative issuance with a leash on the time allowed to issue a permit. Although not a new workaround, a builder’s-remedy project is now controlled by state zoning and subdivision laws, not local political hierarchy.
This allows bigger and taller residential projects to come about by overriding local housing elements when they do not comply with state housing law.
In contrast, SFR construction starts in 2025 were down 9% from the previous year, for a total 55,500 new SFR starts. While 2026 is on track to be higher, it is still well below the construction bounce in 2021.
The 2021 construction surge was the result of homebuyer fear of missing out (FOMO), low home-resale inventory, historically low FRM rates and demand for relocation to remote communities eager for greater density. Away from the coastal communities, construction starts occur without the local zoning interference that takes place in coastal urban centers.
And yet, even with our population growth increasing overall since 2012, the construction of units is still catching up to meet housing demand.
State-initiated legislative efforts to add to the low- and mid-tier housing stock — where the lack of starts has hit home — have focused on encouraging more multi-family construction in recent years. As a result, metro areas with the highest annual increases in multi-family construction include Los Angeles, Riverside and Santa Clara. The most anemic growth occurs where zoning remains deliberately restrictive for housing, including Orange County, San Francisco, and San Jose.
While builders, primarily local general contractors, were beginning to cash in on legislative incentives and rising homebuyer demand, leaping mortgage rates and downward spiraling sales volume (pulling pricing down in tow) crushed builder sentiment in 2022, causing starts to plummet. That is where builders find themselves in 2026.
Since the 2022 peak in pricing, home prices across all price tiers in California’s major metro areas have not moved up. Since prices are flat and likely to remain flat-to-down, pricing will eventually permit wage inflation to catch up, rather than prompt a dramatic drop in the price tags as happened in 2008. As the trend setter, the most expensive local housing felt the effects of our current real estate recession first.
As of June 2026, all tiers of housing in San Diego and Los Angeles are flat, having risen less than two percentage points since June a year earlier. Noticeably for consumers, low-tiers across both metro areas rose less than half a percent. Only the high-tier of San Francisco showed a forward annual increase to meet the unique demands on its more expensive real estate, a one-off aberration due to AI’s presence.
A study published in July 2025 showed existing California resale homes were priced significantly higher than new ones. One of the few states with this used-vs-new inversion, Californians looking to buy new homes face the largest difference in beneficial pricing compared to any other state in the country. California homebuyers purchasing an existing home face 25% higher prices than buyers of new homes in the same area.
With prices overall starting to slip throughout the state, builders are motivated to grab the attention of buyers before recessionary prices push potential homeowners to wait for all home prices to bottom. Sellers of existing housing on the other hand often pull their property from the market rather than drop asking prices to compete with already less expensive brand-new homes.
Thus, residential construction starts will not reach their full potential until after the coming economy-wide recession. Prices will likely bottom by 2029, motivating buyers to act, as the real estate recovery begins to work its way out of its current recession.
Consumer inflation will incentivize equal or greater wage increases to coincide with yesterday’s flat prices that have now held for four years and are likely to continue or decline as for-sale inventory climbs. The flat pricing conditions have temporarily eliminated the hedge against inflation in improved real estate allowing job holders to pay effectively lower, inflation-free prices recently and in the next few years.
Updated October 6, 2026.
Chart 1
This chart illustrates the number of California residential construction starts during semi-annual phases ending in February and August.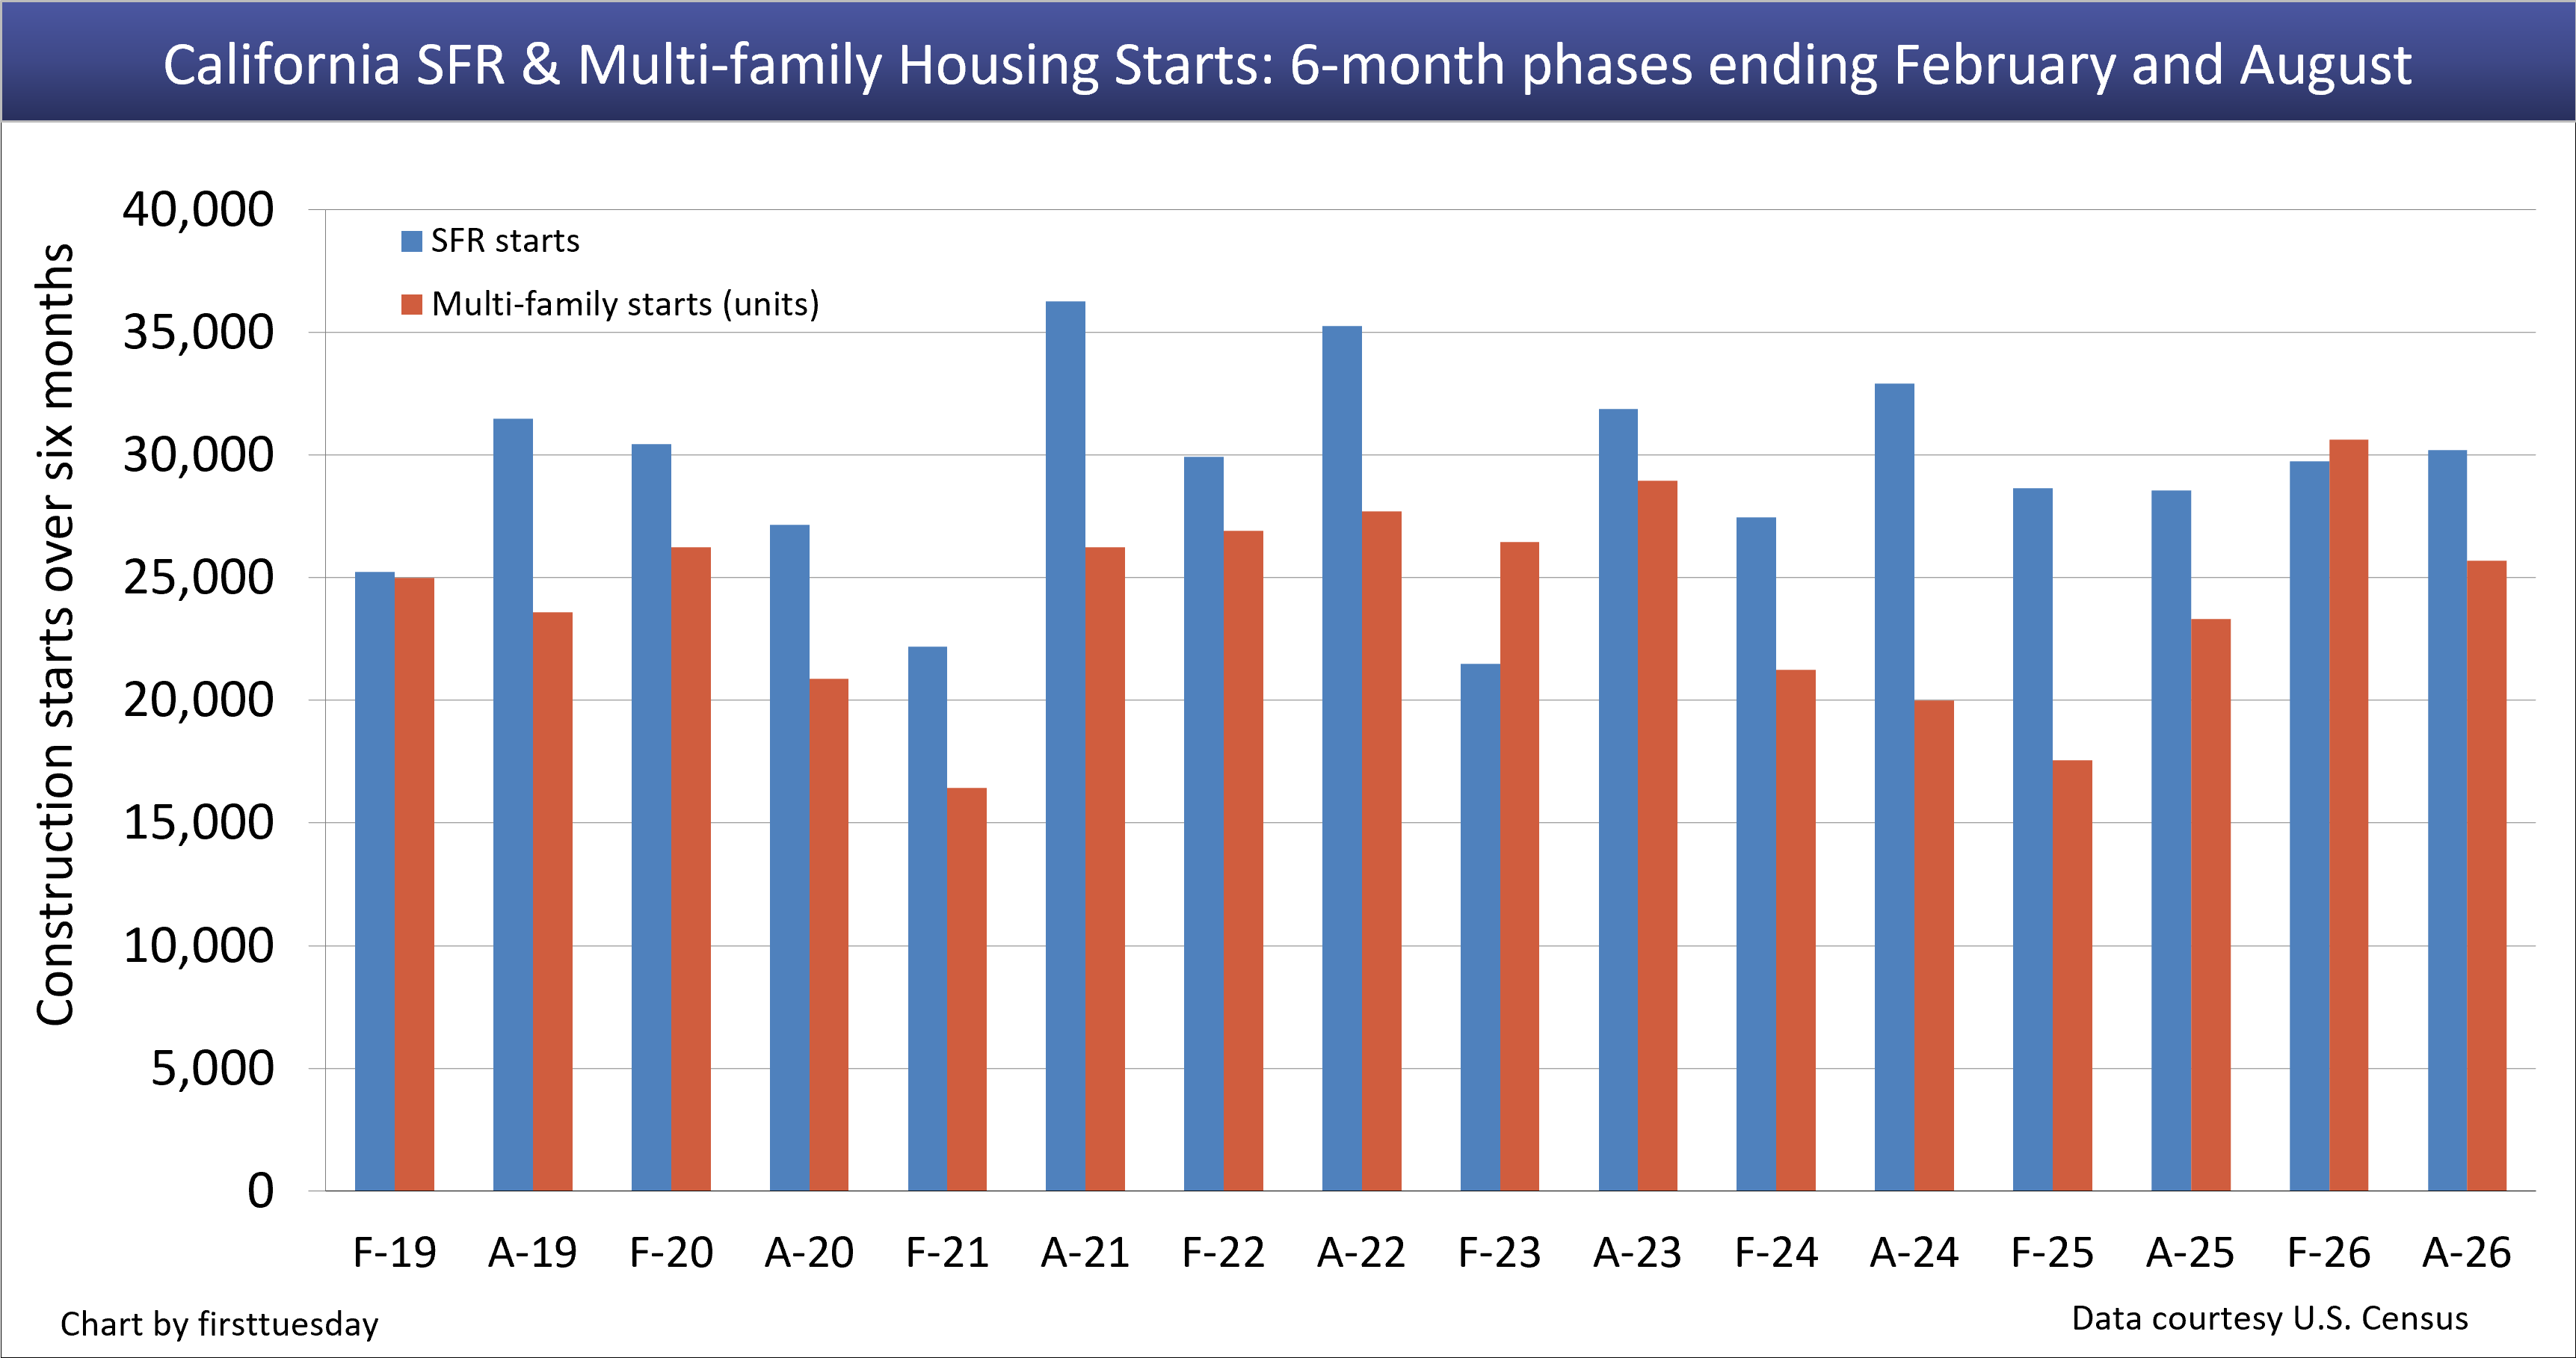 Chart update 9/28/26
| Six-month period ending | Aug 2026 | Aug 2025 | Annual change |
| SFR Starts | 30,191 | 28,552 | +5.7% |
| Multi-family Starts | 25,678 | 23,325 | +10.1% |
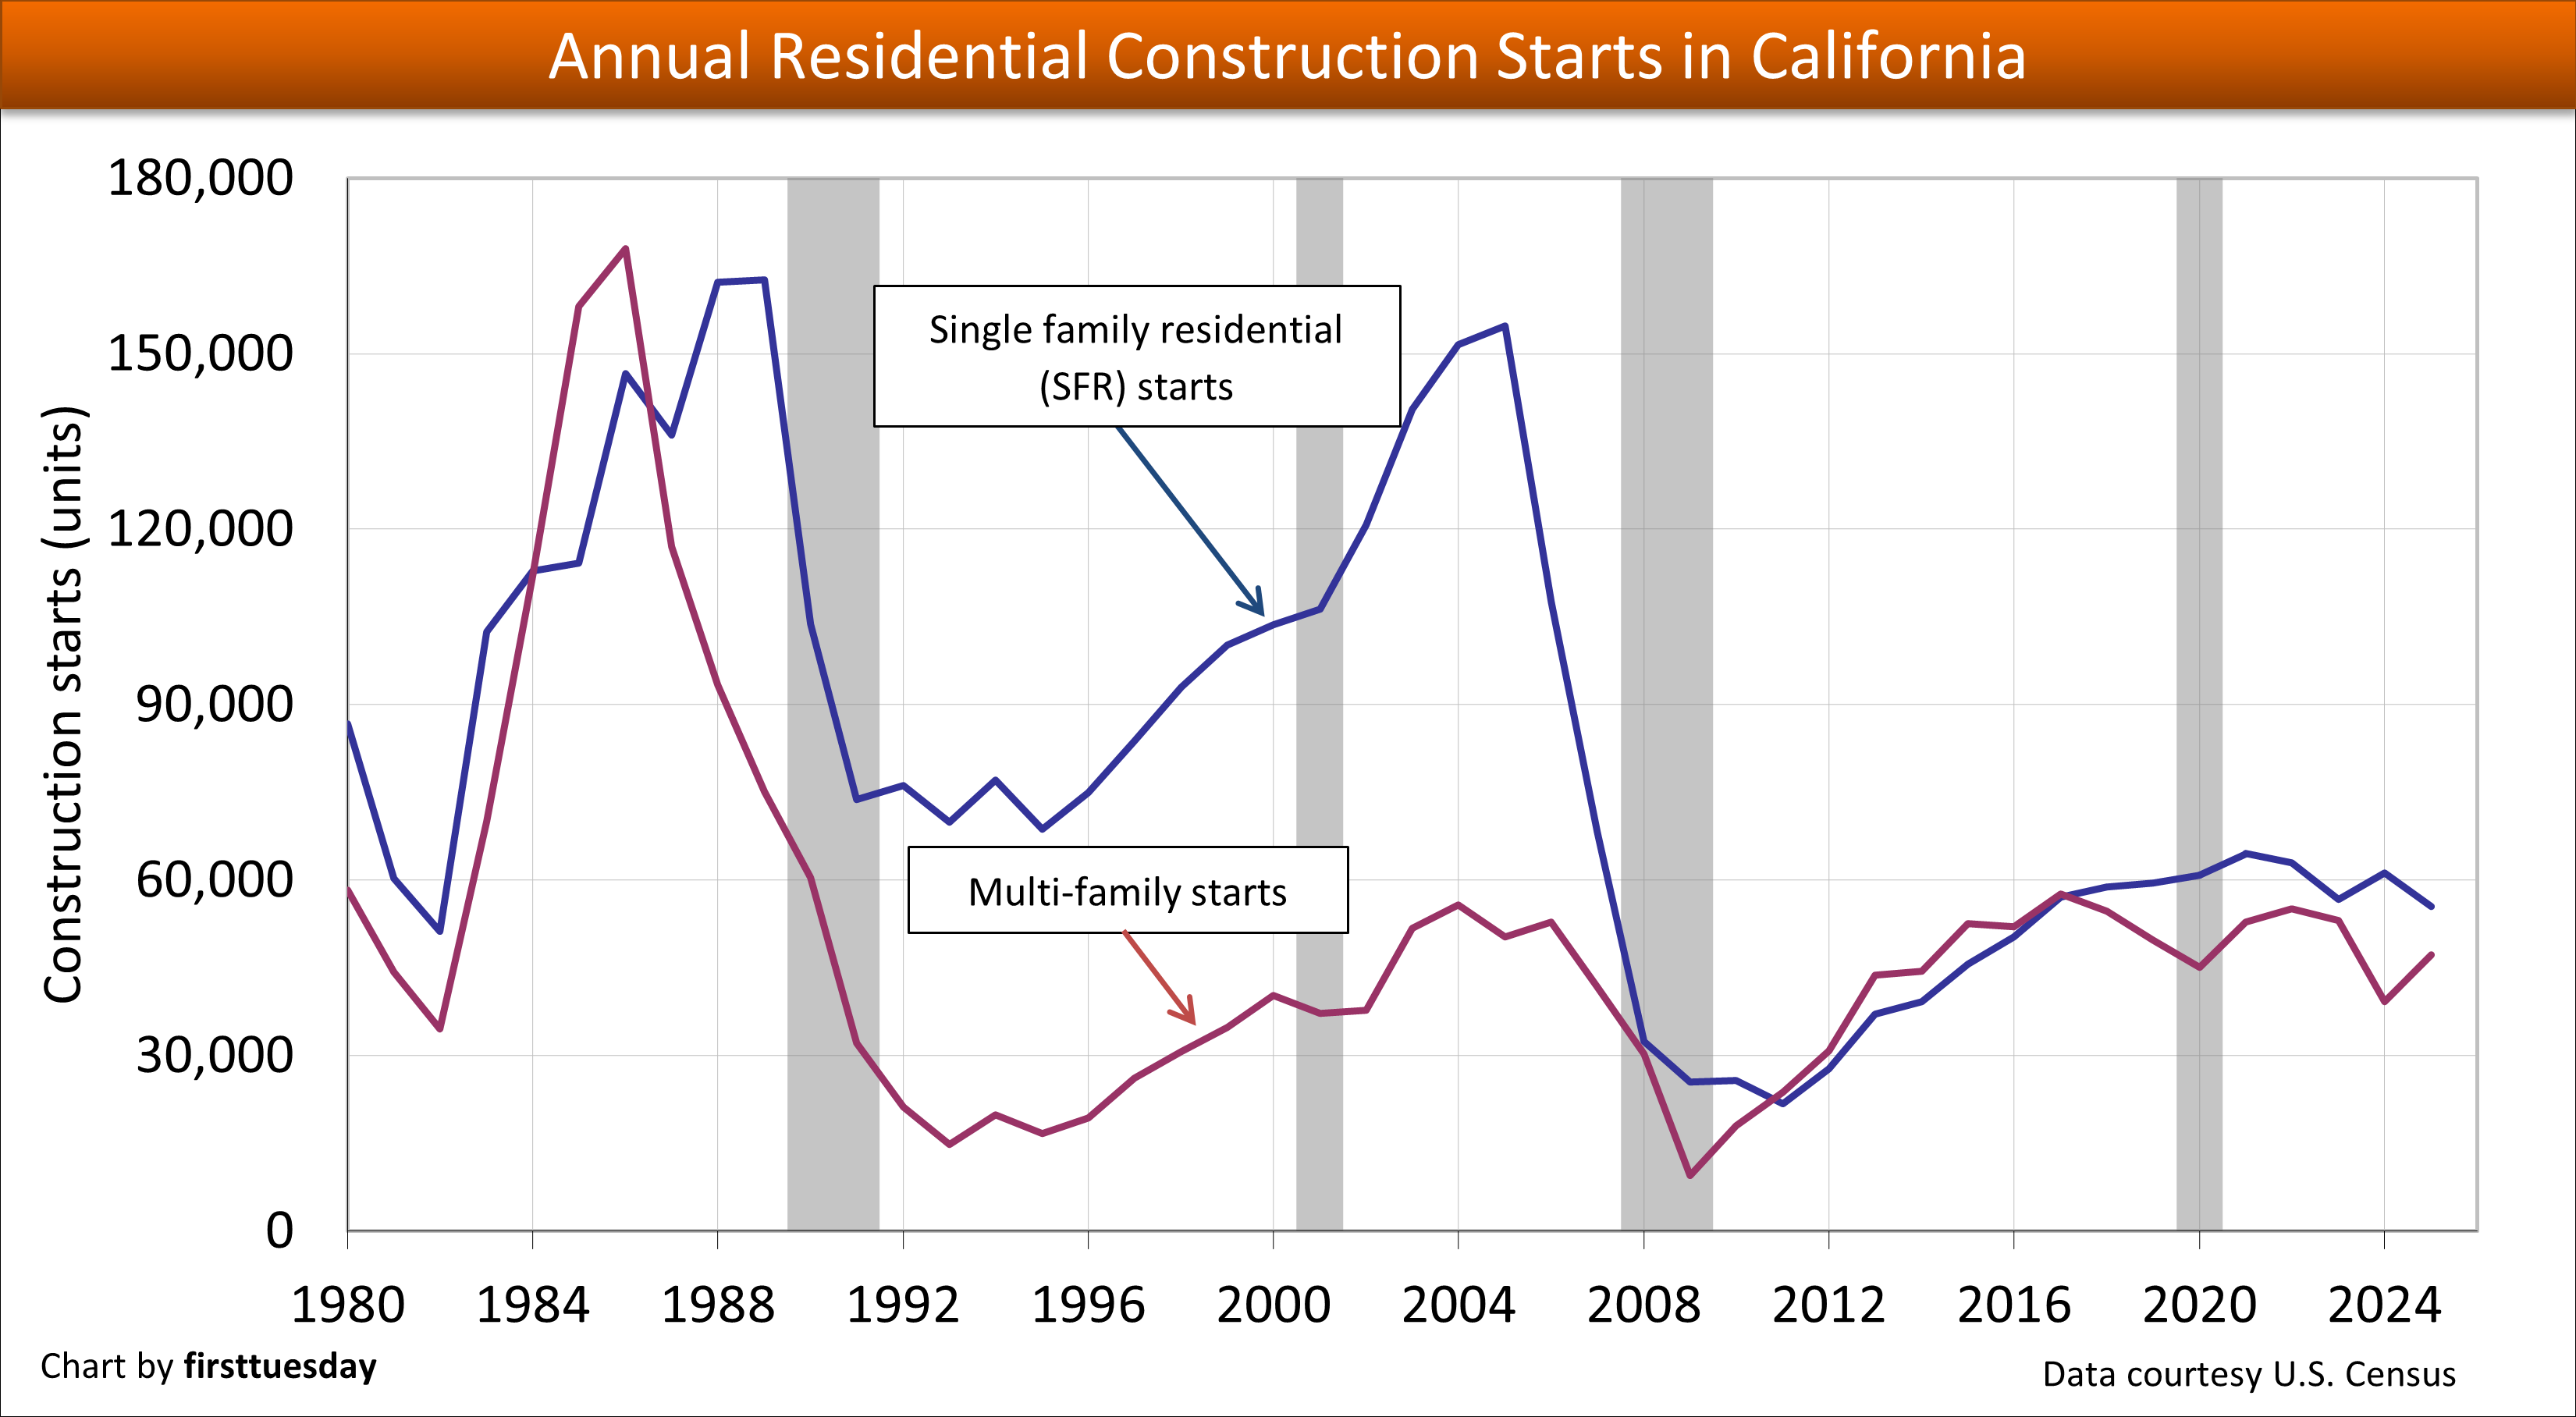
| 2025 | 2024 | 2023 | 2005 peak | |
| SFR Starts | 55,483 | 61,229 | 56,655 | 154,700 |
| Multi-family Starts | 47,228 | 39,156 | 53,052 | 50,300 |
*Any forecasts made by firsttuesday are based on current new home sale trends, actual construction starts and current government policies.
Detached single family residential construction trends in California:
- 30,191 SFR starts took place in the six-month period ending August 2026. This is 1,639 more starts than occurred during the same period one year earlier, a 5.7% increase.
- In 2025, SFR starts totaled 55,483. This is up 9.4%, or 5,746 starts, from 2024.
- For perspective, the past cycle’s peak year in SFR starts was 2005 with 155,000 starts. The following trough was 2011 with 22,000 starts, the year before our recent recovery set in following the Great Recession of 2008.
Detached SFR forecast:
- firsttuesday‘s projection for SFR starts in 2026 is a continuation from the prior year, as is currently the case with the first half of 2026 up 1% compared to 2025 as of August. The forecast for 2026 is most affected by the downward pressure due to consistently high mortgage rates which slashed buyer purchasing power, and increased consumer caution as trade embargos, taxed imports and now wars have set in.
- Expect SFR starts to remain below their potential in the next two plus years, until a recovery from the next recession picks up steam, likely around 2030.
- Subdivision final reports will remain low until local developers determine a return of first-time homebuyers is on their sales horizon.
- The next peak in SFR starts will likely occur during the boomlet period in the years following 2029-2030.
Multi-family housing construction trends:
- 25,678 multi-family housing starts took place in the six-month period ending August 2026. This is 2,353 more starts than occurred during the same period one year earlier, a 10.1% increase.
- 47,228 multi-family housing starts took place in 2025. This was 20.6% higher than 2024, and below 2018 when multi-family starts hit their most recent peak.
- For perspective, the past business cycle peak year in multi-family housing starts was 2004 with 55,822 starts. The lowest year was 2009 with just 9,500 multi-family housing starts as an excess of units existed.
Multi-family housing forecast:
- firsttuesday forecasts multi-family housing starts to be up in 2026 from the past year. As the economy stumbles, builders of residential improvements are hampered by increased inflation from induced shortages in construction materials, workers’ concerns over deportation conditions, mortgage lenders keeping a tight fist on funds, and taxes remaining elevated on imports.
- Due to the rise of the builder’s remedy, more multi-family housing projects will open in new, desirable locations. As SFR projects decline, the pressure on multi-family housing will incentivize new development through 2027.
- Multi-family housing starts were expected to rise at a gradual pace beginning in 2020, as several legislative changes aimed at increasing multi-family construction encouraged more building of dense, low- and mid-tier housing. However, pandemic disruptions and tightening lines of credit pushed multi-family construction numbers down significantly in 2020-2021, picking up significantly since 2022.
- For 2026, we will see a much-diminished residential development environment as the USA moves through its first world-wide trade war in 90 years. Meanwhile, the population consolidates into larger households per unit to weather the related causes of consumer inflation.
- Opportunities for residential construction wait until another economic revolution is installed in the USA, after moving into higher education and resulting skills following the end of a century of American industrial revolution started in the 20th century.
- The next peak for multi-family housing starts will likely appear after 2029 and beyond, but only after the coming recession bottoms and moves into recovery.
Statistics related to California housing:
- 15 million total housing units existed in California in 2025 In 2024 13.8 million of which were occupied and 7.7 million of which were owner-occupied, according to the U.S. Census Bureau. This continues a slight increase over prior years.
- Prior to 2020, California population growth had been increasing at a rate of 0.5%-1% per year. But California’s population has since begun to decline, the result of more deaths than births alongside more residents moving to other states than moving in. As an offset, those moving in possess higher education, skills and wealth than those moving out of California.
- Roughly 18.2 million people were employed in California in June 2026. This is above the number of jobs held at end of 2019, prior to the 2020 recession and pandemic economy, according to the California Employment Development Department (EDD).
- California’s residential rental vacancy rate was 4.8% in 2025.
Related articles:
California’s shifting residential vacancy rates tell a story












This article provides a useful look at the changing dynamics of California’s housing construction market, particularly the contrast between declining single-family construction and the sharp increase in multifamily starts. The figures highlight how construction activity is responding to affordability pressures, demand for rental housing, financing conditions, and regulatory constraints. It is also interesting to see how factors such as labor and material costs can influence whether increased demand actually translates into completed housing. Overall, the data reinforces that California’s housing supply challenges are complex and that construction trends need to be viewed alongside economic conditions, development cos