Why this matters: Homebuyers dependent on mortgage funds are limited by their borrowing capacity for the price they pay, and even more so as prices stray farther from the rate of wage increases. Changes to buyer purchasing power forecast rises and falls in property pricing as long-term business cycles shift wealth between mortgage lenders and sellers, and buyers sit out the market until prices decline.
Waiting for the other shoe to drop, as it will
Home price increases cannot exceed what homebuyers are able to pay for long. Thus, any rise in mortgage rates instantly cuts the amount of capital funding homebuyers can borrow — and the price they qualify to pay for a home is reduced.
When buyer purchasing power falls consistently, home prices are soon to follow (absent significant outlying market factors, foreseeable but not likely). In contrast, when purchasing power rises, the seller’s outlook for a rise in pricing is good and typically happens far more quickly than a drop when seller outlook is bad.
Following the record-low mortgage rates of 2020-2021 which propelled home prices to new heights, buyer purchasing power nosedived in 2022, sending the Buyer Purchasing Power Index (BPPI) into negative figures. By 2024, the BPPI figure began a recessionary forecast by trending positive. As of Q2 2025, a homebuyer with the same income one year earlier was able to borrow 1% more purchase-assist mortgage money.
In turn, prices in California’s three largest cities are also hovering near where they were a year ago and a trifling 2% above the May 2022 peak — a significant three-year loss for the homeowner who views a home as a hedge against consumer inflation.
While the BPPI rises and falls month-to-month, in the coming decade the annual BPPI figure will generally remain just below zero due to cyclically rising interest rates. Even when home prices begin their recovery from the present property market recession — expected to bottom around 2028 — the first buyers to return will be speculators. These early arrivals provide a short-term pick up in sales volume and a temporary “dead cat” price bump.
Updated August 7, 2025.
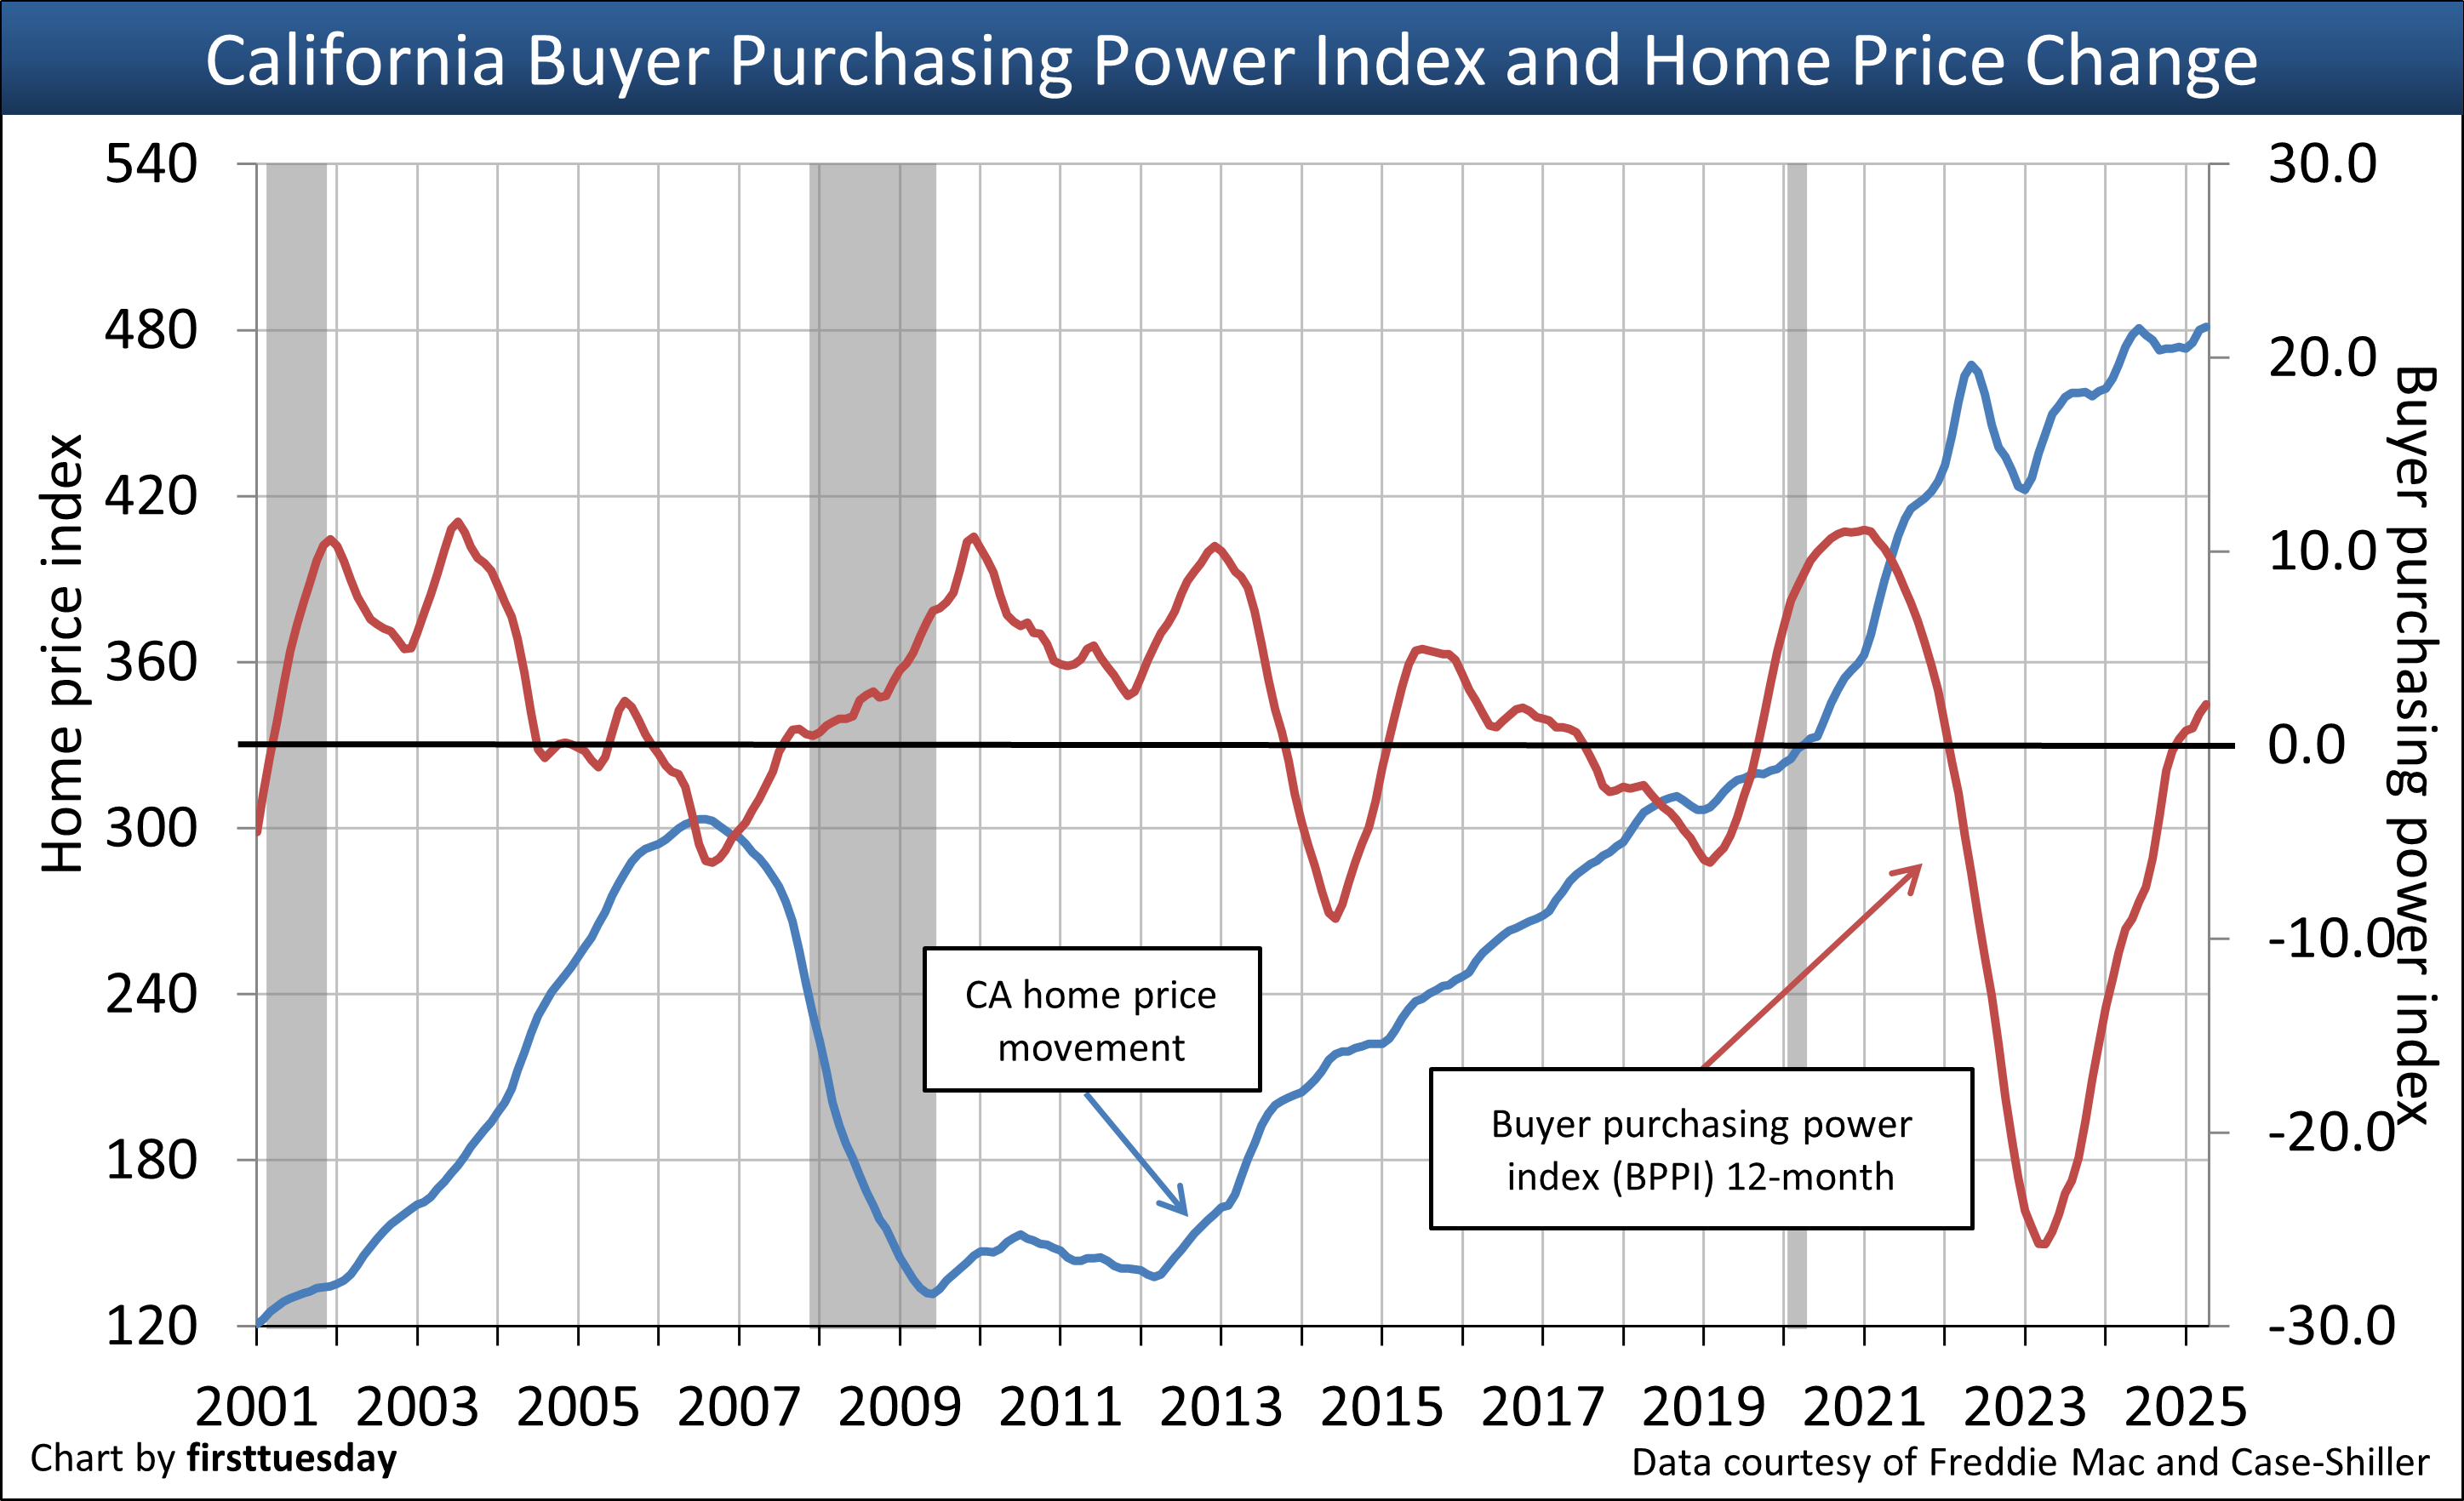
Chart updated 8/7/25
| April 2025 | April 2025 | Annual change | |
| Buyer purchasing power index (BPPI) | 12-month average: +3.1 | 12-month average: -7.0 | -1.5% |
| CA home price index: low tier | 481 | 474 | +1.5% |
The BPPI is calculated by firsttuesday using the 30-year FRM rate and the average income in the state of California. The BPPI significance is in its display of the change to a buyer’s purchasing power from year to year. Thus, a homebuyer is able to qualify to borrow more principal than one year earlier when the index moves upward.
The BPPI is determined by the:
- average income, which changes as coupled to pace of consumer inflation, the annual COLA payroll adjustment; and
- mortgage interest rate, which varies constantly as investors worldwide park their excess cash in U.S. Treasury bonds when business opportunities for investment are scarce.
The 12-month moving average BPPI in the chart shows a longer-term trend than the noisier monthly change. As soon as the BPPI trends upward or downward, watch for similar movement in home pricing several months forward.
When the BPPI trends down, home sales volume is the first to fall, then prices dip approximately 9-12 months later. When the BPPI trends up, home prices will rise more quickly — roughly six months later. The longer time difference is due to home sellers holding onto their sticky price illusions of yesterday’s prices in a slowing real estate market.
Of course, BPPI is not the only factor influencing home prices. Further, forecasts are not present facts and are never perfect because economic conditions affecting future real estate transactions are constantly changing. The effects of an active economy are not precisely known until the events occur, which is when they become hard data. Other significant factors follow.
Personal savings rate
The personal savings rate may be the greatest long-term influence on home prices. This is because the amount of savings a homebuyer has affects the amount of the down payment they can make, producing more favorable financial results – and more transactions.
With a 20% down payment, a homebuyer dependent on purchase-assist financing qualifies to buy a higher purchase price, called leveraging. Here, significantly more of their monthly payment (up to 31% of their income) goes towards paying off principal instead of paying:
- 7% annual mortgage insurance; and
- the 6-7% mortgage interest rate on the portion of the price not borrowed but funded by the 20% plus down payment.
Personal savings remained low since 2020, the year a boost from stimulus checks saw savings jump to historic levels. Still, the savings rate of the past decade is about half of what it was in the 1980s. Without savings, the current generation of homebuyers is at a major disadvantage. They will either:
- put off homeownership longer (depressing home sales volume and thus prices); or
- buy an overpriced property by reducing their quality of housing (versus the cost of renting comparable property) as they only qualify for a smaller mortgage amount, delighting sellers.
Related article:
Construction and zoning
New construction works to keep prices from rising too fast into a bubble. However, sufficient new construction to meet the demands of a growing population has a long-standing enemy: local zoning ordinances, city councils and NIMBY litigation.
California zoning behavior at the local level kills the ability to build enough housing to both add and replace the housing needed to accommodate our population growth and the shifting demand from changing demographics. The quality of rental construction pulls demand for homeownership down when analyzing:
- the amenity levels of new rentals which provide better housing for less monthly cost than homeownership; and
- the lost opportunity (interest income) incurred by using savings to buy a home (cash or cash to new loan) instead of renting at less cost and earning interest on earnings retained as savings.
Consider also that today’s younger generation is less mathematically challenged about housing than their parents’ Baby Boomer generation. During the millennium boom every tenant qualified to buy under one type or another of predatory mortgage financing to fund the purchase of a home at most any price. But that ended badly to no surprise. 1.1 million households lost the home they owned due solely to the scam ZAP or Zero Ability to Pay on mortgages they were strapped into.
Related article:
Population density and growth
Just as population growth influences construction starts (so long as zoning, building costs and rent for comparable housing doesn’t interfere), demographic movement also affects household formations, which in turn influences home sales volume.
When population growth is slow and zoning renders construction starts moot, housing goes up in price only at the rate of personal income inflation. Of course, this income-to-price control on mortgage amounts is further limited by movement in mortgage rates (and that brings us back to buyer purchasing power).
If growth was at 1% annually in California, we need additional housing via construction to accommodate that annual 1%. Further, when starts do not take place when the time is right for accommodating population growth, the prices go up to rent existing housing and to buy a home.
However, the homeownership rate will linger at and below 55% for years to come (at 55.3% heading through 2025 in California, down from the 60.7% peak in 2006). The long-term support needed from owner-occupants is lacking, evidenced by the long-standing downward trend in the homeownership rate.
Related article:
Due-on-sale assumption
Enforcement of the due-on-sale clause in trust deeds by mortgage holders will see a resurgence in the coming recession. Facing high mortgage rates, homebuyers will attempt to take over mortgages as all mortgages originated before 2024 have far lower interest rates than rates today.
Mortgage holders, eager to exact a higher yield on the below market mortgages they hold, will instinctively interfere with sales transactions. When alerted to a sale structured for a buyer to take over a mortgage, the holder will demand a modification of the mortgage at current higher rates in exchange for allowing the buyer to take over the seller’s mortgage on the property.
The greater success lenders have interfering with sales, the greater the drag on home prices. This will be a new experience for anyone not doing deals during the 1960s through 1983, the year mortgage rates peaked, then declined until they hit the historical low of 2021 mortgage rates. During that forty-year span, agents and their brokers didn’t experience buyers taking over existing mortgages because the interest rate was higher than the rate on newly originated mortgages. No past experience means no present awareness of what is to come in the years to follow into the 2030s and beyond.
When homebuyers are able to take over mortgages at their old, low rates, sellers can expect sales prices higher than those selling for cash or new mortgage arrangements.
As homebuyers are forced to take out new mortgages at higher rates or assume old loans at current rates, prices (and thus sellers) will face downward pricing pressure.
This due-on aspect of modifying interest rates under 1982 federal mortgage law has the exact same effect on pricing as buyer purchasing power changes when interest rates rise for new mortgages. The seller’s wealth is shifted to the bankers.
Cap rate movement
An income property investor strives to achieve their desired future flow of net operating income on an acquisition by determining the cap rate they need for the particular property under consideration. When not attainable, few will invest in real estate.
Capitalization (cap) rates always follow the long-term interest rate movement. That is, cap rates are set and applied on the perception of receiving a future flow of income. When mortgage rates rise higher, the cap rate will be higher too.
In turn, as the cap rate is increased, the price falls for income property under consideration, a simple mathematical procedure much different from the thinking of a homebuyer when setting their offering price.
Today’s acceptable cap rates will become tomorrow’s unacceptable cap rates. For example, in a market of rising cap rates, property values are destroyed when the owner is unable to raise rents, limited by the local demographics of annual increases in tenant income. Further, rent amounts are historically at about one-third of a tenant’s income. If not, the tenant’s standard of living falls below the level they expect and they move on.
Related article:
Investors of the speculator and buy-to-let types
Speculator activity such as bidding frenzies, multiple acquisitions and demand to acquire each newly available property during the depths of a recession snatch a majority of homes available for sale out of the reach of end users not able to hand over cash to the seller. This bottom fishing chaos further compounds the problem of pricing for all involved.
However, buy-to-let investors during a recession are a stabilizing influence on prices. They do not get caught up in the same sort of FOMO buying fever common to grab-and-flip speculators seeking a fast profit or the emotional buyer-occupants who find the home they want as theirs.
Long-term investors, acting on their own, will not pay too much for a property. For pricing, they rely on the simple math of a capitalization rate (the reciprocal being the net income multiplier or GRM preferred as a rule-of-thumb by agents and sellers, but not investors) to ensure they receive a market rate of return on investment (ROI). The analysis is based on the rental property’s net operating income (NOI), the age of the property, maintenance, component obsolescence, location, and the demographics of the local population.
Economic shocks
All of these factors get derailed and altered by economic shocks, like the deep-rooted 2008 recession and the short-lived 2020 COVID-19 pandemic recession. California’s broader economy works on home prices by weaving in and out of all the factors affecting home prices.
For example, commodities, like gasoline, will swing violently from month to month. When gas prices trend in an upward direction for a year or more, that’s when the price of property and rent begins to feel the effects as homebuyers’ wallets feel the strain.
Further beyond California’s borders, Wall Street is cyclically a massive influence on home prices. It has always been said that when Wall Street gets into real estate, and they do, they screw it up. A prime example is the Millennium Boom and subsequent 2008 bust, which all comes back to mortgage deregulation and decentralization permitting a return to past Wall Street financing games recurring now in 2025.
Take advantage of home price movement
All of these factors taken together initially make for a confusing picture of the housing market for the novice participant in real estate.
Look to buyer purchasing power to determine what direction prices will move in 6-12 months. When there are abnormalities in the market (like a high speculator presence or global disruption in commerce), then consider what that action will do to sales volume and prices as well. Agents who are aware of data for all factors influencing the future housing market are more likely to succeed in attaining their sales or leasing goals as transaction agents.


A lot of useful information and thoughtful commentary. However, residential real estate is local, and therefore state-wide numbers have little value compared to what is true in a given market. For example, anywhere within commuting distance of Silicon Valley has little difficulty with BPPI and values rise accordingly. While communities in the far north of the state, the central valley, and the Inland Empire in SoCal will probably take several more years to reach home prices like those seen in 2006. As the old saying goes, your money doesn’t have to live where you do!
Excellent Article. On line, it’s not available 4 the public.