
Why this matters: Real estate agents and brokers in 2026 are observing another year of substandard home sales volume following the 2021 pandemic buying frenzy. Even as FRM rates dropped over 80 percentage points in 2025, additional buyers did not come forward. Meanwhile, inventories of property for sale grew, and will eventually build up with a vengeance.
Homes for sale meet depleted buyers
In February 2026, California saw 18,500 escrows close for new and resale home transactions. Sales volume in February dropped 1.9% below the same month one year earlier.
Importantly for trends, year-to-date (YTD) sales volume through February 2026 decreased 3.3% from the 2025 YTD sales figure. This starts off a fourth year of flat to weak sales volume, with aggressive consumer inflation and static property prices insufficient to attract more buyers – and now a war-borne rigor mortis freezing turnover.
Recent home sales trends
Consider that annual home sales experienced literally no change from 2024 to 2025. More critically, sales volume in 2025 matched 2024 at 27% below 2019 — the last year in the pre-pandemic sales cycle.
Today, buyers wait until they sense the decline in pricing has passed, evidenced when prices bottom and begin to rise. Be aware your typical homebuyer today knows their math for income-to-mortgage leveraging to set home pricing, thanks to readily available insight.
The developing public uncertainty about political upheaval, trade taxes and immigration hostilities — and now a war — tamps down owner and tenant turnover, and thus sales volume. The property sales volume will suffer from this status quo type rigor mortis until speculators turn to the real estate market and stop prices from dropping.
Sales volume strikes at pricing
Watch for home sales volume to trail off during 2026, as the likely trend of another disappointing spring season results from buyer caution around increasingly troubling employment conditions. More changes are underway. The U.S. is shifting into an economy not unlike the mid-1960s and mid-1980s stemming from a heightened focus on resetting the military-industrial complex for a war economy which instantly suppresses user turnover.
When home prices decline across all pricing tiers, not just the high tier now underway, recent homeowners with little down payment can only watch as the equity in their home slides underwater. This price-to-mortgage crossover event is not likely to begin until a nationwide economic recession brings on a further drop in the number of Californians employed. Also, keep an eye on the slow upward trend currently underway with mortgage foreclosures, a force compelling owners to sell.
Sales agents can expect the current real estate recession to eventually bring about a return of real estate speculators after prices drop to produce a “dead cat” bounce in both sales volume and pricing. Within 12 months following the speculator-driven market bounce, home prices historically slip as homebuyers wait and watch as prices bottom during that period. It is then that a sustainable sales volume and pricing recovery takes over with the return of end-user homebuyers — and temporarily lower mortgage rates for lack of investment opportunities.
Updated April 2026.
Chart 1
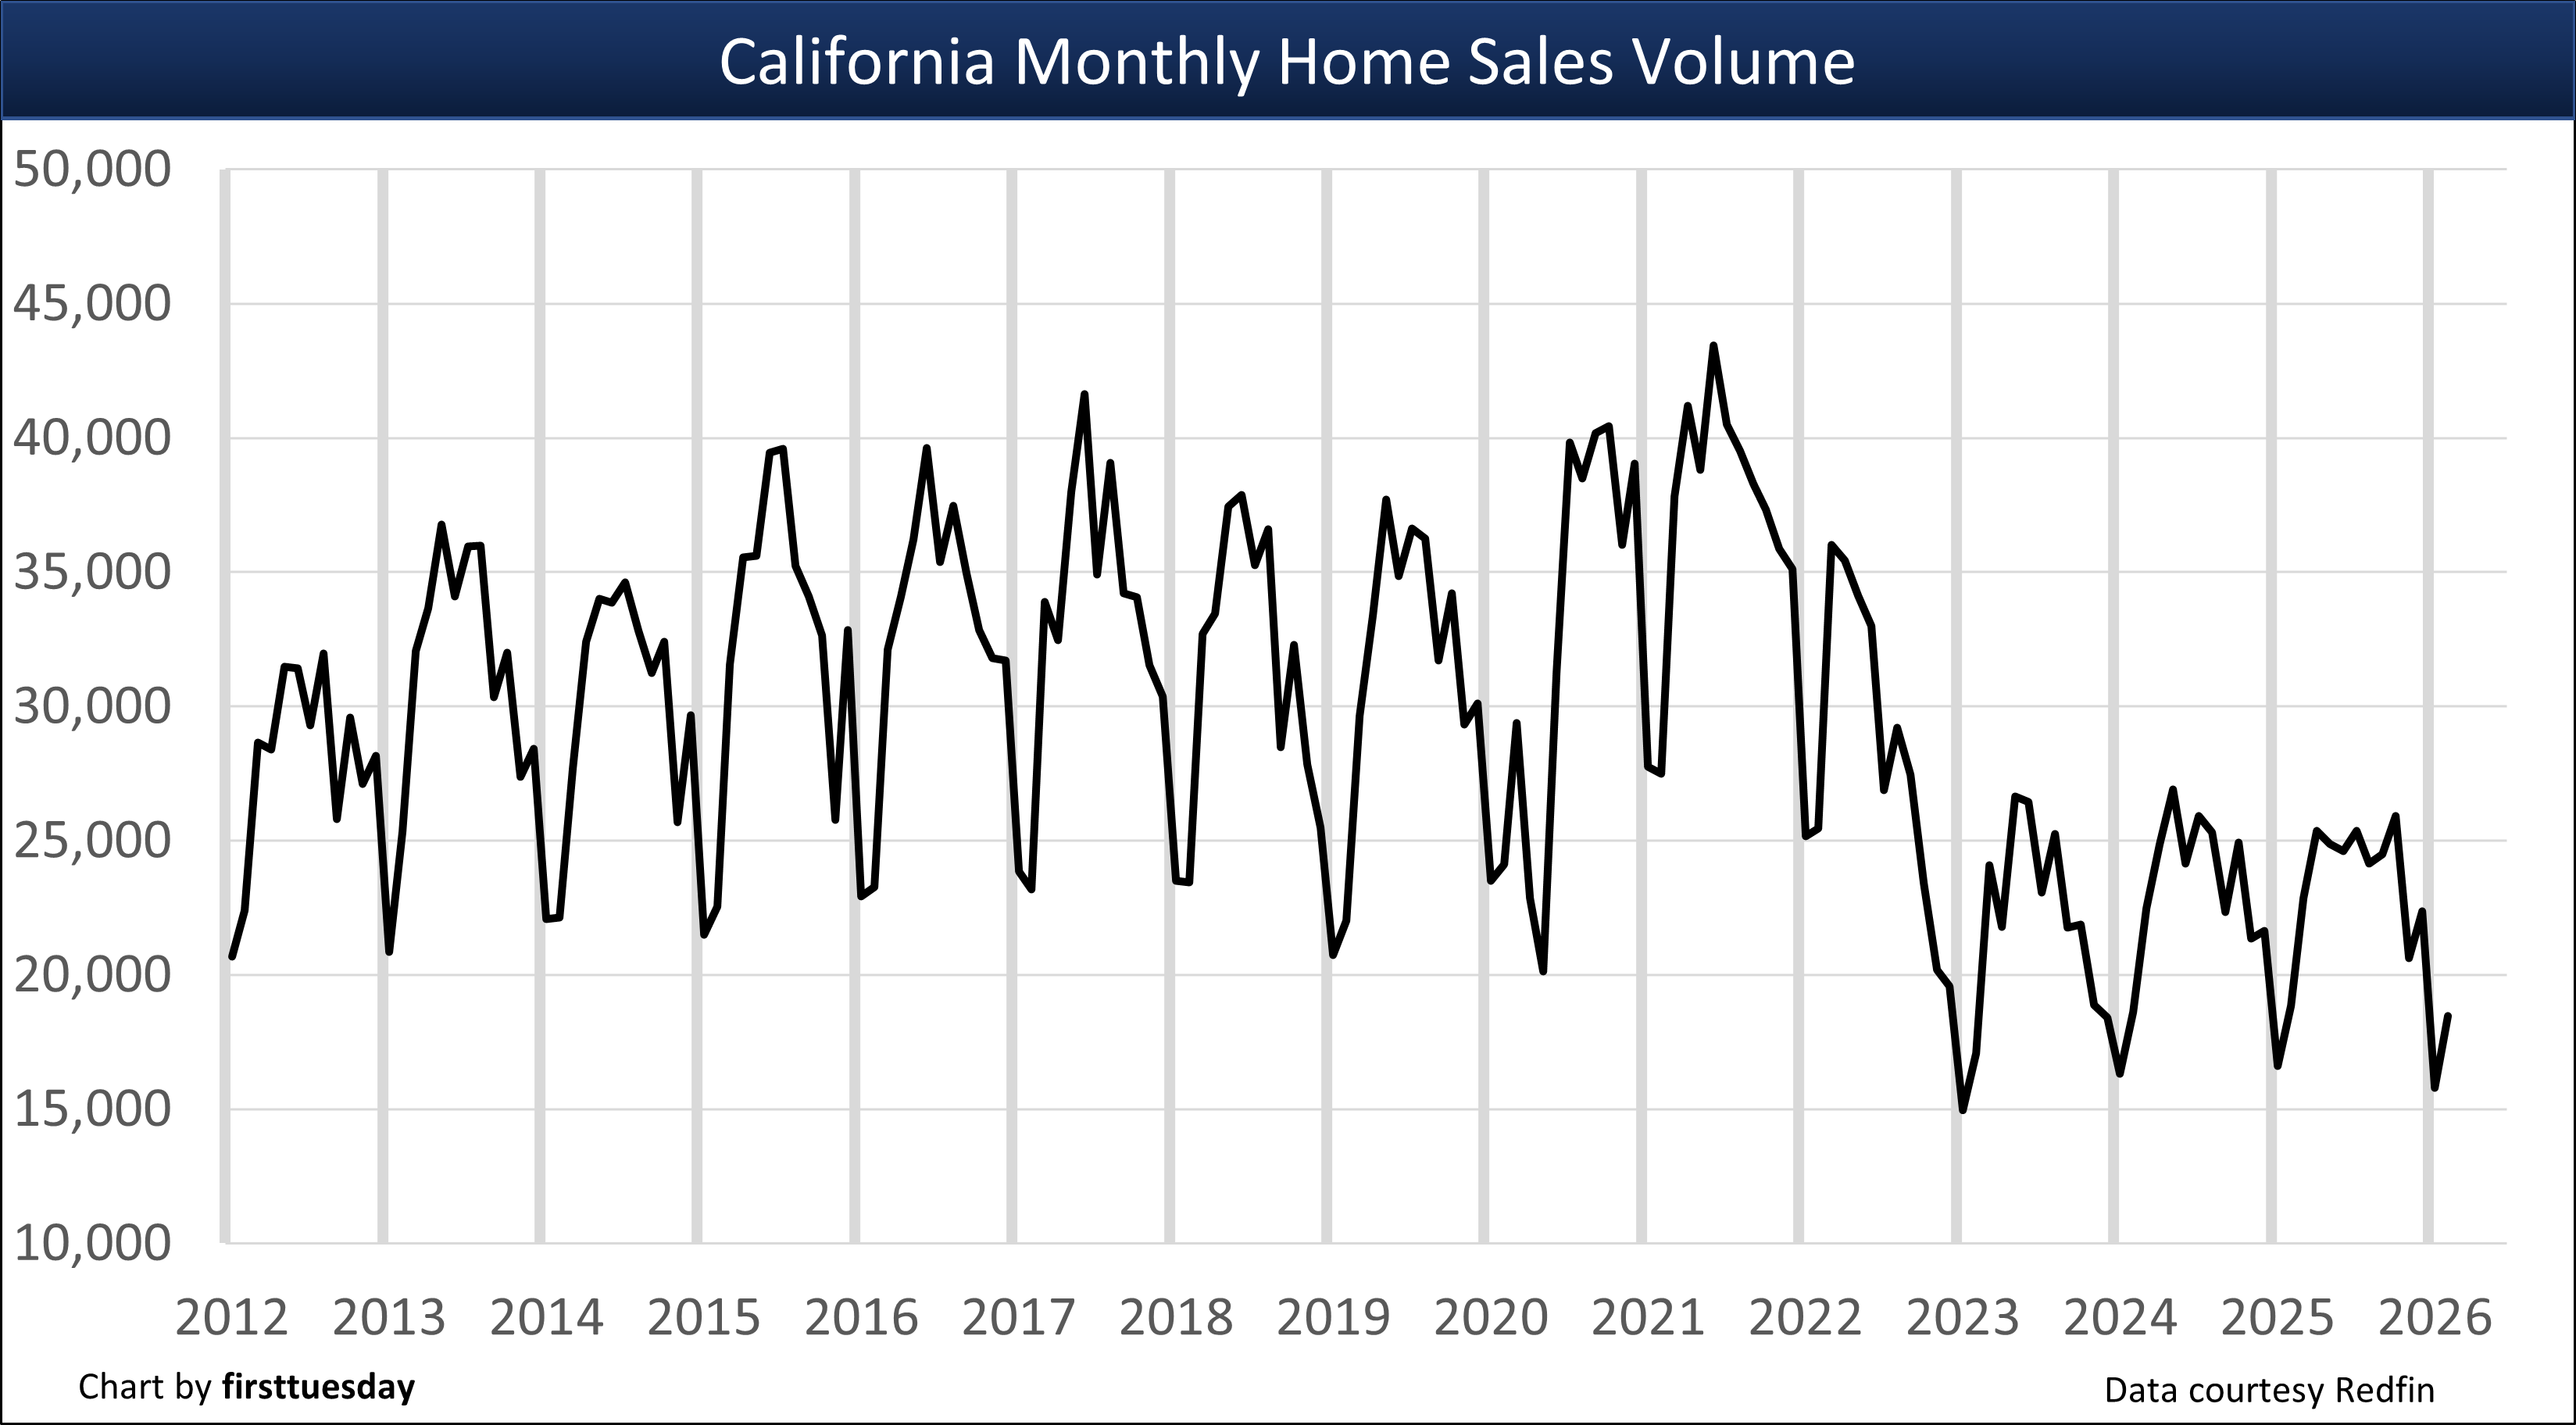
Chart update 4/2/26
Feb 2026 | Feb 2025 | YoY change | |
| California home sales volume | 18,500 | 18,800 | -1.9% |
Home sales fluctuate from month to month for a variety of reasons, all worth an agent taking time to consider. The most significant reason is the volatility of homebuyer demand. Several factors constantly at work moving the California homebuying market include:
- seasonal motivational differences, an annual cycle producing the spring bounce [see Chart 2];
- job market fluctuation;
- mortgage interest rate movement;
- homebuyer saving rates;
- home pricing sought by sellers;
- turnover rates for tenants and owners;
- negative equity property financials; and
- investor and speculator opportunity perceptions.
Seasonal differences in annual sales volume
It’s normal for home sales volume to rise in the first half of the year and fall after peaking around June.
Chart 2

Chart 2 shows average home sales volume experienced from 2011-2018, the recovery period following the Great Recession. As depicted, the month with the most homes sold monthly during the year close escrow in June. Another upturn takes place in December, as homebuyers seek to wrap up their financial activities before the end of the year.
Real estate agents need not fuss when they hear of falling month-to-month sales volume in the latter half of the year. It is the normal cycle of seasonal progression taking place. What to watch for is year-over sales, to compare recent months this year to the same months last year or compare another period such as year-to-date to best see a trend.
As a rule, current market activity, whether up or down, is reflected first in sales volume, followed in nine to 12 months by price adjustments in the same direction.
Chart 3
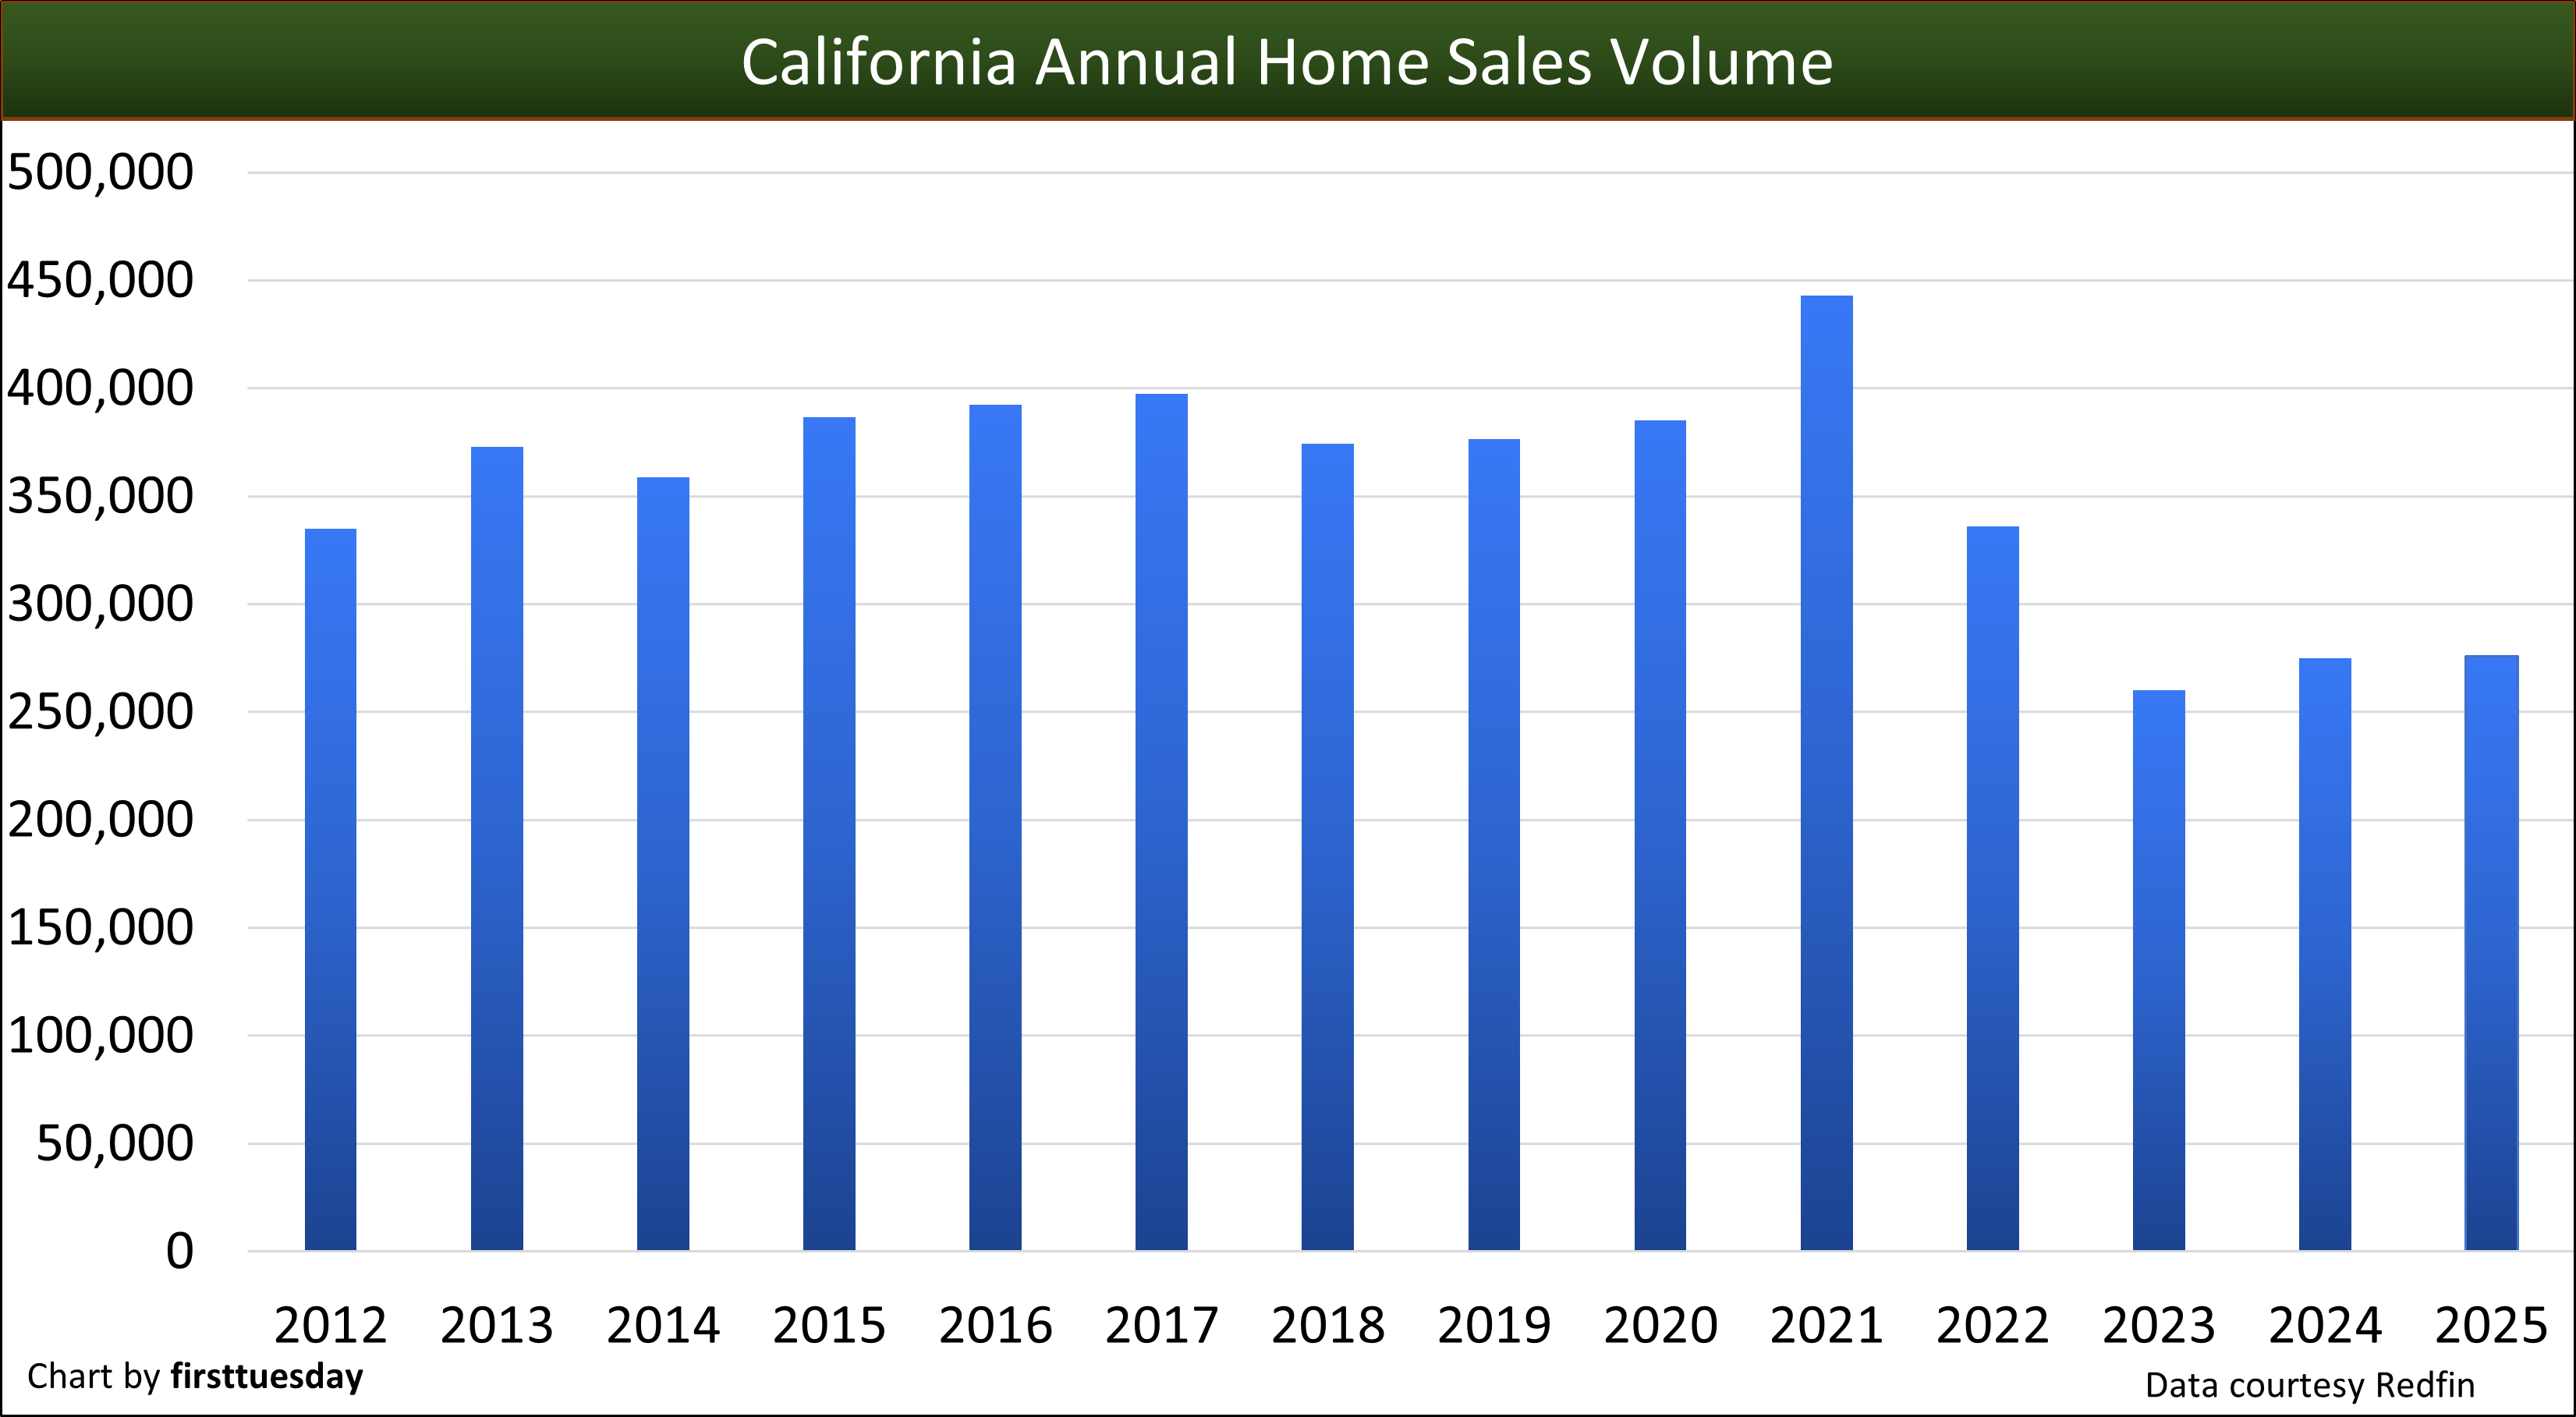
Chart update 1/26/26
| 2025 | 2024 | 2023 | Annual change | |
| Annual home sales volume | 275,900 | 274,900 | 260,200 | +0.3% |
To set the stage for a forward look, a review of sales volume in the recent past is helpful:
- 2022 home sales volume peaked early in March and lost all ground gained in the pandemic year of 2021, ending the year 24% below 2021, but only 12% below 2019, the last “normal” year for home sales before the pandemic upended market dynamics;
- 2023 home sales volume lost a further 22% over the prior year, the consequence of buyers pulled forward to buy in 2021 using historically low mortgage rates for funding;
- 2024 home sales stabilized from the prior year, suggesting the end of the ripple effect from pandemic economics; and
- 2025 continued the stagnant sales trend of the prior two years.
Chart 4
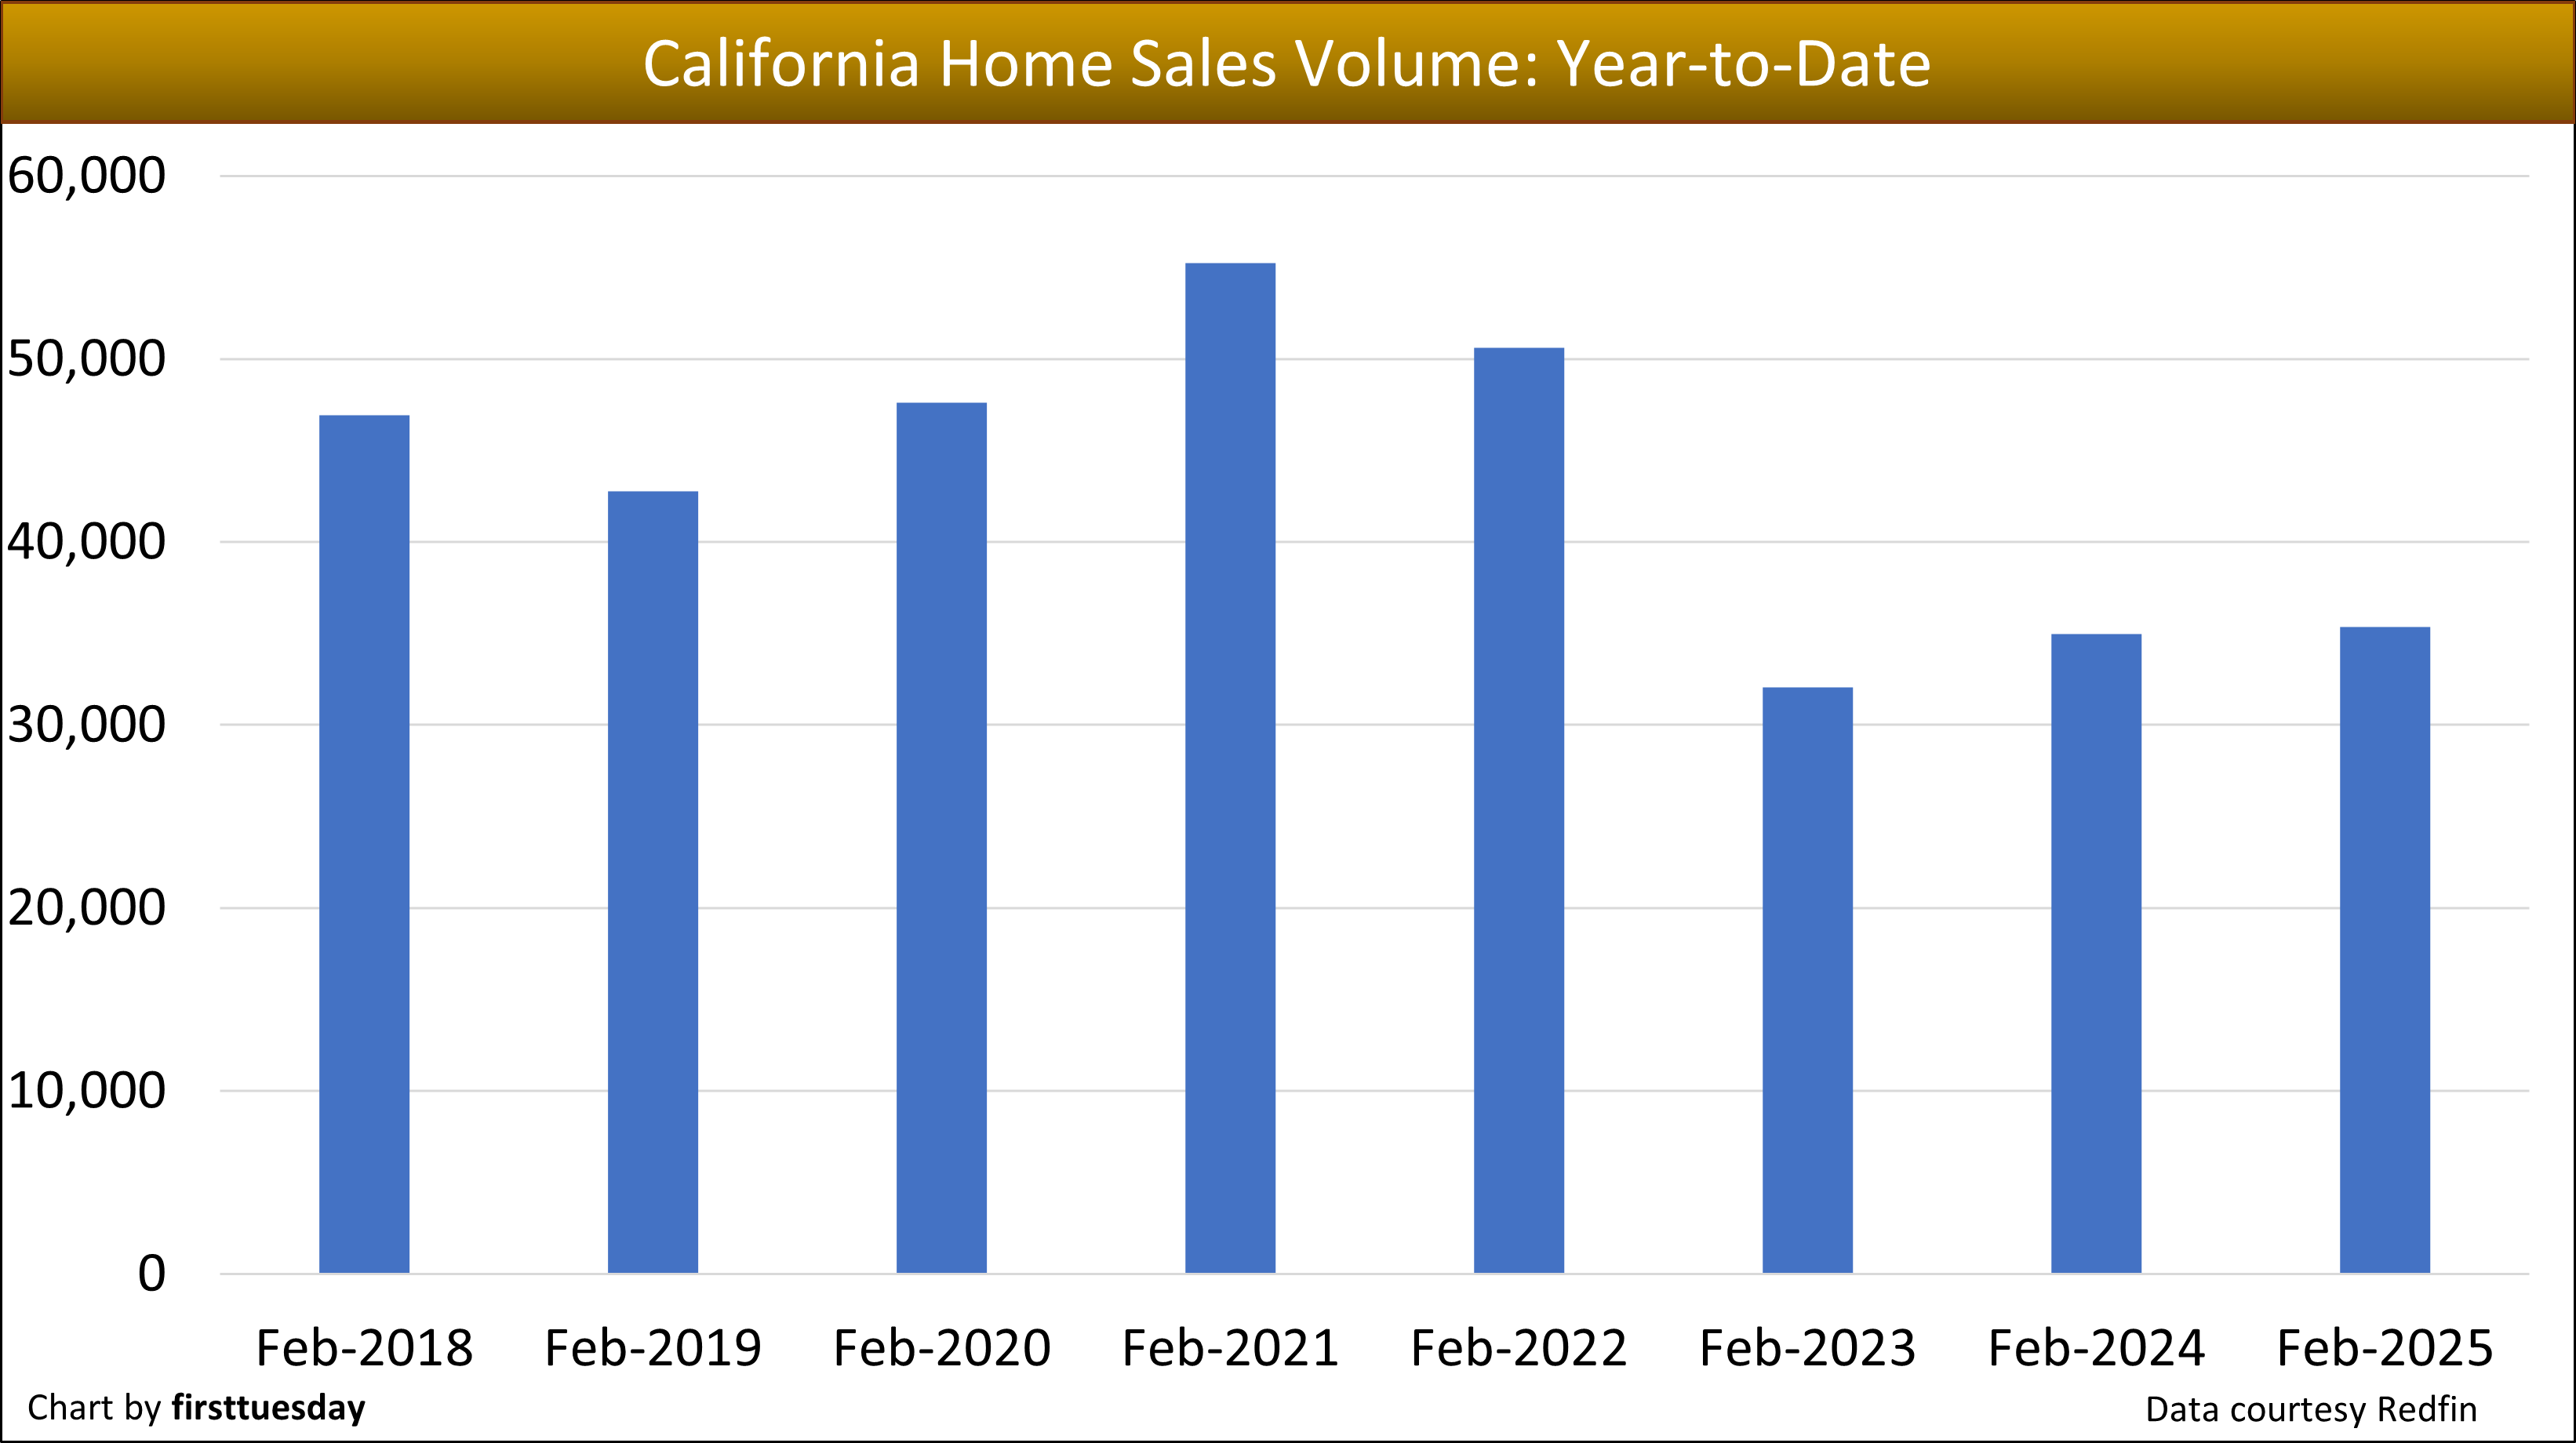
Chart update 4/3/26
| Feb 2026 | Feb 2025 | Feb 2024 | |
| Home sales volume year-to-date | 34,400 | 35,400 | 34,900 |
Year-to-date (YTD) home sales volume through February 2026 was substantially the same as the year prior. As of February 2026, YTD home sales volume is 3.3% below a year earlier. Compared to 2019, home sales volume YTD is 20% lower in 2026 as of February. 2019 was the last “normal” year for property transactions before the pandemic economy took over. The present annual trend in sales volume is flat.
Home sales volume now in 2026 will remain weak as in 2025, due to:
- job uncertainty in the wake of federal shutdowns, the US-Iran War and a disjointed flat rate of job growth;
- high mortgage rates reducing homebuyer ability and willingness to pay seller asking prices;
- a consistent quantity of all-cash buyers undeterred by interest rates or asking prices;
- reluctance of sellers to reduce asking prices to offset high mortgage rates;
- buyer agent failure to advise buyers to disregard asking prices and make offers at prices they qualify to pay;
- a steadily increasing inventory of property available for sale across the state causing buyers to wait to make a selection; and
- the real estate recession, yet to be declared, but four years underway throughout California.
Home sales in the coming years
The forward trend in California home sales is one of caution and delay for both buyers and sellers. Homebuyer income is growing but only keeping up with inflation, much improved from the less-than-inflation pace during the decade preceding the pandemic.
While wage increases caught up with consumer inflation, they were nowhere near enough to catch up with pandemic-peak home prices and post pandemic mortgage rates. Home prices remain far above the mean price trendline but the gap is narrowing as property prices run flat and wages increase.
The necessary price adjustment required to bring buyers to the table will be especially resisted by sellers’ pricing stubbornness, known as the sticky pricing phenomenon. The likely result is continuing the post-2022 plateau of flat pricing that will meet up with the rise in the mean price trendline rather than prices dropping much in 2026.
firsttuesday forecasts annual home sales volume for 2026 will slip slightly from the level in 2025, as buyers continue to wait on the sidelines. The sales slump in 2026 will be the result of the tandem high levels of asking prices, mortgage rates and financial caution.
Sellers are also competing against the rising strain of buyers comparing the high monthly cost of ownership and lower, declining rent rates charged by landlords for similar housing — which reduces turnover and transactions.
The timeline for a real estate turnaround faces complications not experienced in recent decades. Government trade wars are raising the cost of both domestic and imported construction materials. Costs of owning real estate are compounded by the federal attack on the necessary migratory labor force for construction and maintenance of homes. And now another American war in the middle east.
The competitive broker
What’s a broker reliant on home sales to do until home sales volume provides abundance again?
SFR brokers and agents might consider adding transaction-related services to supplement their income in the present buyer’s market. Those who do add related services — provided only when the client signs a representation agreement — will restructure their practice as “all-service brokers.”
Transaction-related services originate primarily due to representing buyers, not sellers. When an office operation includes any of the services provided to buyers, their agents maintain a standard of living, remain solvent and position the office for eventual growth. Notary, anyone? MLO?
Related video:


Can you be any more specific about the effect of rising interest rates on prices ‘expected’ in 2016? In other words buying now in 2015 would one expect to be underwater in a few years depending on the change in rates?
Ann,
Thank you for your inquiry! Historically speaking, when mortgage rates rise homebuyers become discouraged and sales volume declines, usually within six months. As sales volume falls back, home prices likewise fall within the following 9-12 months. Therefore, first tuesday expects pricing to decline in 2017.
However, to answer your question about underwater homes, prices aren’t expected to fall very far in 2017, nor will they be down for long. Economic action is pointing towards a solid recovery beginning in 2018, and by that point we will likely be heading into our next housing boom, expected to occur in 2019-2021. Therefore, if a home goes underwater due to decreased home prices in 2017, it will likely regain positive equity quickly.
Please read more about the anticipated rise in mortgage rates here: Why fixed mortgage rates won’t rise (yet), despite Fed action. You may also read specifics about our forecast for the real estate market here: California real estate almanac: past and future.
Regards,
ft Editorial
Are there any granular data regarding shadow inventory? How much percentage are true speculator or flippers, and how much are for parking their money as safe investment comparing to their home country, ie. China? What about the institutional purchase of foreclosure properties? do they rent out those properties, or resell at a later time,? These unknown forces have disrupted California real estate market for the last few years and partially blame for inflating home prices.
Dave,
CoreLogic provides information on the percentage of absentee buyers and real estate owned (REO) properties.
CoreLogic also provides data on shadow inventory occasionally. To the best of our knowledge, their latest report is here: A new source of shadow inventory.
For information on investors from China, please see our article: Chinese stock market crash motivates investors: true or false?
To read more broadly about foreign investors in California’s real estate market, see: The global economy’s effect on local real estate.
Thank you for your question!
ft Editorial Staff
Does the analysis reflect any concern for the impact the California drought may have on housing activity / home prices over the next several years?
Can’t believe that we are in the worst threatening situation in the state’s history and this article refuses to recognize that buyers will not purchase a home if:
They have much higher water bills
Water restrictions
Water penalties
Water brown outs
or no water at all
What is the world does the author think is happening all over the state. There is only one last chance and that is El Nino this winter. If that doesn’t yield mega results in rain and snow, then all bets are off and so is California because it most likely is in a mega drought.
I’ve thought about the drought effect…and I’m torn between two scenarios: One, the state will suffer economically, and eventually have a negative impact on real estate prices. Two, cities will heavily restrict growth because of our severe drought. Scenario 2, to me, is the most likely, and that would DECREASE inventory compared to population growth leading to even higher R/E prices. While it is true that water is a tremendous issue, I see people willing to let their lawns go completely dead and perhaps skip showers to live here in Southern Cal…it’s crazy, and it probably always will be. Then again, there was the collapse of 2008. Who is sage enough to figure this out?
WRONG!
Absolutely wrong analysis. I have been a broker
for 34 years in Los Angeles. This post is so far removed
from reality I could write a book tearing it apart.
Why don’t you people give up forecasting real estate prices ?
You have NEVER BEEN RIGHT. NEVER.
AGREED.
So what is your forecast ?
Thank you for this informative, in depth analysis. This data is very helpful when trying to put current local market data in perspective.
Its all about location. Here in the Bay Area, housing sales are out of control once again with multiple offers and homes selling within days of listing. I’d like to see the chart for this area specifically. Of course other (inland) areas suffer massively and will continue until as you said, employment expands greatly and regularly. But there’s magic in the Bay Area and specific smaller locations.
Thank you very much for the information on house market trend as well as brokers and real estate agents fall.
stella song
You list your source as MDA DataQuick. If you will check with DataQuick, you will find they are no longer owned by MDA. It’s always nice to properly reference your sources.
It is indeed! Thanks for bringing this change to our attention. We’ll see to it that our attributions are updated accordingly.
Always great information!
Thanks much!!
My thanks to Bradley for the research and information provided in the article. Historic trends lend themselves to greater understanding of the factors involved in the movement of markets. I went straight from this article to investigate the “charts” section. Good information–leads to good insight. Susan Carter
It seems at this point that the trend was downward but since January things have picked up. When the interest rates were lowered the housing market jumped a bit and since has leveled off just as interest rates have.
ft Editorial Staff:
Thanks for the invaluable lists of important facts that will direct the business decisions of Real Estate Brokers over the coming years. All of your journals are spot-on subjects for surviving this current R. E. Cycle. But this journal gives the lists that a Broker will need when making a business plan. I am studying for my Broker’s Test now.
Sincerely, Ed Reisinger