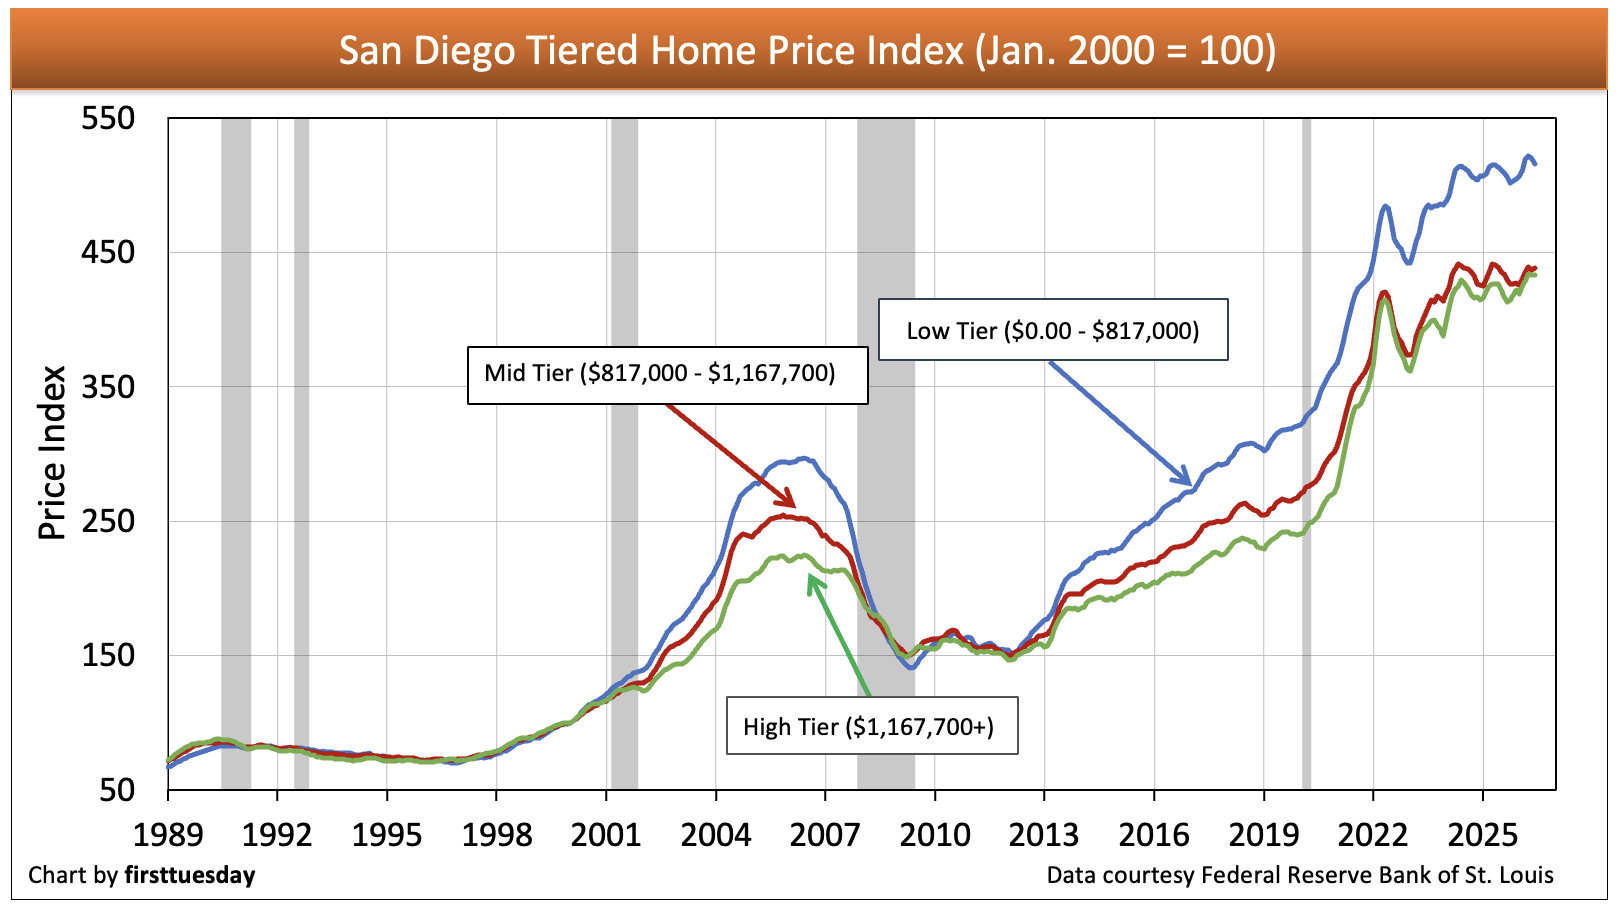
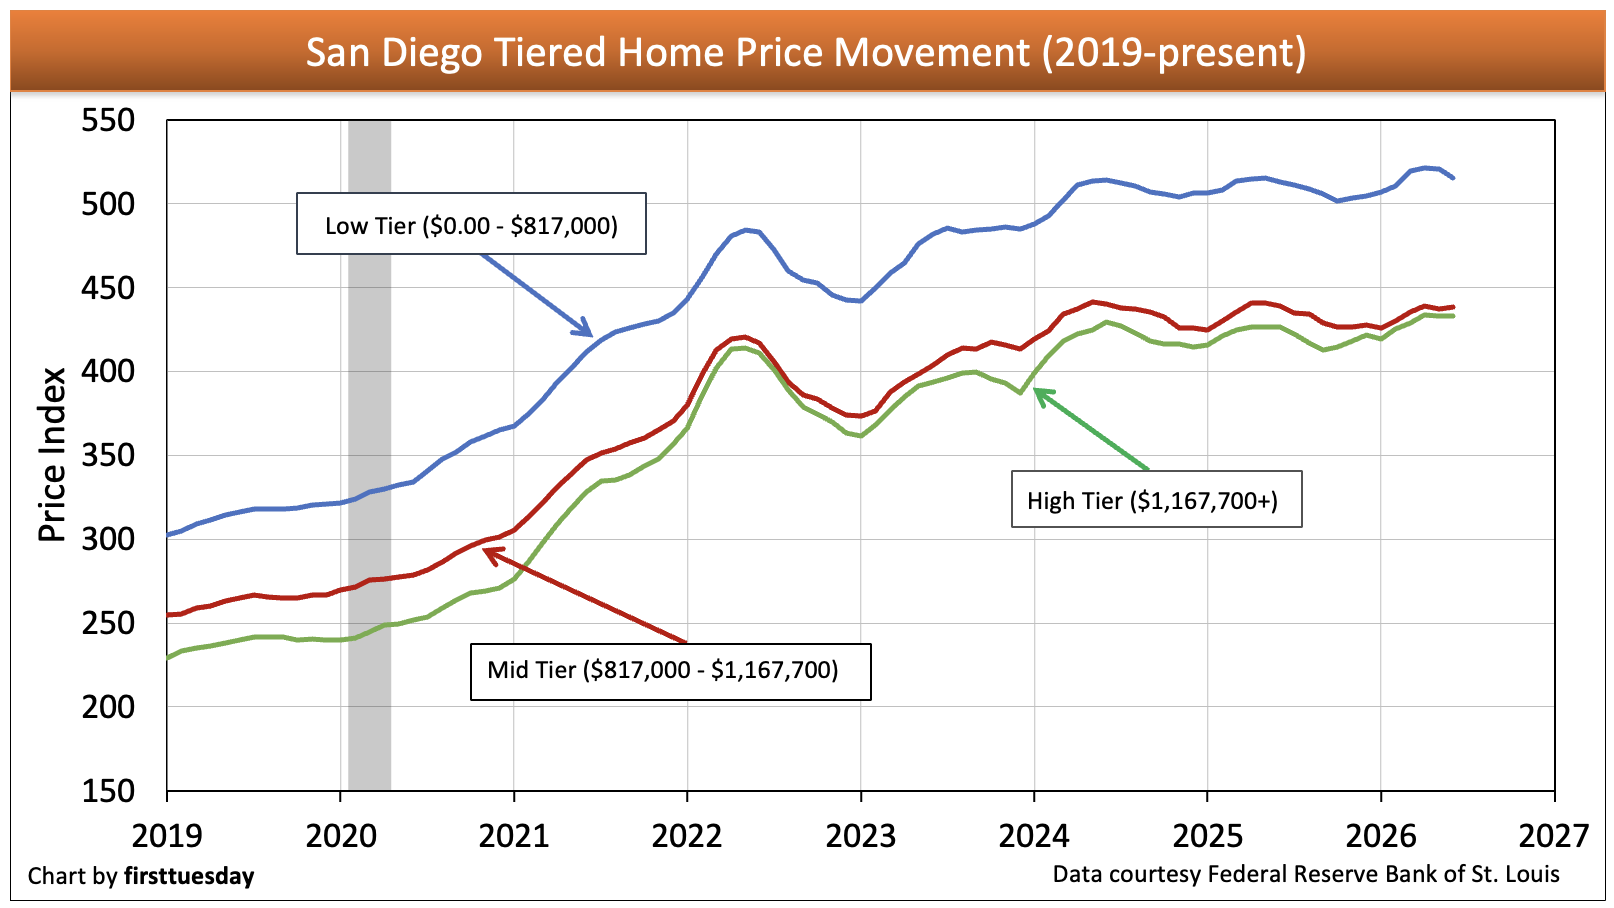
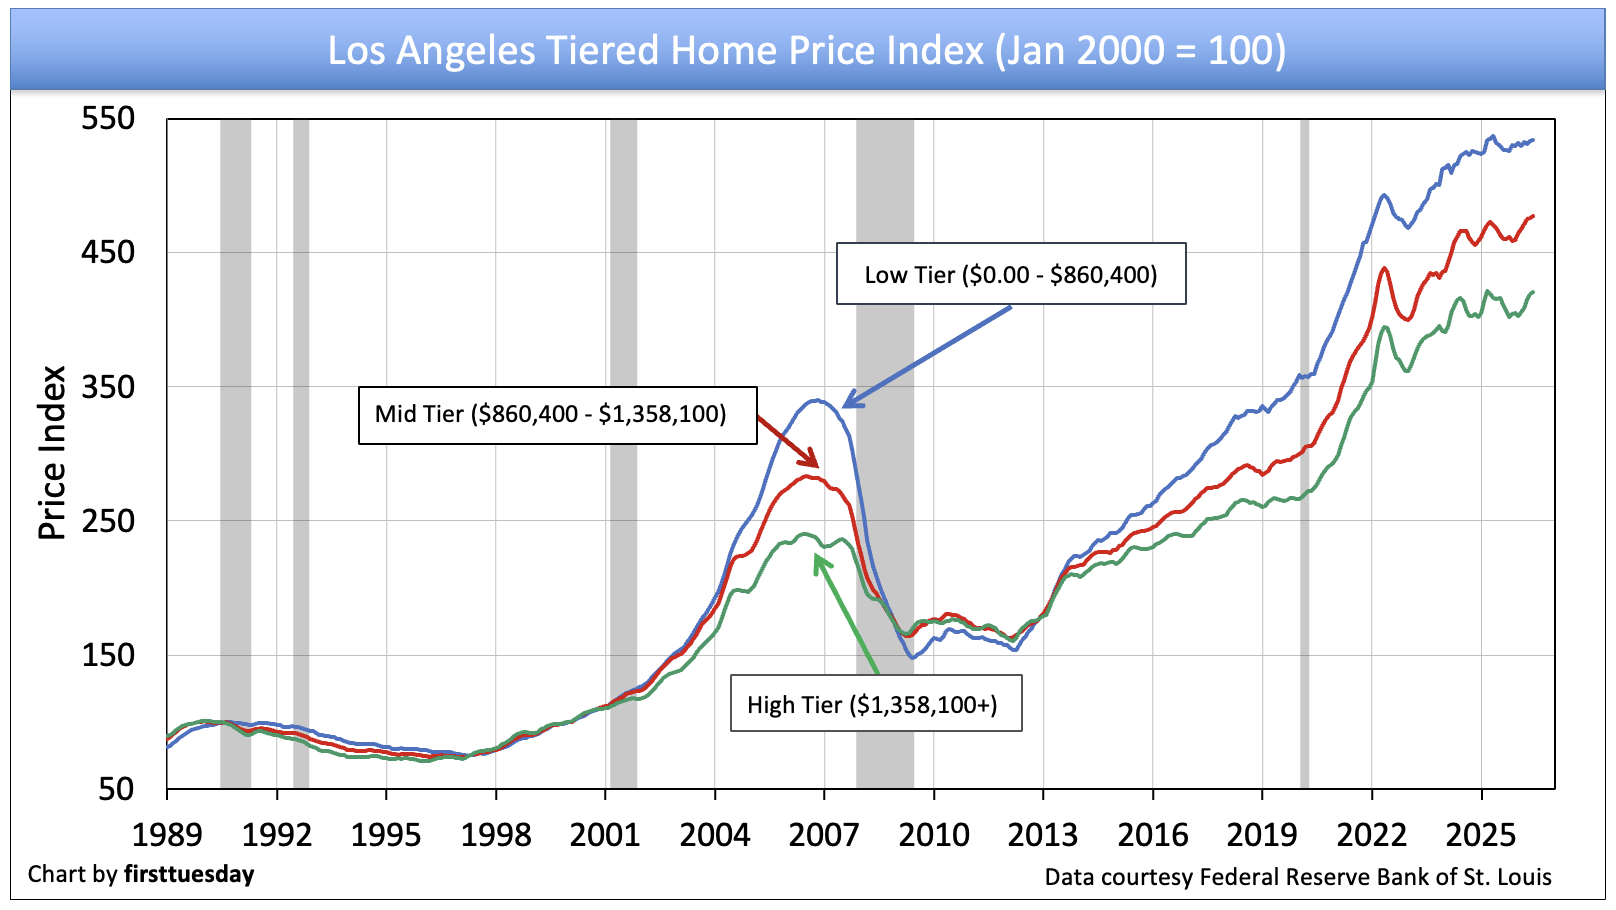
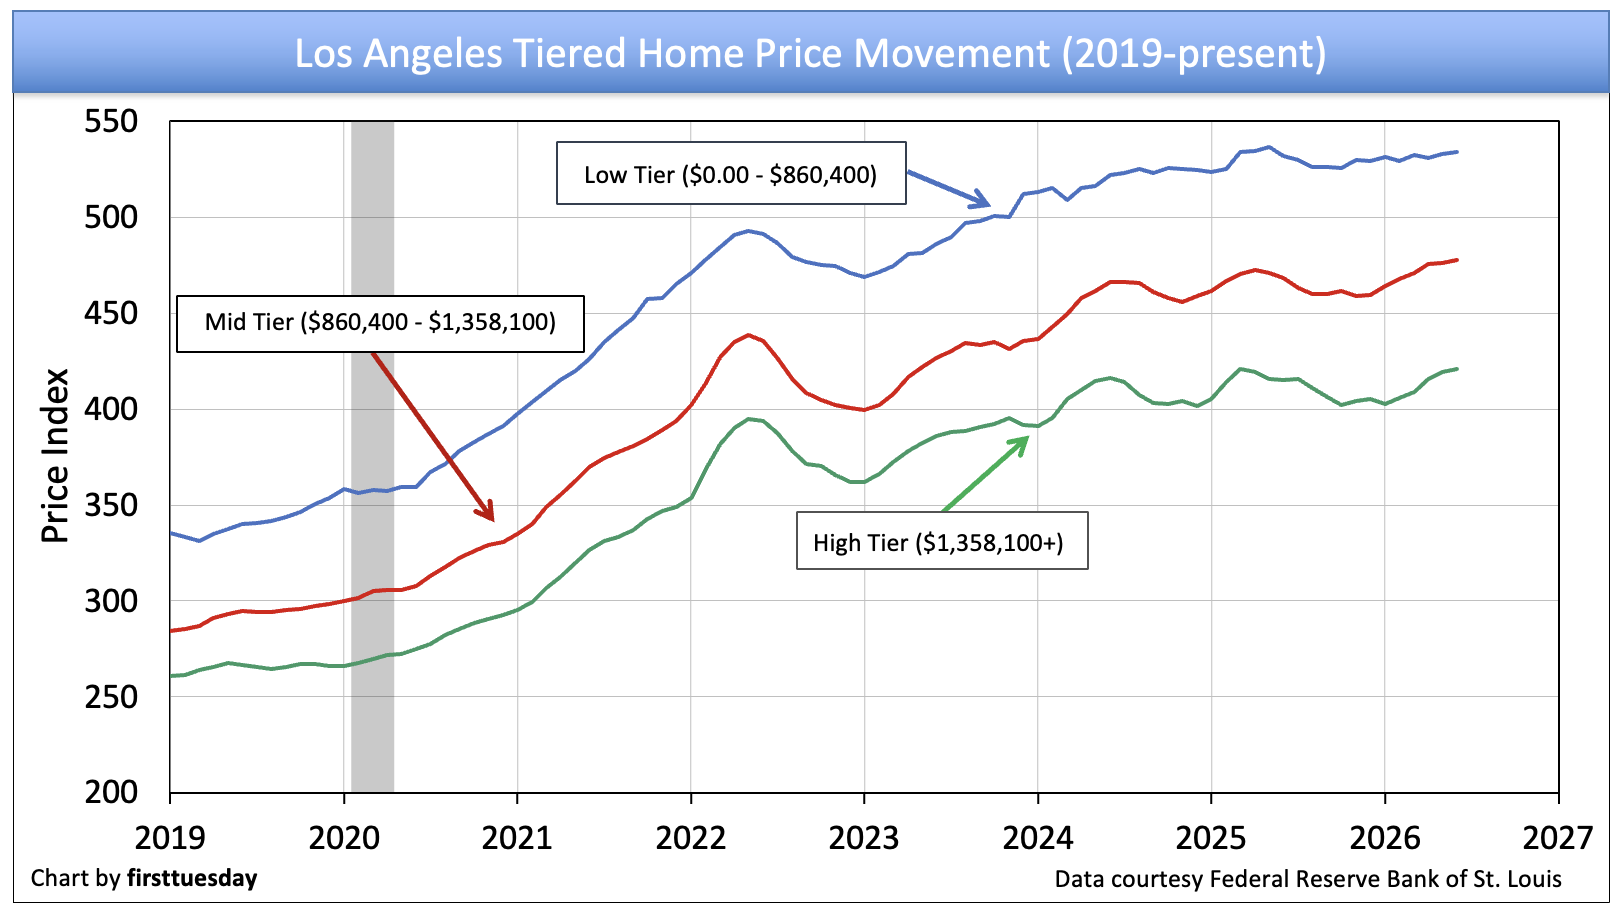
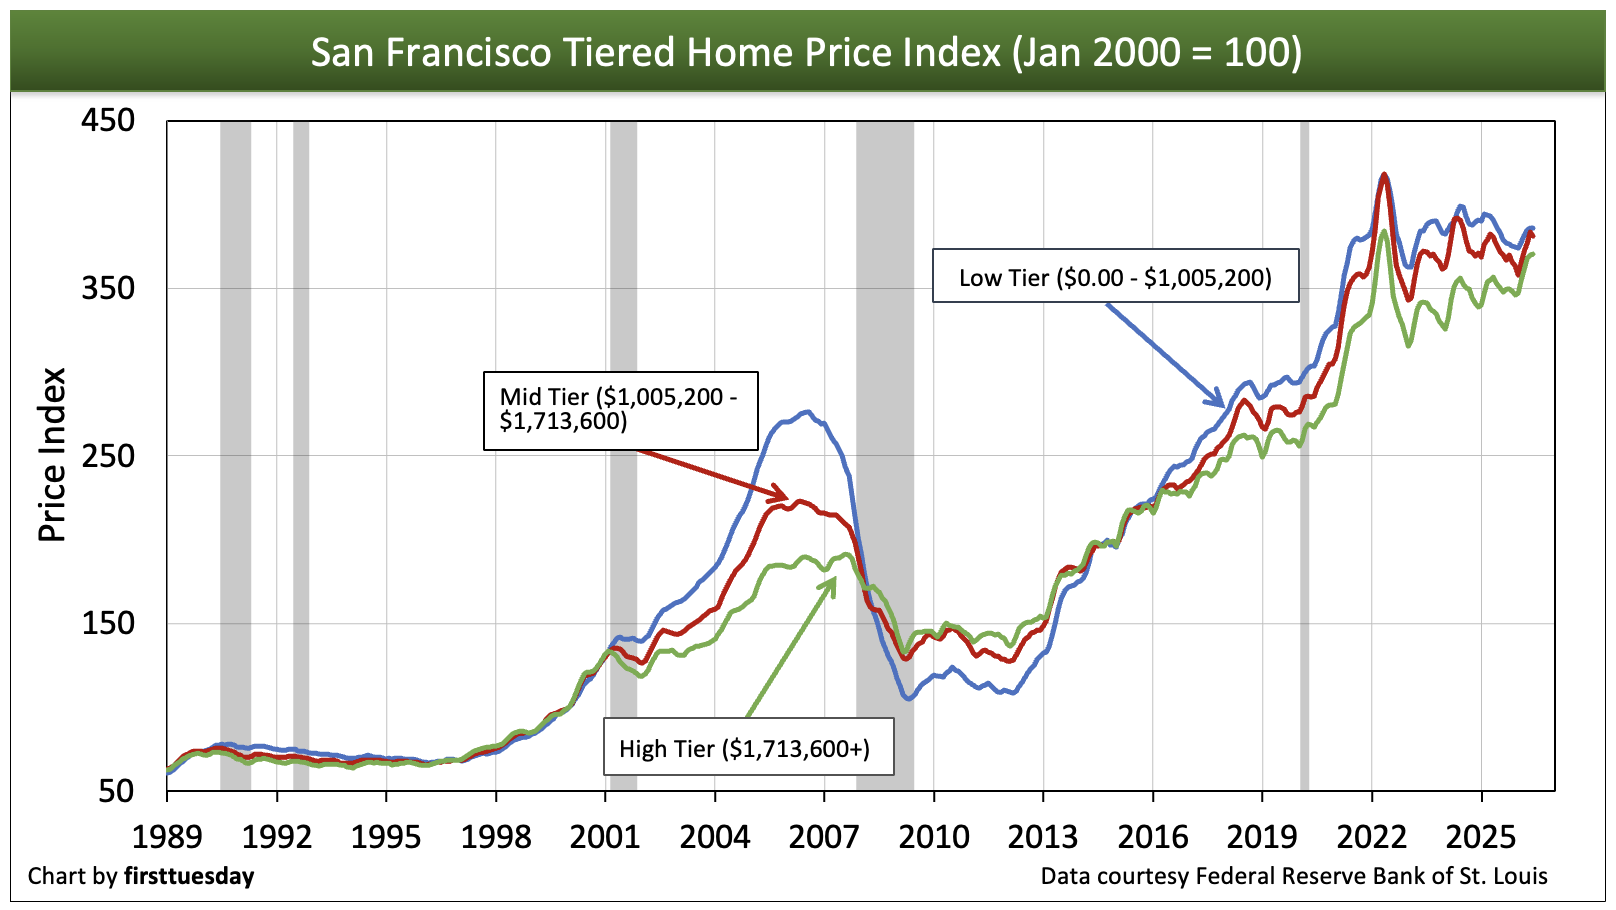
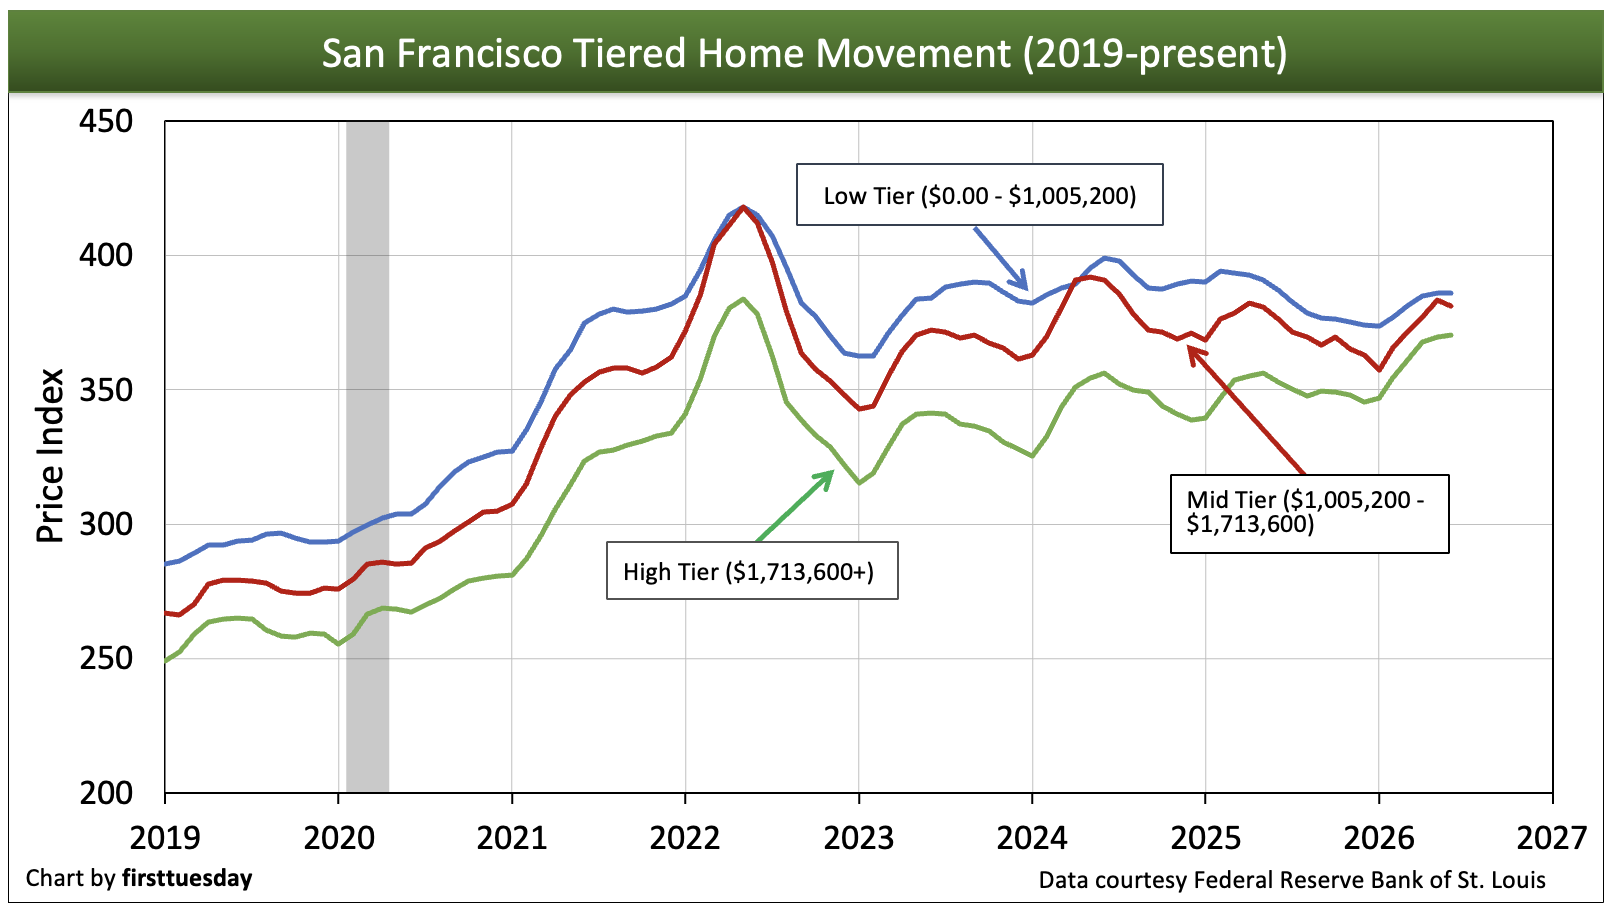
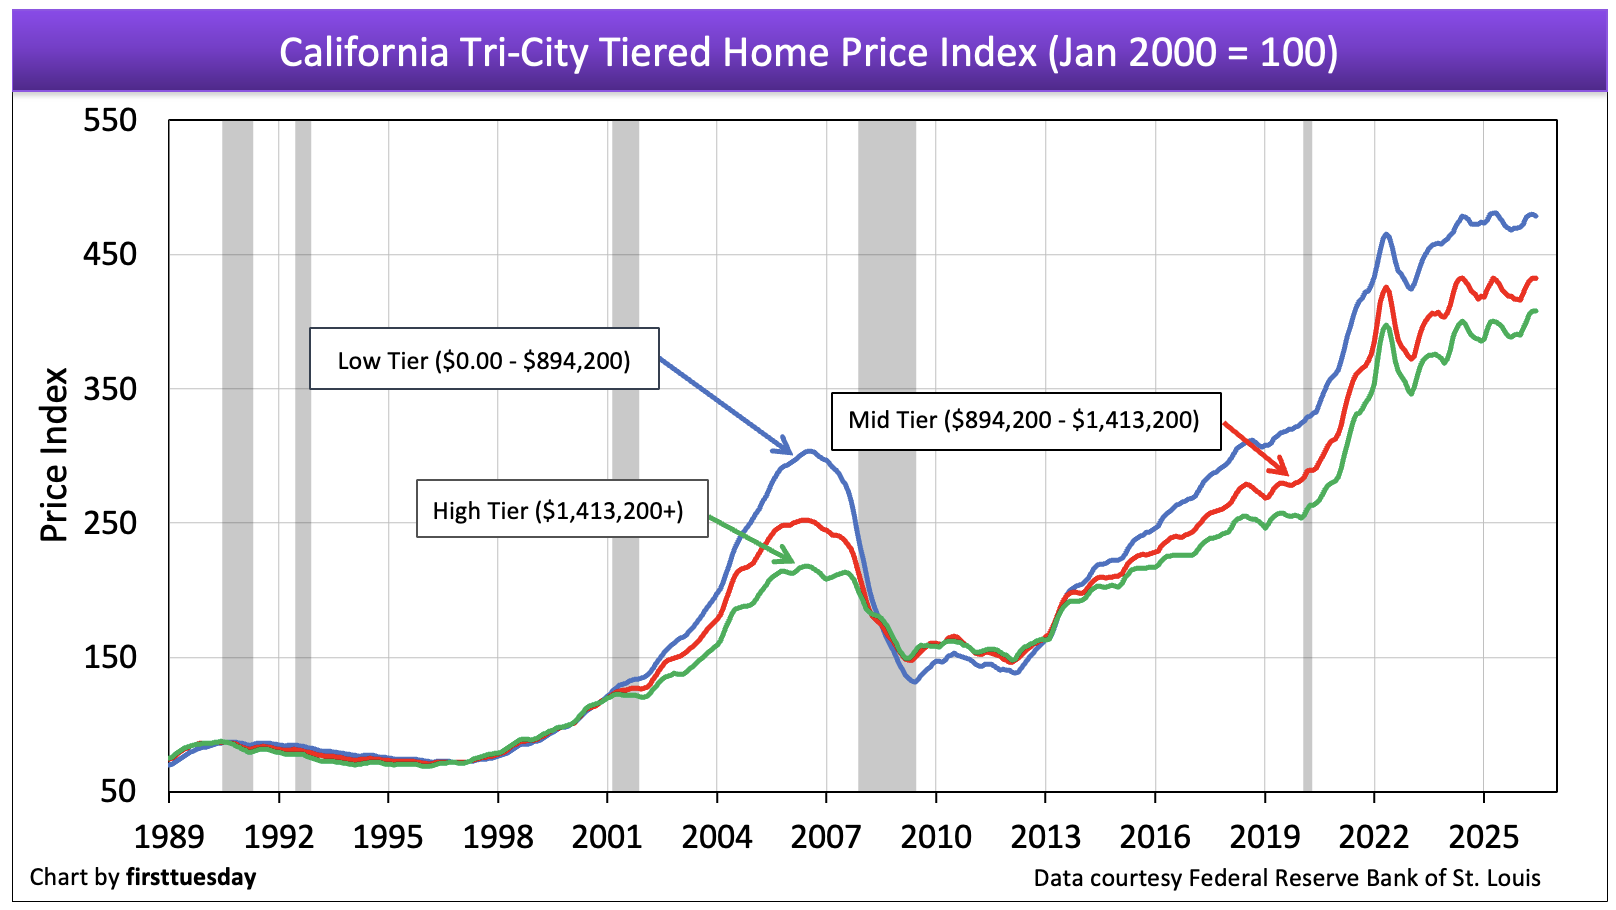
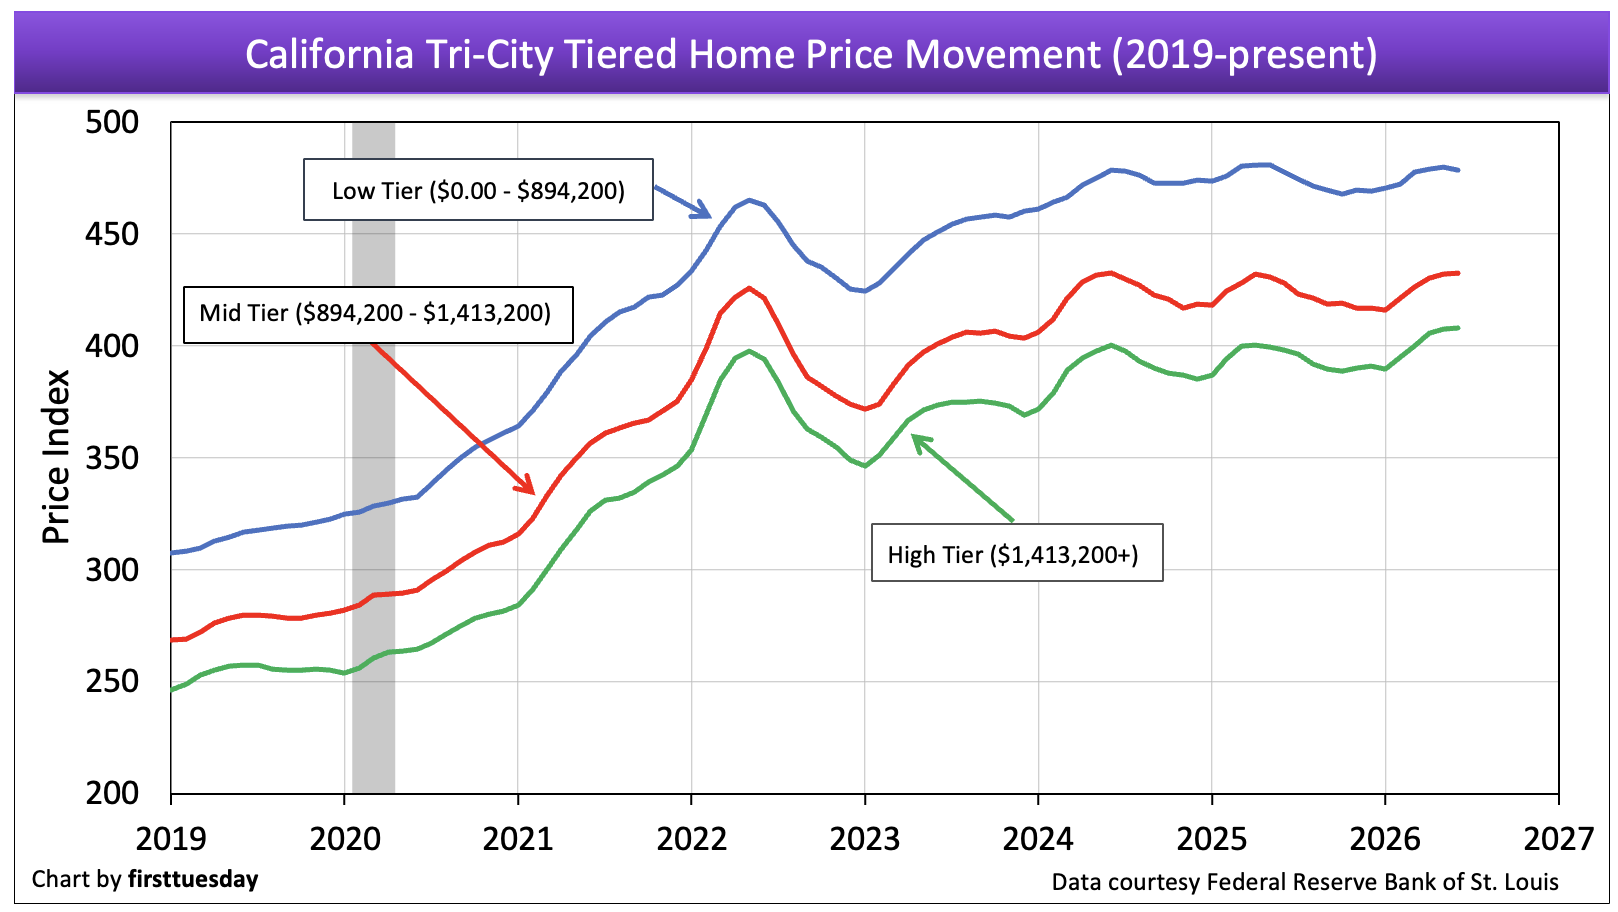
The above charts track changes in specific tiers according to the Case-Shiller price index, which is based on the sale price of homes, thus displaying how different ranges of house prices in the market perform in comparison to one another.Portrayals of pricing in California take many forms. The index figure is particularly useful as it displays relative price movement rather than a misleading dollar amount which actually fits no single property. Unlike many media sources, first tuesday shuns the simplistic median price approach. That approach tracks all home prices as a single tier by assigning them one average price. This one-price-fits-all dollar amount looks good on paper, but means nothing in the real world since it is a mathematical abstraction. Neither the actual nor adjusted median price represents the price of any single property.For the vast majority of properties sold or for sale, the median is a mathematical distortion.Brokers seeking the actual value of a specific property would do well to remember that there is no such animal as a “median priced home” — you simply cannot find it. Median price is a statistical point which fails to work in the analysis of any price-tier analysis of properties, much less an individual property.To determine how real estate will actually behave in the future, you cannot compare the price of a low-tier property with that of a high-tier property. It’s just common sense: properties in different tiers move in price for very different reasons. Although the market tends to move in the same direction over time, the percentage of movement can vary greatly from tier to tier.The best way to initially evaluate a property and set its price is to study comparable property values in the same demographic location (same house, same tract). Other ways to set the ceiling price, beyond the lowest of which one should not agree to pay for a property, include:
- cost per square foot (replacement cost); and
- income analysis methods.
Numerical alchemy in a median price for all
The attractively simplistic application of a “mathematical abstraction,” as in median price reporting or a comparison of median prices over time, will never produce as useful a result, since the arithmetic is being applied to an asset which is as unique and variable as a parcel of real estate distinctly different from any other parcel. The overall median price also gives an erroneous representation of the pricing of property in the market. The rate and extent of changes in property value prices varies dramatically both within and between low-, mid- and high-tier properties.
While prices for low-tier properties are most volatile, generally changing quickly and dramatically as depicted in the charts above, high-end properties are slower to react to the rise and fall of the market. Different tiers often move in opposite directions at the same time, and when upward or downward price movement occurs, each tier experiences a different percentage of price change.
Related articles:
Home sales volume and price peaks
The equilibrium trendline: the mean price anchor
Financially illiterate homebuyers in distress – agents to the rescue!
For more accurate and refined data that gives a reasonably meaningful picture of market pricing, tiered pricing charts like those shown above offer a more sensible source — but not the best.
Return to sanity
Now that the housing price bubble of the mid-2000s has burst, we need to know more than ever about the economic factors that cause real estate prices to move quickly or slowly. Also important is whether those factors affecting price can help us predict the speed at which different segments of the California real estate market will recover.
When Japan’s real estate market collapsed in 1991-1992 following its last financial crisis, prices dropped in both residential and commercial real estate, and continued to drop for a decade, dragging government-supported banks with them.
However, when Japan’s commercial real estate prices fell, they dropped dramatically faster and further than prices for owner occupied residential real estate. If the Japanese crisis-reaction precedent for sustaining insolvent “too-big-to-fail” banks is the track our government stays on, we can expect similarly dilatory results in our own real estate market.
Price persistence and illiquidity are the two factors thatEconomist John Krainer uses to explain price movement:
Price persistence is the tendency of listed prices in owner-occupied real estate to resist change, staying high even when the market for resale homes has dropped, a condition more commonly called sticky prices, downward price rigidity or the money illusion.
Related articles:
Asset Price Declines and Real Estate Market Illiquidity (from the Federal Reserve Bank of San Francisco (FRBSF)
Illiquidity refers to the corresponding inability for an owner to cash-out on the sale of property, one factor in a vicious cycle which causes price stagnation and inhibits recovery from a financial crisis and recession. Greater liquidity, when buyers and sellers can easily obtain money and get rid of property at agreed upon prices (read: market prices), leads to a more volatile market, for better or worse.
In the case of a market collapse like that which has been underway since 2006, home prices are unable to stabilize — bottom out — until property pricing comes to reflect cash values. On the other hand, price persistence (sticky prices) of sellers can cause property values to remain artificially inflated long after a collapse has occurred – until the cash price is finally established.
Search frictions and debt overload hindrance
The reluctance of prices to adjust quickly to real financial conditions in the real estate market is due to two causes. The first cause is the difficulty of finding a property through a gatekeeper such as a broker, agent or builder, and then agreeing to an appropriate price, called search frictions.
In the hunt for a home, these search frictions make it far more difficult for properties to change hands and prices to be negotiated at current market rates. This prevents deals from being made when making a deal is what everyone has in mind. Thus, these frictions hinder the speedy resolution of a financial crisis, and work to the future detriment of the multiple listing service (MLS) environment.
Seller’s agents could be hugely more helpful by figuring out what it is they are selling, the due diligence rub that they so far are finding difficult to act on.Then prepare a humble package about the conditions of the property improvements (TDS/NHD and reports), its title, its operating expenses, neighborhood statistics and the like for the buyer and the buyer’s agent to be able to make fast decisions.
The second cause of this lag is the crippling load of debt underlying so many California homeowners which makes leaving a property (for those who must relocate) more difficult, one cause of an enduring recession, called debt overhang. Excess mortgage debt on a property forces buyers and sellers to ascribe distorted values to the real estate, part of the money illusion driven by property debt.
Restabilization of real estate market pricing and sales volume to meet the current economic reality, a prerequisite for the commencement of a recovery, will be almost impossible until the mortgage debt overhanging property owners can be matched by the property’s value (called asset inflation),or reduced to that value (called a loan cramdown modification)
Related articles:
Cramdowns, cramdowns, cramdowns!
Home financing, mortgage-backed bonds, and the Fed
NODs and Trustee’s Deeds: less depressed but still grim US homeownership: an international perspective
Ultimately, negative equity homeowners are forced to become more financially rational. The FRBSF’s study indicates that if a shock to real estate fundamentals occurs, such as the artificial increase in homeownership funded by the mid-2000s subprime mortgage boom, then the steepness of the initial homeownership price drop in the recession and the speed of homeownership’s eventual price recovery both depend upon the prices brokers choose to set for a property’s dollar value.
Property caravans serve a useful purpose
When brokers can broadly agree upon an appropriate price, property values will reset constantly to their basic worth — cash values — without prices and sales volume rocketing to the artificial heights of a housing price bubble or the artificial lows at the bottom of the bubble’s collapse. Thus, the historical (long-term) trend line of property prices will be more closely maintained from year to year; boring, but better for the livelihood of all involved.
However, the combination of search frictions and mortgage debt overhang tends to make property owners reluctant, or simply unable, to sell for the property’s fundamental value (the “true cash value” of the property at any given time), especially in negative-equity, owner-occupied residential real estate.
Instead, sellers keep their homes on the market longer, hoping in many cases to avoid default, fishing for the rare buyer who might be willing to pay a higher price. Seller’s agents in high-end properties tend to pander to these instincts. This leads to price stagnation, in which the fall of prices is unnaturally prolonged: not a good thing, since it greatly extends the length of a market collapse, as it did in Japan in the 1990s and Mexico in the 1980s — and appears to have done in California’s high-end properties that, with the exception of the Bay Area, are suddenly much lower (and replete with foreclosures).
If only we could stick to a cash price
Japan’s financial crisis of 1990 included a collapse in both commercial and residential property values. Income property prices were especially volatile throughout the collapse, ultimately falling faster and deeper than owner-occupied residential prices, but bottoming sooner since investors are more rational. Owner-occupied residential real estate, which had a much higher variety of pricing and a greater burden of debt, also eventually fell catastrophically, but less dramatically.
The difference in price movement is because income producing real estate is more easily evaluated (by capitalization rates (cap rates), income flow, and replacement costs) and typically less burdened by high loan-to-value (LTV) debt ratios so equity remains to be worked with. These conditions of ownership make it easier for buyers and sellers to agree upon an appropriate price; thus, providing the owner with the ability to cash out — greater liquidity.
The relative ease of income property evaluation makes that part of the real estate market a more exciting and less predictable field, as cap rates can change dramatically, altering market values in a moment. Conversely, owner-occupied residential property moves slowly and steadily with sticky pricing, sellers not reacting to the recessionary market forces existing at the time. The historical reality of market implosion.
Readers should remember that real estate pricing often fails to correspond to objective reality. The discrepancy between the prices that homeowners set and the prices homes actually garner in the market is attributable to the human factor. Outrageous bubbles become more outrageous, and collapses become more devastating, due to a common set of irrational beliefs about market behavior. The most dramatic example of market fallibility took place in the very recent past —our Great Recession.













book my umrah trip
i like it
Upgrade your living space with Home Interior Design in Hyderabad by expert professionals who blend creativity, comfort, and functionality. From modern living rooms and modular kitchens to elegant bedrooms and complete home makeovers, Hyderabad’s top interior designers deliver customized solutions to match your style and budget. Whether you prefer contemporary, traditional, or luxury interiors, get high-quality materials, space-saving designs, and flawless execution. Transform your dream home with the best home interior designers in Hyderabad today.
Lucknow
Great post! Thanks for sharing such useful and interesting information. Looking forward to seeing more wonderful posts from you.
The tier split is doing quiet work in that chart — low tier holding slightly positive while the high end wobbles suggests entry-level demand is still absorbing rate-lock refugees while move-up buyers simply wait. Swelling inventory is the engine underneath it all; more choice at open houses keeps pressure on prices regardless of tier. The property-management suggestion for brokers is pragmatic too, since recurring-fee services smooth out the commission rollercoaster when sales volume dries up.