
Why this matters: When real estate agents check out readily available market data, their ability to advise clients improves. Today’s increased deepening of uncertainty about all factors driving California property values is best tackled by continuously reviewing information for insight into the non-stop change in human behavior affecting real estate transactions.
The cyclical rise in mortgage rates bent by wars
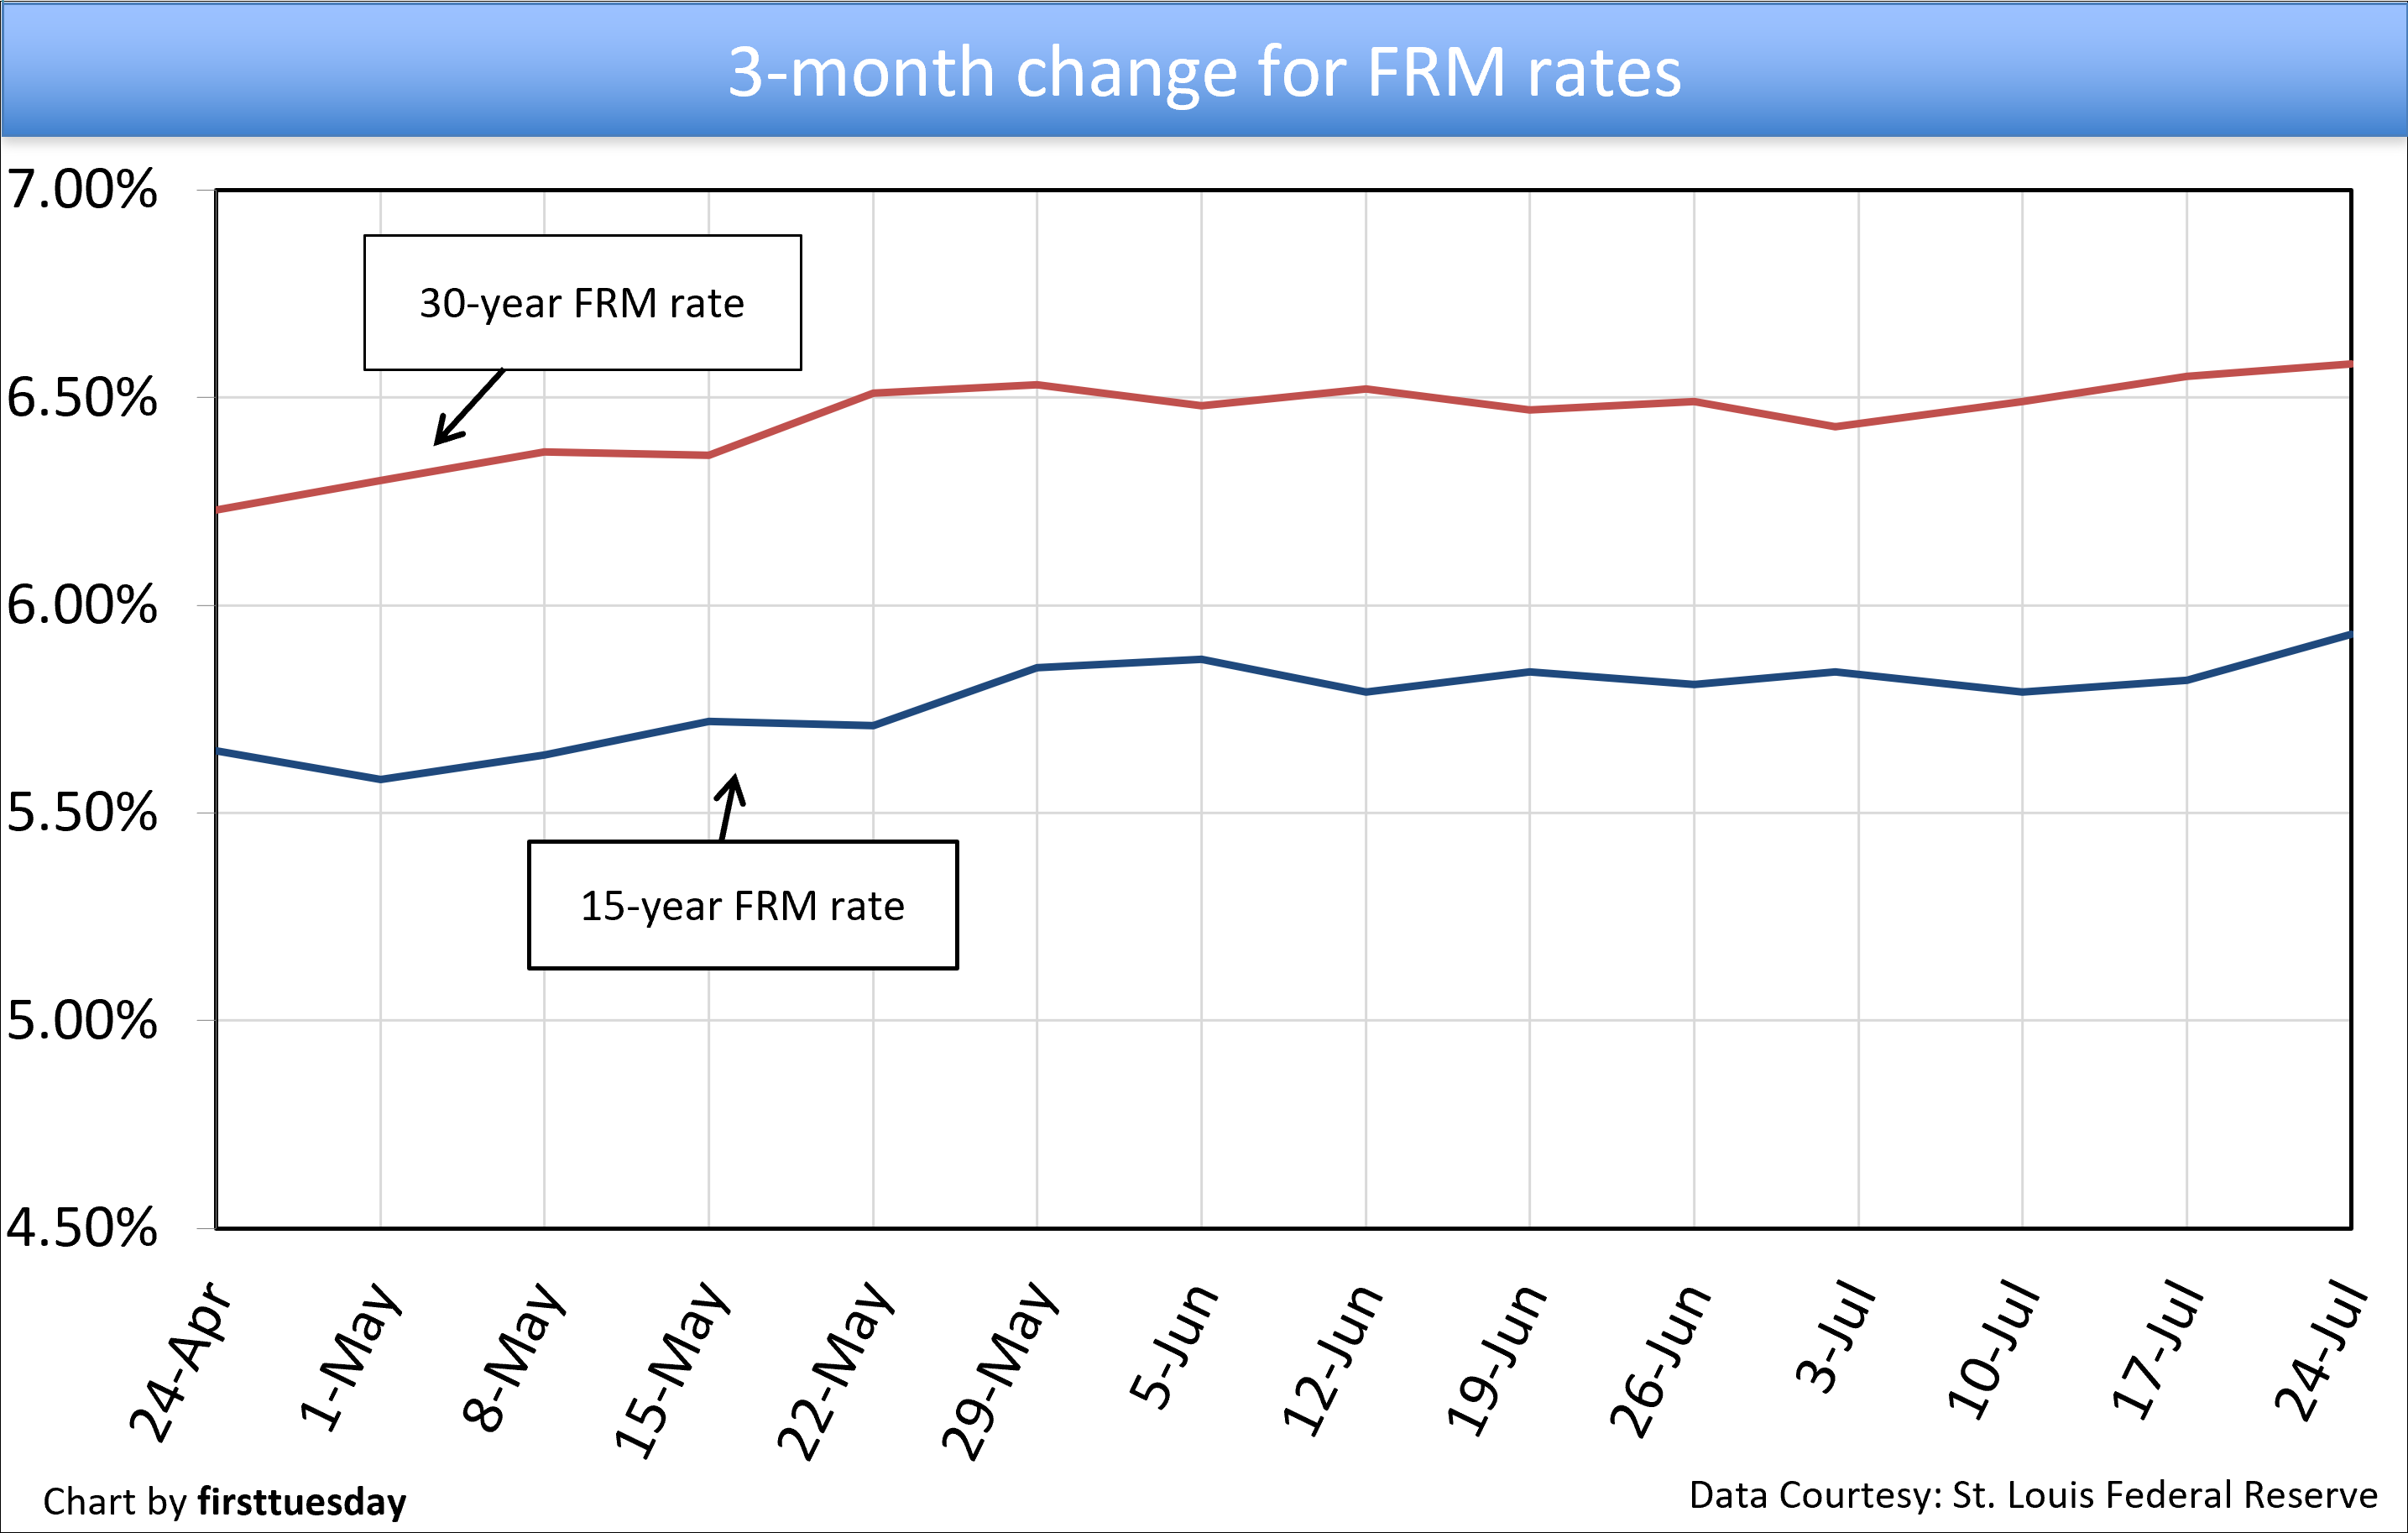
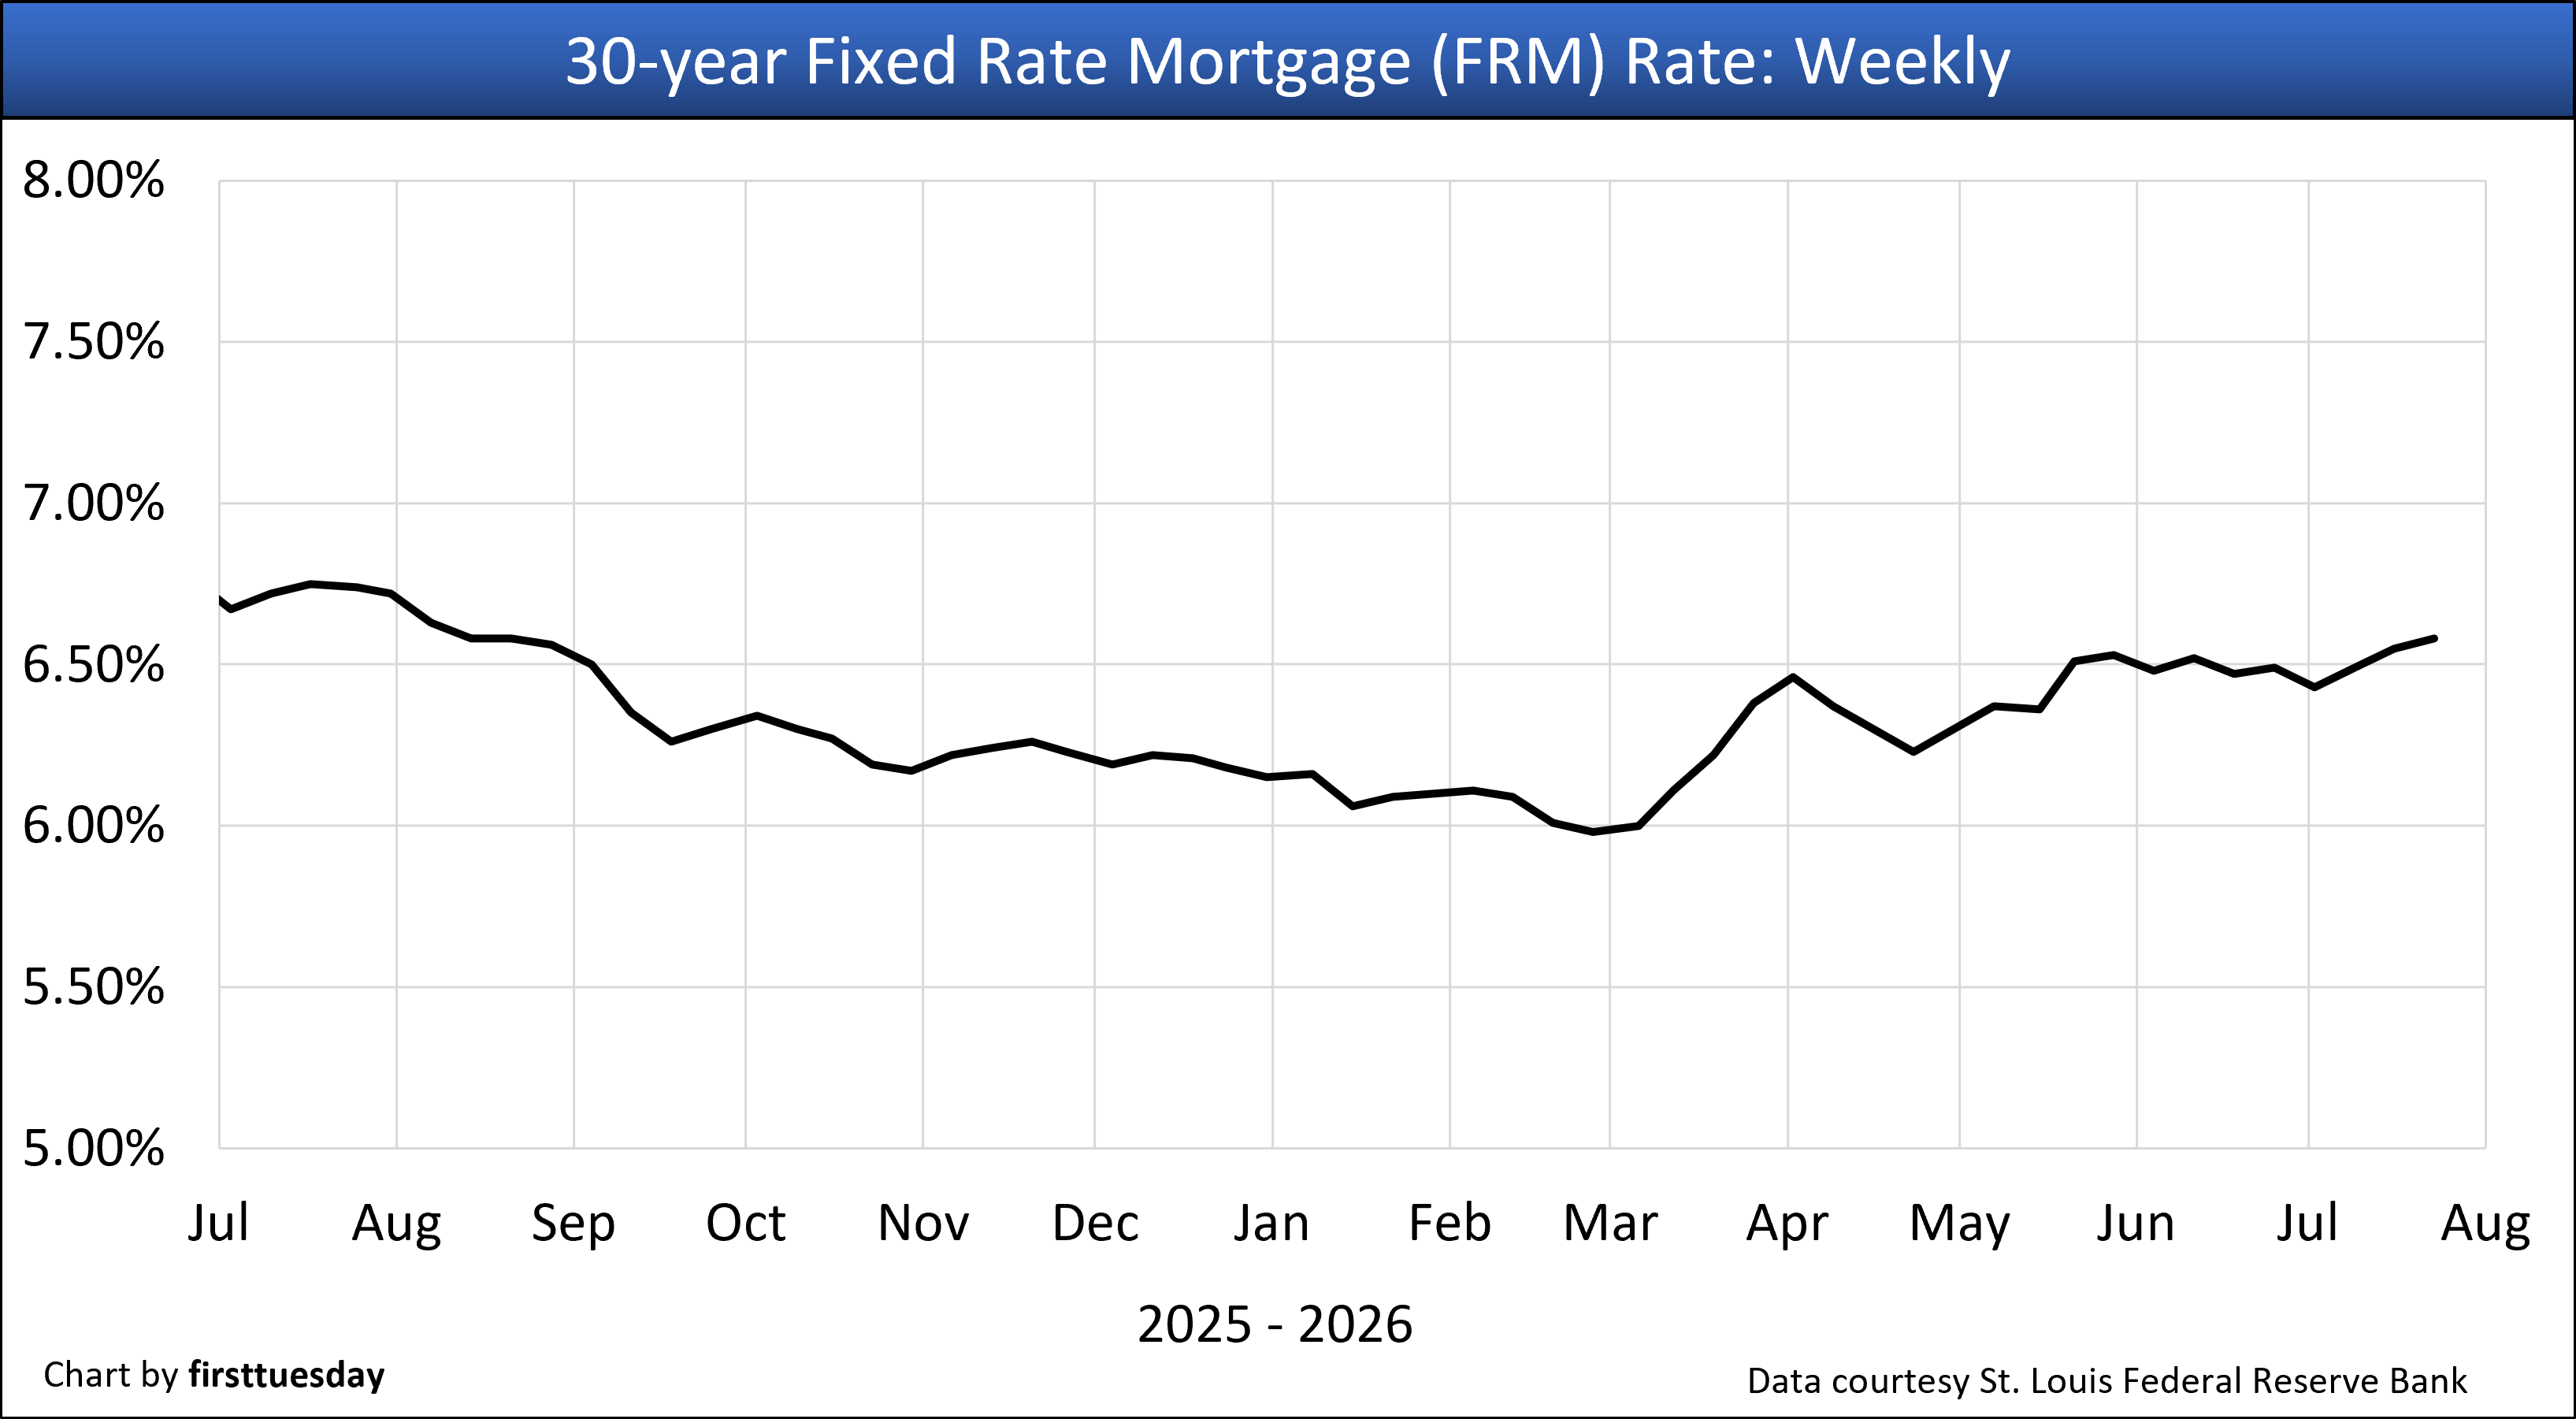
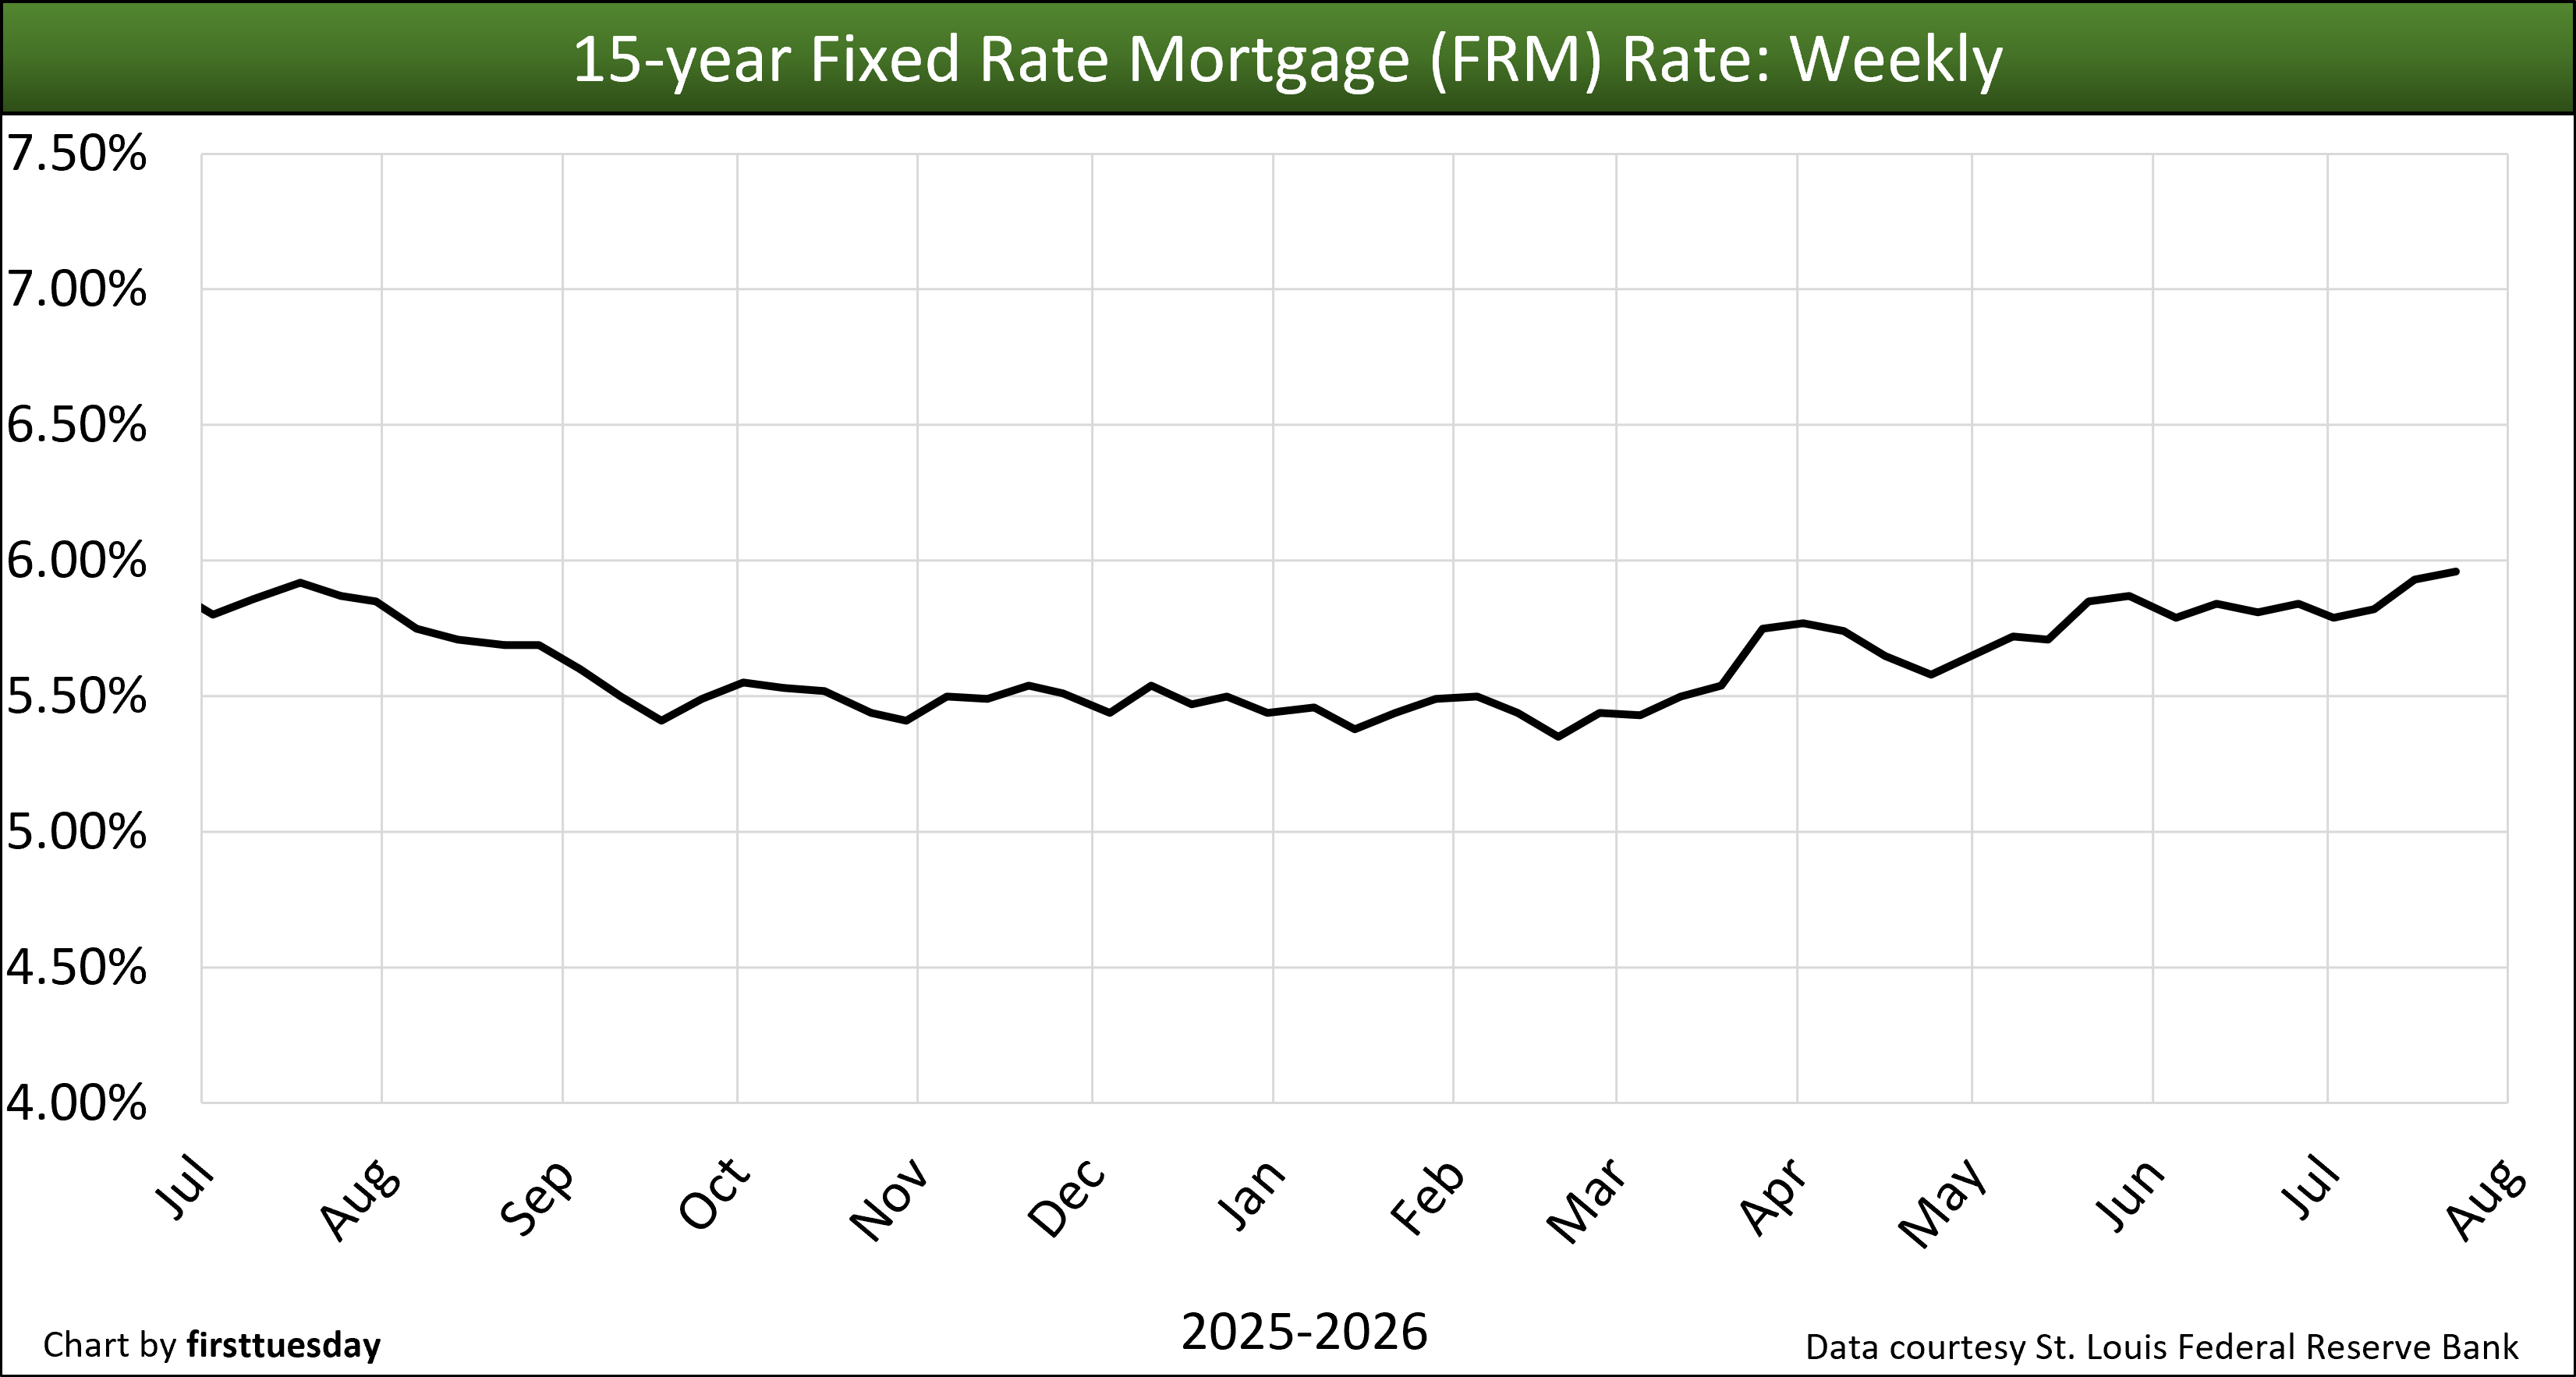
The rate on an average 30-year fixed rate mortgage (FRM) inched up to 6.58% in the week ending July 24, 2026. The average 15-year FRM increased to 5.96%. For those able to switch, the lower 15-year FRM delivers a huge increase in wealth due to the significant decrease in the amount of interest paid over the life of a 15-year mortgage.
In addition to the annual interest rate being one-eleventh less expensive than the 30-year FRM, the 15-year FRM also pays off the principal more quickly through amortization as monthly payments are larger. Originating a 15-year FRM, rather than a 30-year FRM, saves around 60% on the total interest paid on a 30-year FRM with a principal amount of $500,000. Meaning a 30-year mortgage requires payments of more than double the interest, an avoidable expense that drastically reduces the homeowner’s standard of living after 15 years.
The war in the Middle East initiated February 28, 2026, instantly and adversely altered the California real estate economy. For 2026, you may well see FRM rates work their way higher then lower, or, lower then higher. The bond market bet is the Fed will put up a marginal fight to cut the current severe 6% to 8% annualized forward rate of consumer inflation underway today. Tariff wars in 2025 and military wars in 2026 destabilized job growth and increased consumer inflation which will not end quickly.
The Fed task for setting short-term interest rates is today disrupted by the fast-rippling effects on all products made from oil — plastics for construction and consumer stuff, fertilizer for grocery products, fuel for transportation. And, meanwhile, the effects remain from the covid pandemic and current government-administrated interference with necessary trade and migratory labor. The environment of existing wars drives hording of precious metals — or cash positions — but not the acquisition of real estate interests. Not yet, but certain to come.
Until rapid upward consumer inflation decelerates to the 2% range, increased short-term interest rates — or a reduction in jobs, or both — will reduce consumer spending and household debt. As always, future pricing of consumer goods will rise but at an accommodating slower rate. Meanwhile asset prices (read: real estate, bonds, etc.) decline and wages for the employed increase to match recent consumer inflation, the COLA effect.
However, it is the dramatic increase in long-term rates for mortgages, which have not yet peaked, that has brought mortgage-funded real estate transactions to a serious slowdown until the interferences recede. The 2026 annual cycle for the spring bounce in sales volume and pricing was going nowhere before the Iran War. The conflict put an end to typical deal making for buyers dependent on mortgage funding.
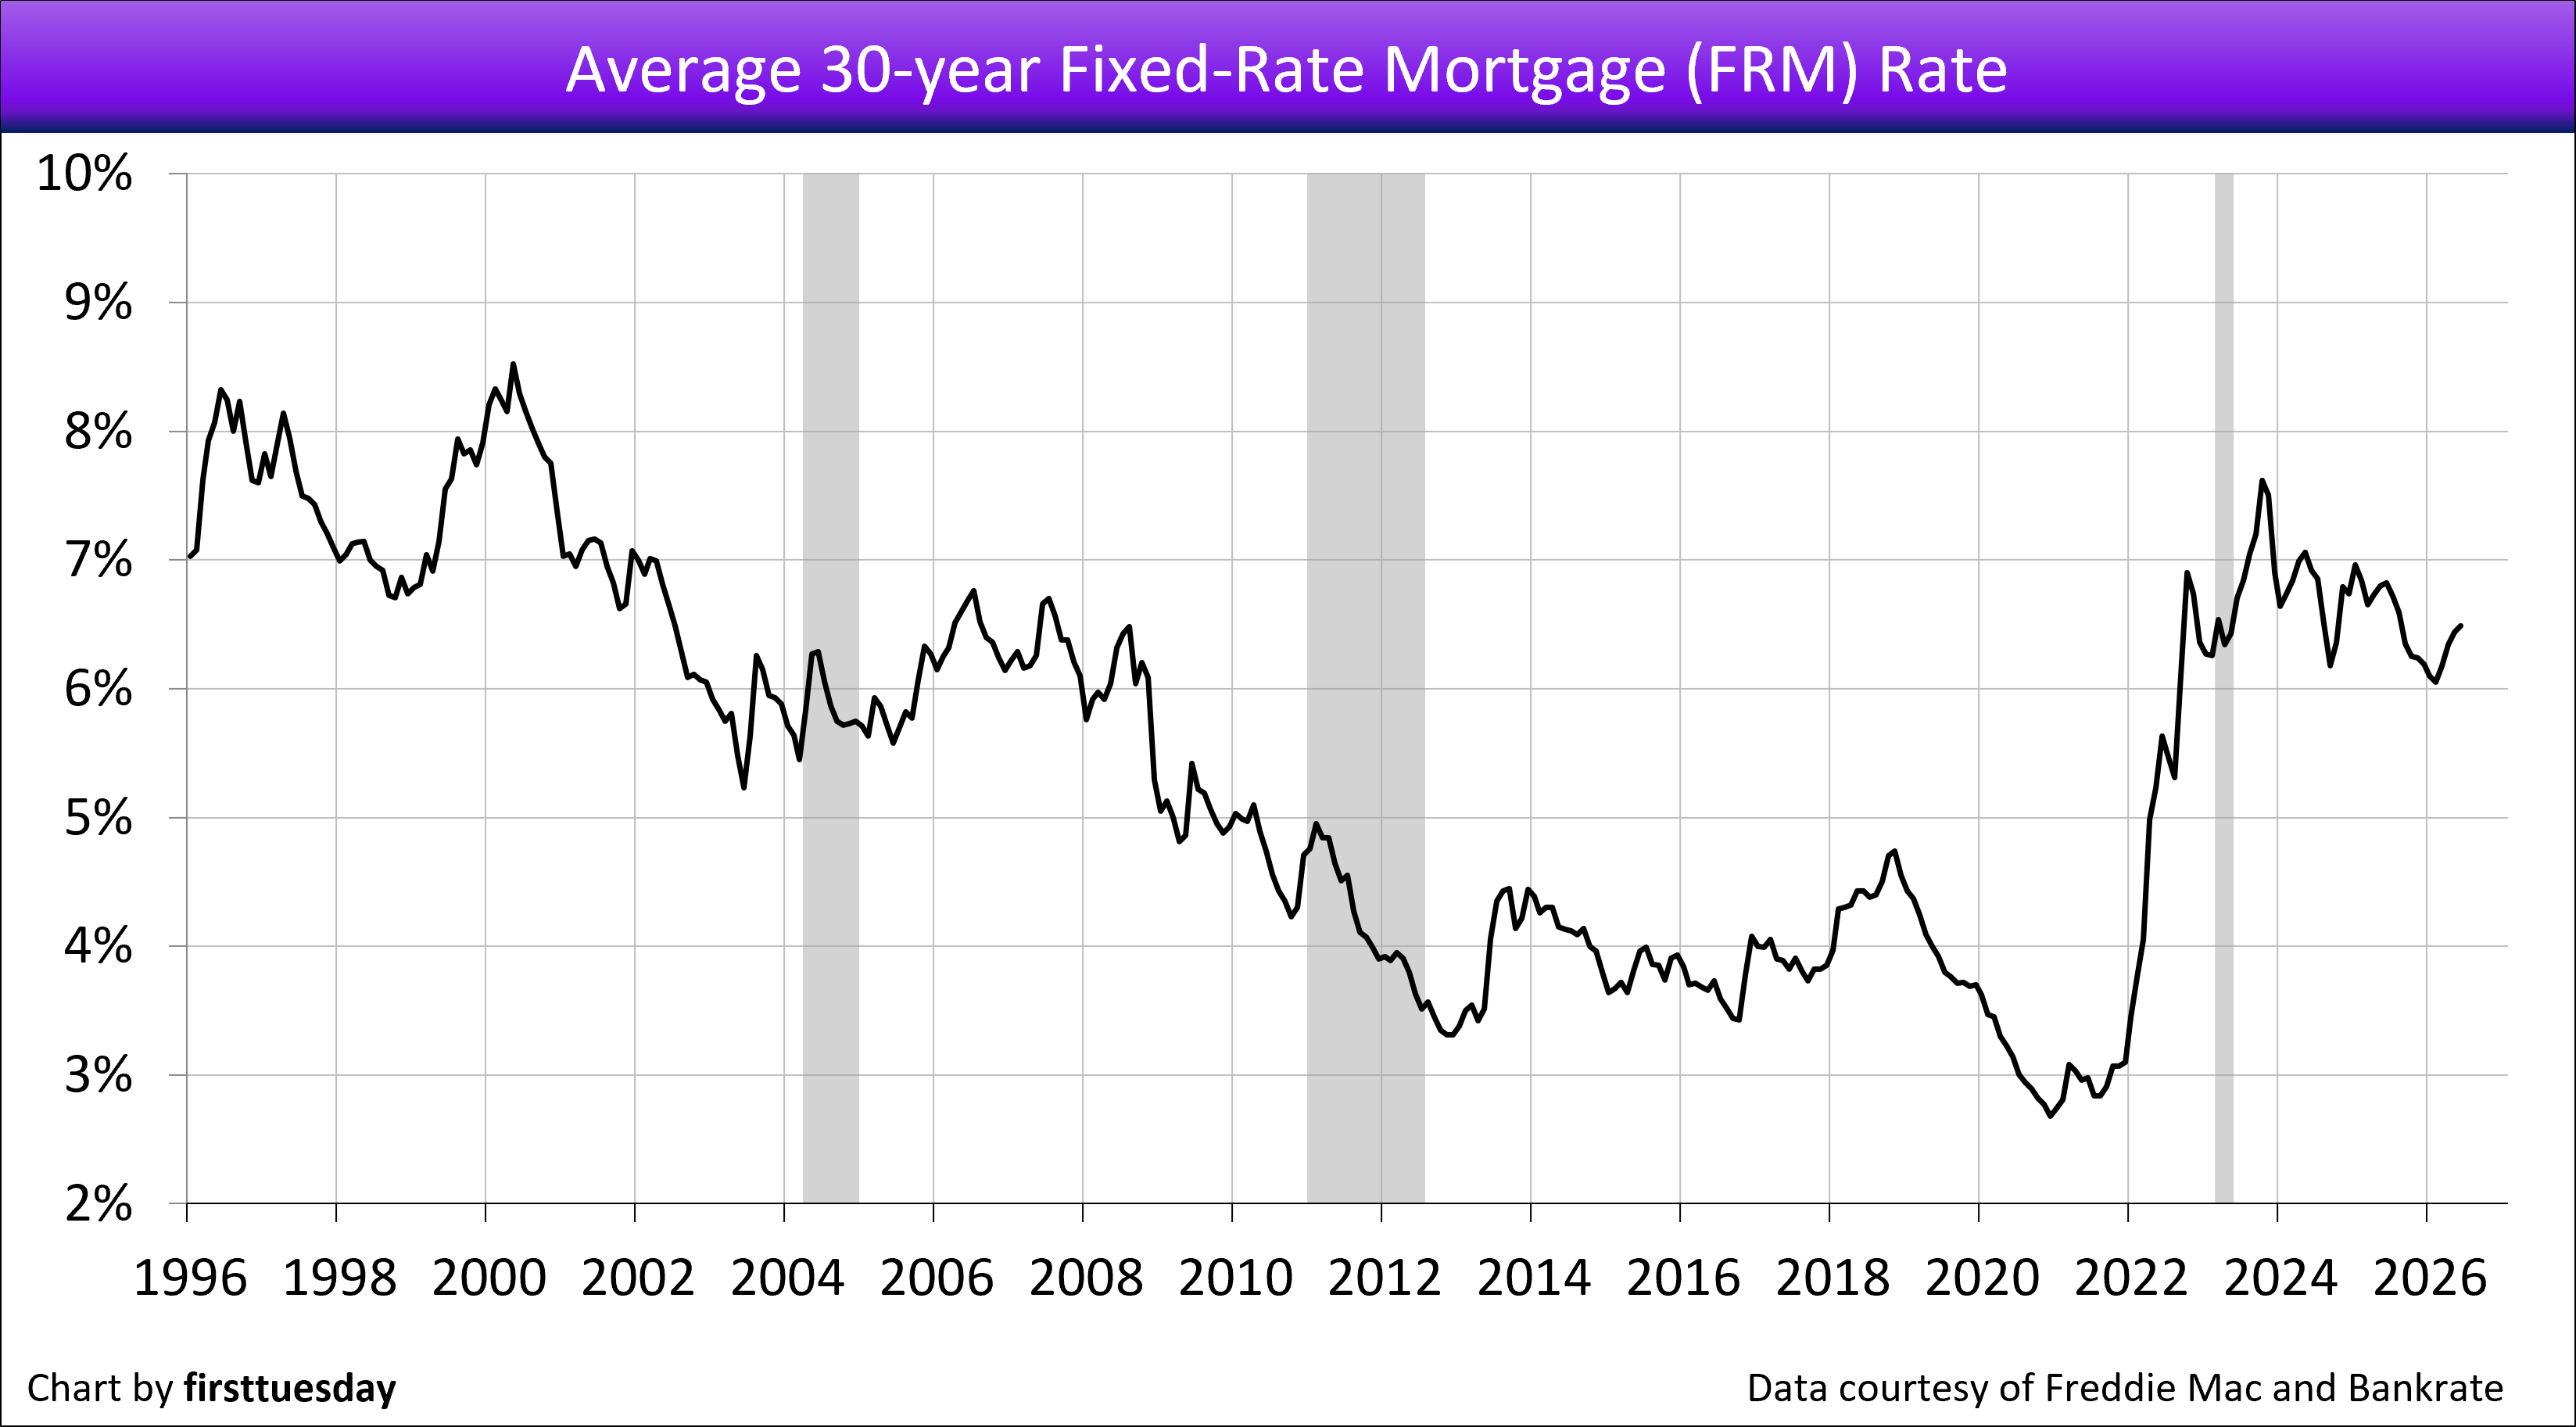
Regardless of FRM rate movement in the continuing real estate recessionary period remaining in 2026, expect a long-term upward trend in mortgage rates to follow. The trend commenced in 2013 with the onset of a half-cycle of rising rates on all borrowing and is likely to run for around two more decades.
That said, current government interference with the economy is spilling over into real estate by adversely affecting homebuyer willingness, user turnover rate, and costs of residential construction. Thus, a rigor mortis environment has settled in for real estate.
An increase in federal tax revenues — or Federal Reserve bond buying — will soon be needed to offset an insatiable government demand for cash, unless the people who pay income taxes pay more. The result: expect long-term interest rates to remain high, and in sympathy, mortgage rates.
Two further situations will cause mortgage rates to stay high and tend to rise. Privatizing quasi-government mortgage agencies, like Freddie Mac, will enhance mortgage lender profit-sharing as reduced oversight increases mortgage lender risk of loss but provides greater short-term profits. The tandem follow on is that the resulting mortgage lender losses are socialized by government mortgage guarantees and not borne by the lenders.
Remember the rule: All financial deregulation goes up in flames. Our last reminder was 2005 which did not go well, but we forget.
Buyers increasingly stay away, until when?
In the longer term, today’s property prices are undermined by high FRM rates and buyer caution. Likewise, all income property values decline as capitalization rates do rise in sympathy with long-term interest rates, a yield-spread cost borne as wealth lost by current owners of real estate, not mathematically inclined buyers. High FRM rates and cap rates reflect the pattern of rising long-term interest rates that took root in 2013.
In application, property pricing is primarily supported by the amount a buyer can borrow to fund a purchase. Higher and higher mortgage rates translate into reduced ability to pay yesterday’s asking prices.
The annual increases in FRM rates experienced since 2013 force sellers to eventually drop prices or exit the for-sale market when for-sale and for-lease inventories rise. An exception is the annual spring bounce in sales volume, which weakened each year since 2021.
As for homebuyers dependent on purchase-money mortgage funding, and particularly first-time buyers under the age of 35, they either:
- reduce their standard of living and acquire property priced in a lower tier, a less likely choice going forward; or
- wait out dropping or static property prices until pricing matches their reduced buyer purchasing power brought on by high mortgage rates, a match now well on its way since property pricing peaked in mid-2022 and remains flat.
Buyers dependent on mortgage funding increasingly sense property acquisition today is incompatible with the double whammy of purchasing an over-priced property with mortgage funding at high FRM rates. Rational potential buyers increasingly remain on the sidelines — ready and able, but less willing to borrow and buy.
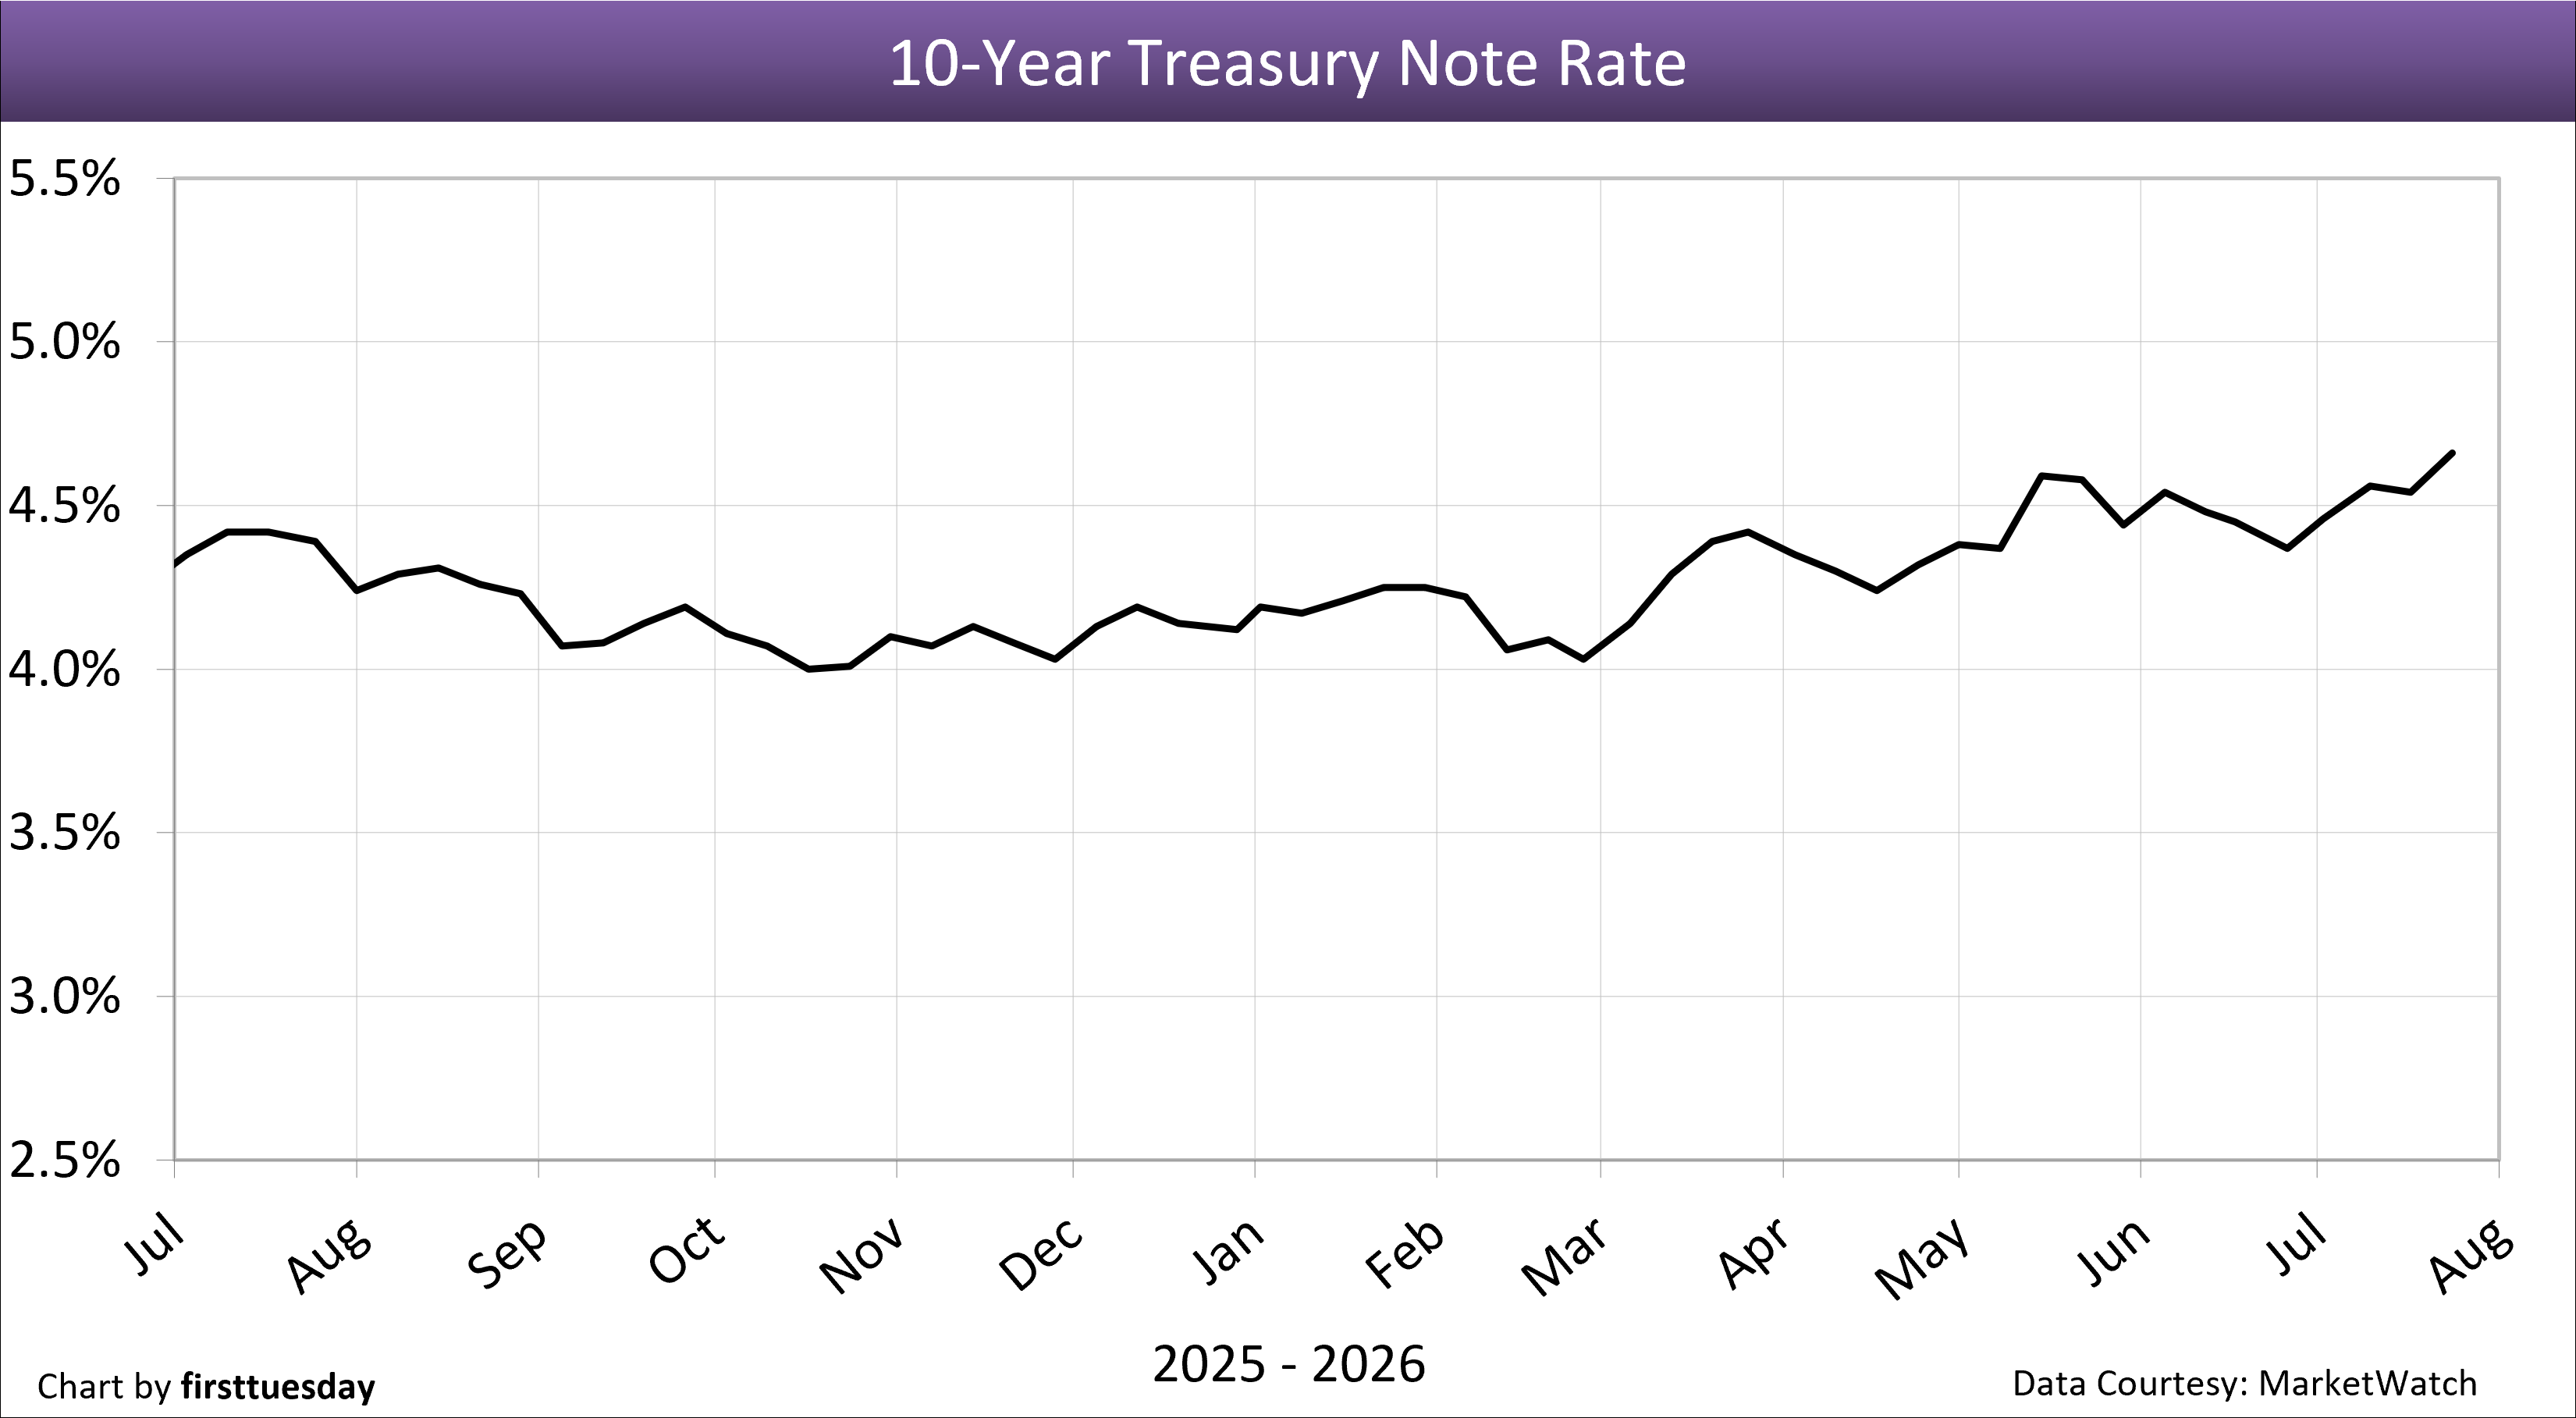
Fundamentally, FRM rates are tied to the 10-year Treasury note market, as are capitalization (cap) rates for setting income property prices. The 30-year FRM rate moves in tandem with the 10-year Treasury note rate, to which MLOs add a risk premium of between 1.5% and 3.0% based on a perceived risk of loss on mortgage defaults. Historically, the risk premium spread between the 10-year T-Note rate and the 30-year FRM rate in normal times is 1.5%. The spread is far greater for property investor cap rates to set property value.
The 10-year T-Note lifted to 4.66% on July 24, 2026. The spread between the 10-year T-Note and 30-year FRM rate is 1.92%, above the historical risk premium spread of 1.5%.
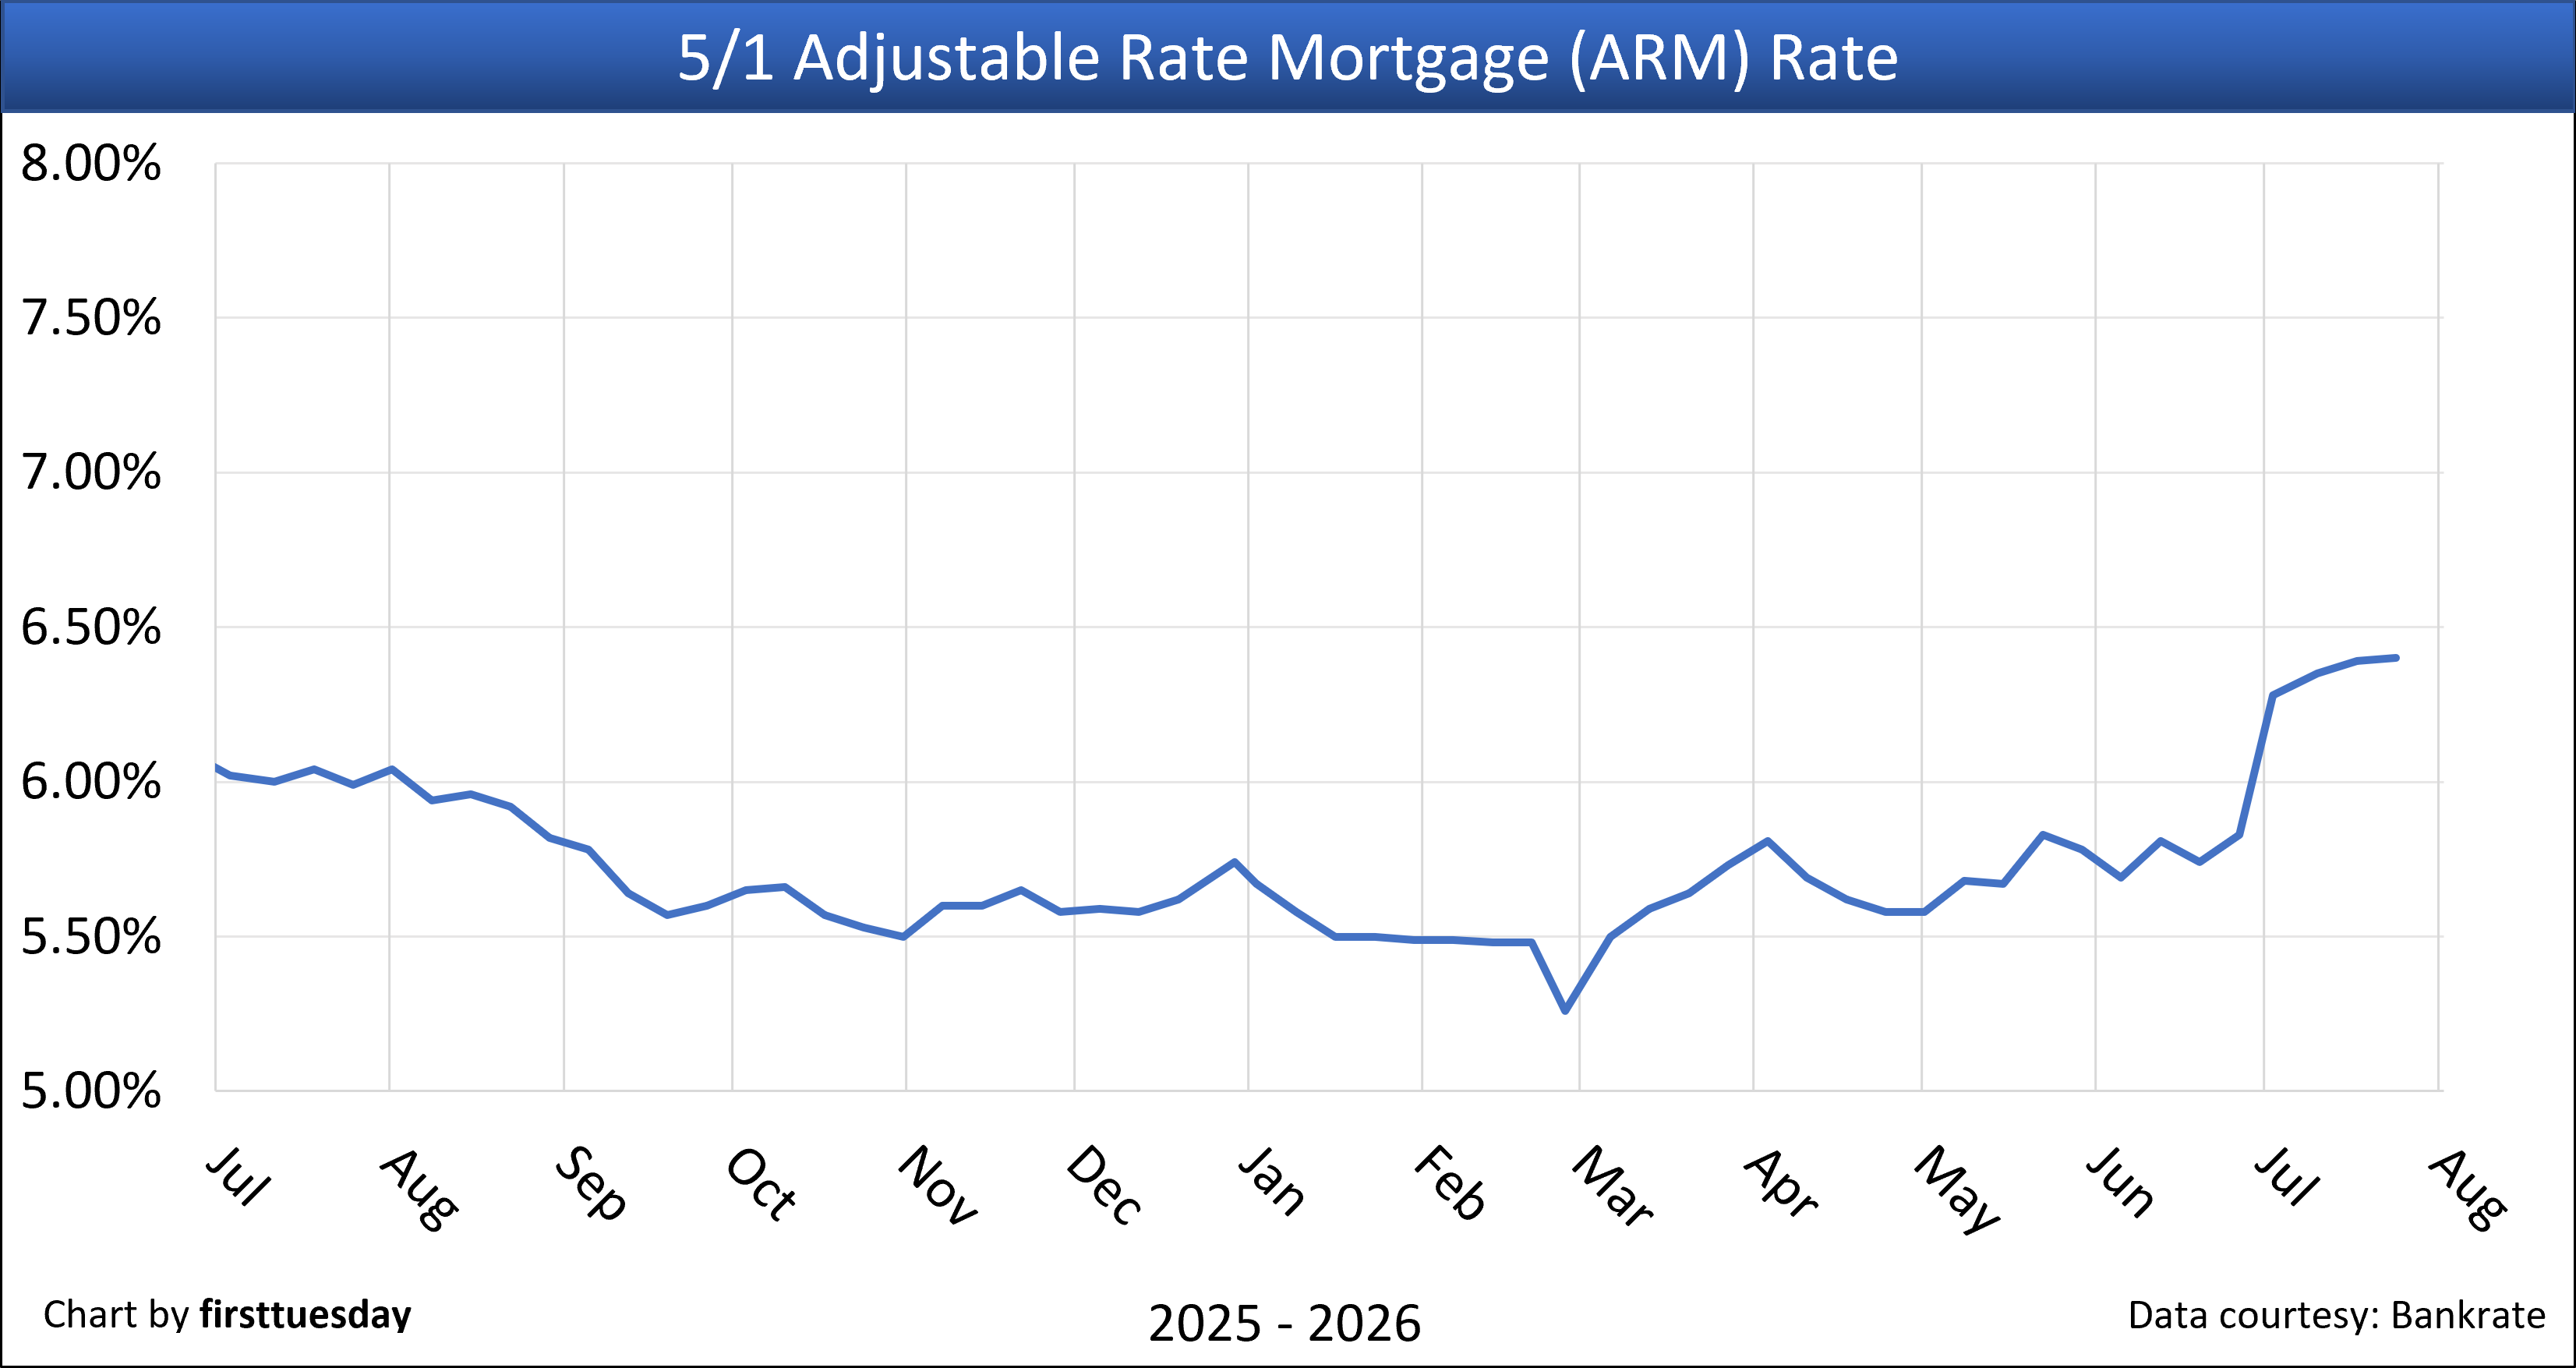
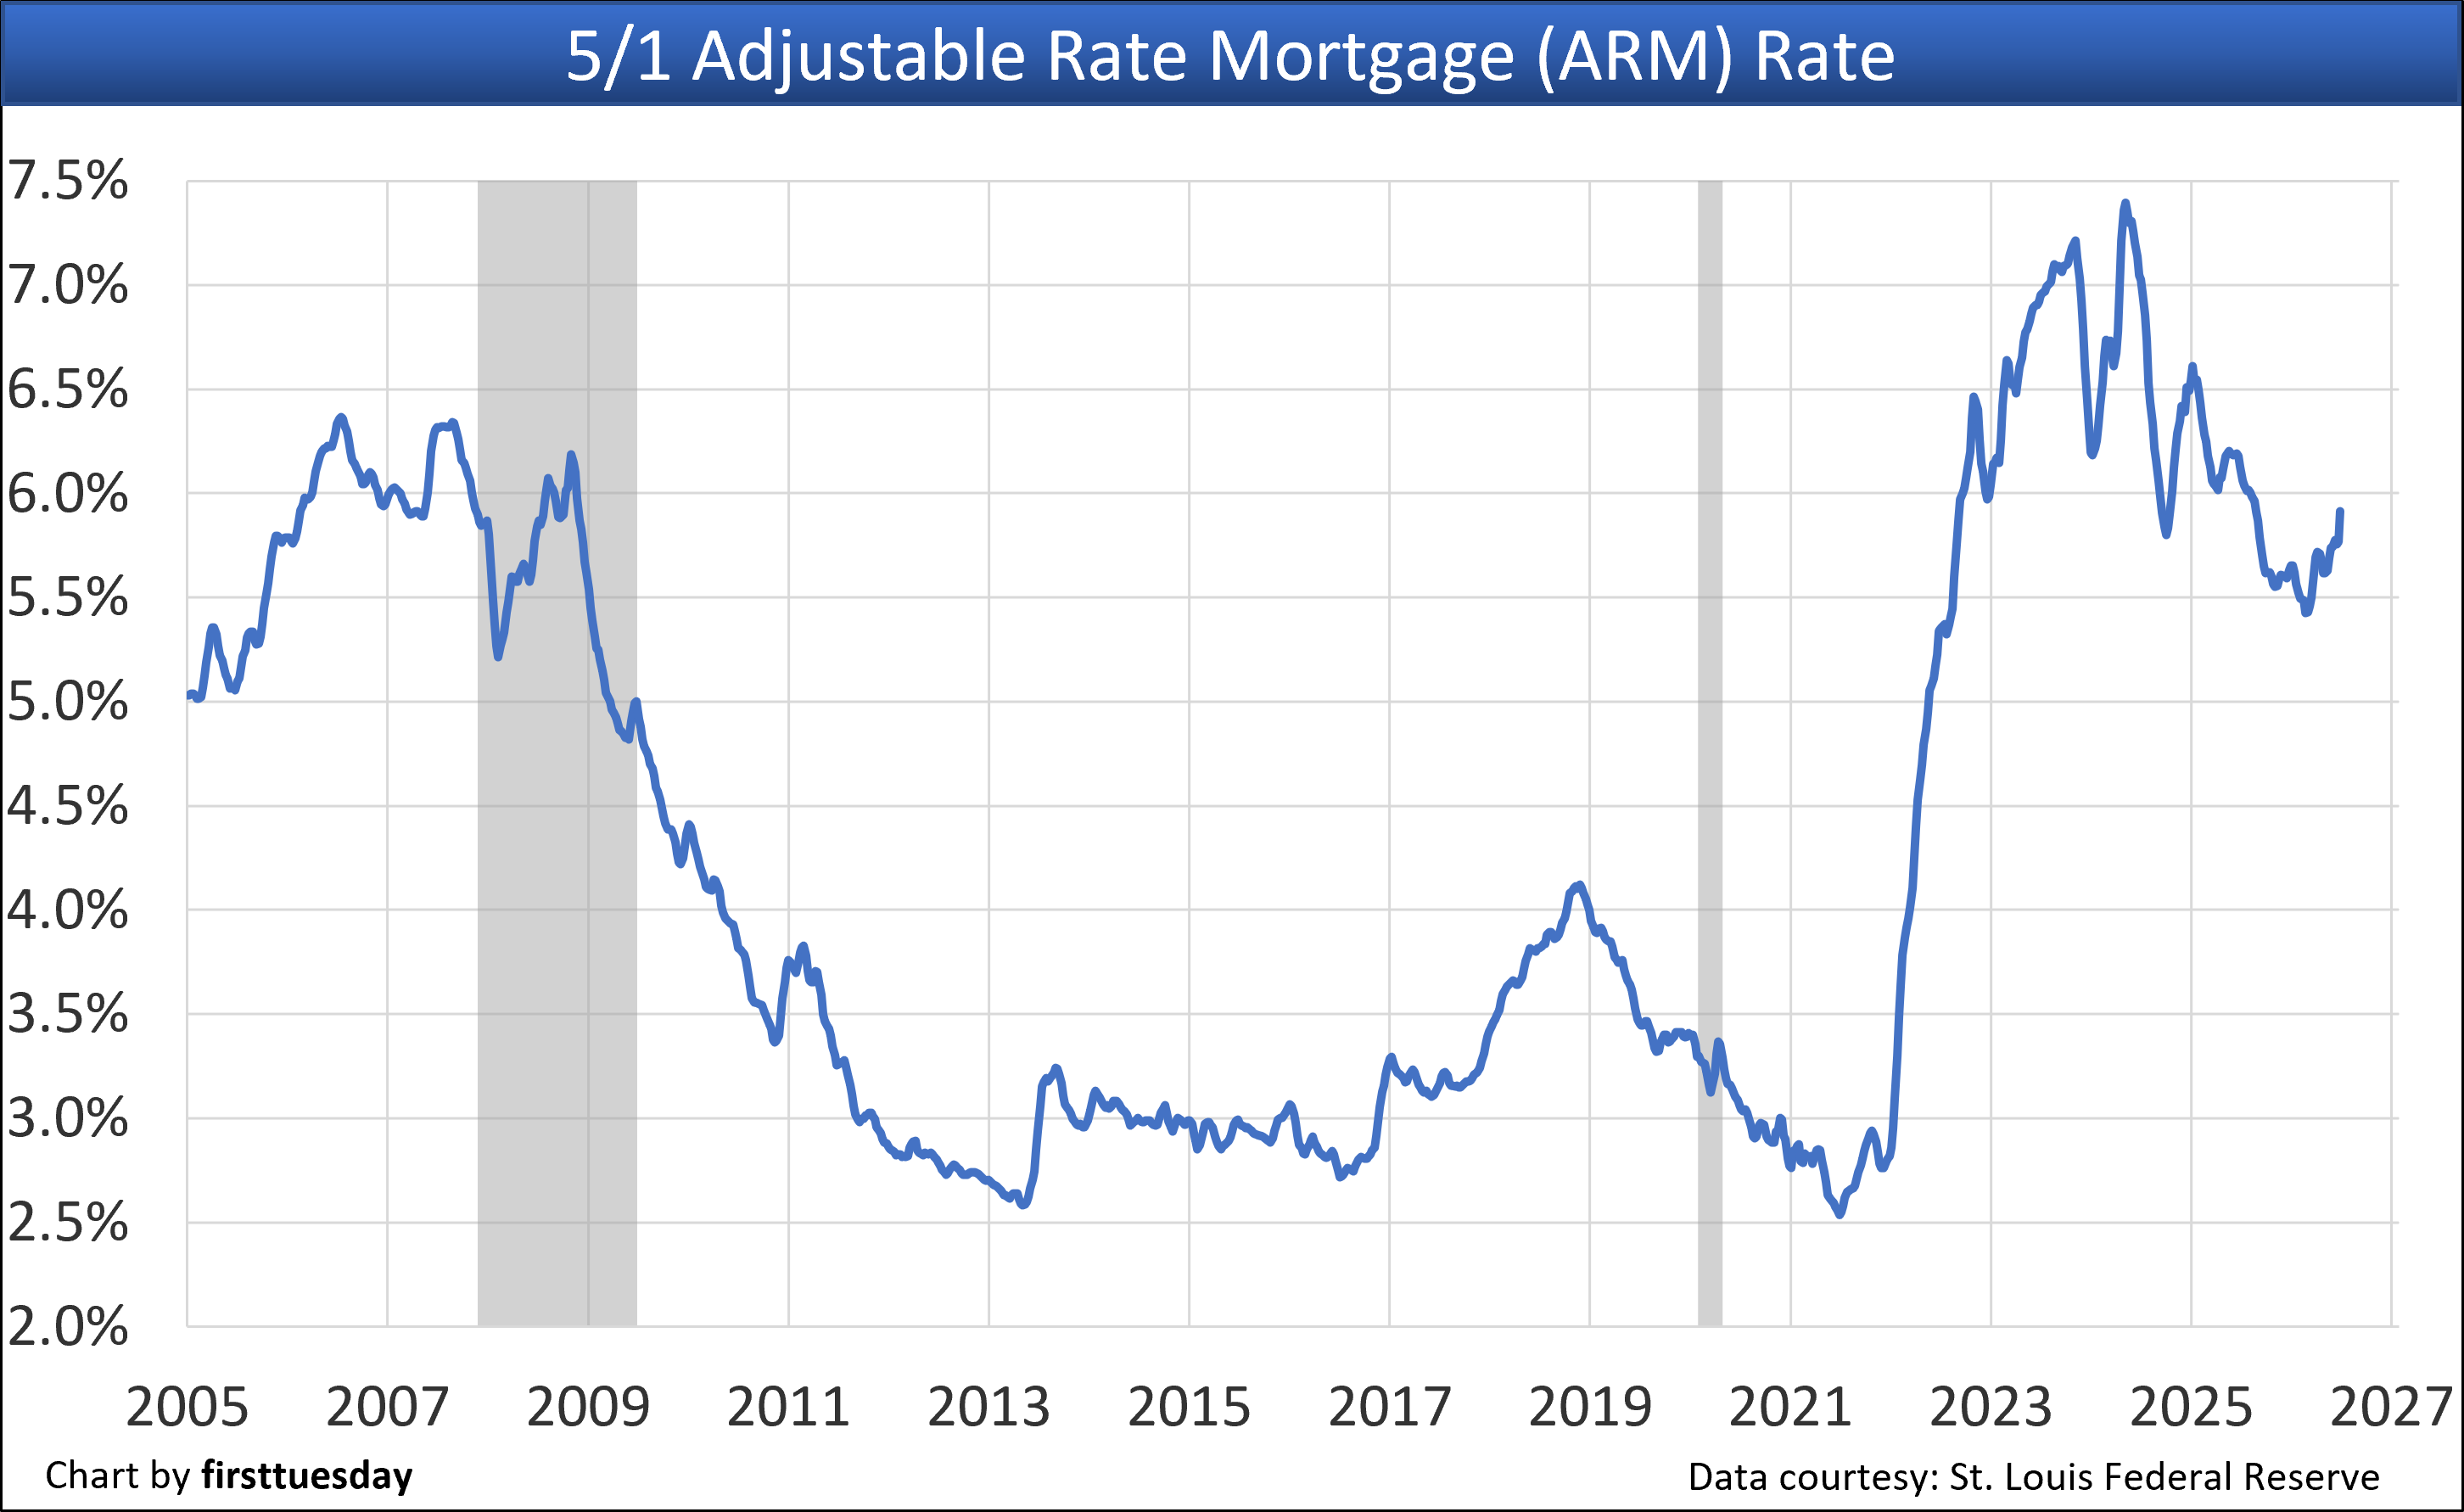
The average monthly rate on adjustable rate mortgages (ARMs) leveled to 6.40% on July 24, 2026.
The interest rate on the ARM is well above the 15-year FRM and only 18 percentage points lower than the 30-year FRM rate. A positive 30-year ARM-to-FRM spread gives a homebuyer or owner a bump in the amount they can borrow by taking out an ARM.
The downside in this reach for more funding through a non-conventional (predatory) mortgage is the significant forward risks of loss-by-foreclosure inherent in ARMs when rates trend higher or an employment recession sets in. Unchanged, an ARM is the mortgage available to finance the risk-tolerant cohort of high-tier housing and commercial property buyers and owners.
The following was updated July 24, 2026.
Click the link to go directly to a chart, or browse the charts by scrolling below.
1. 30-year fixed rate mortgage (FRM) rate, weekly— Chart update 7/24/2026
2. 30-year FRM rate, monthly — Chart update 7/2/2026
3. 15-year FRM rate — Chart update 7/24/2026
4. 5/1 adjustable rate mortgage (ARM) rate, monthly — Chart update 7/2/2026
5. 10-year Treasury note rate — Chart update 7/24/2026
6. Combined FRM and 10-year Treasury note rates — Chart update 7/2/2026
7. 91-day Treasury bill rate — Chart update 7/24/2026
8. 3-month Treasury bill — Chart update 7/2/2026
9. 6-month Treasury bill — Chart update 7/2/2026
10. Treasury Securities average yield (CMT) — Chart update 7/2/2026
11. 12-month Treasury average — Chart update 7/2/2026
12. Secured Overnight Financing Rate (SOFR) — Chart update 7/24/2026
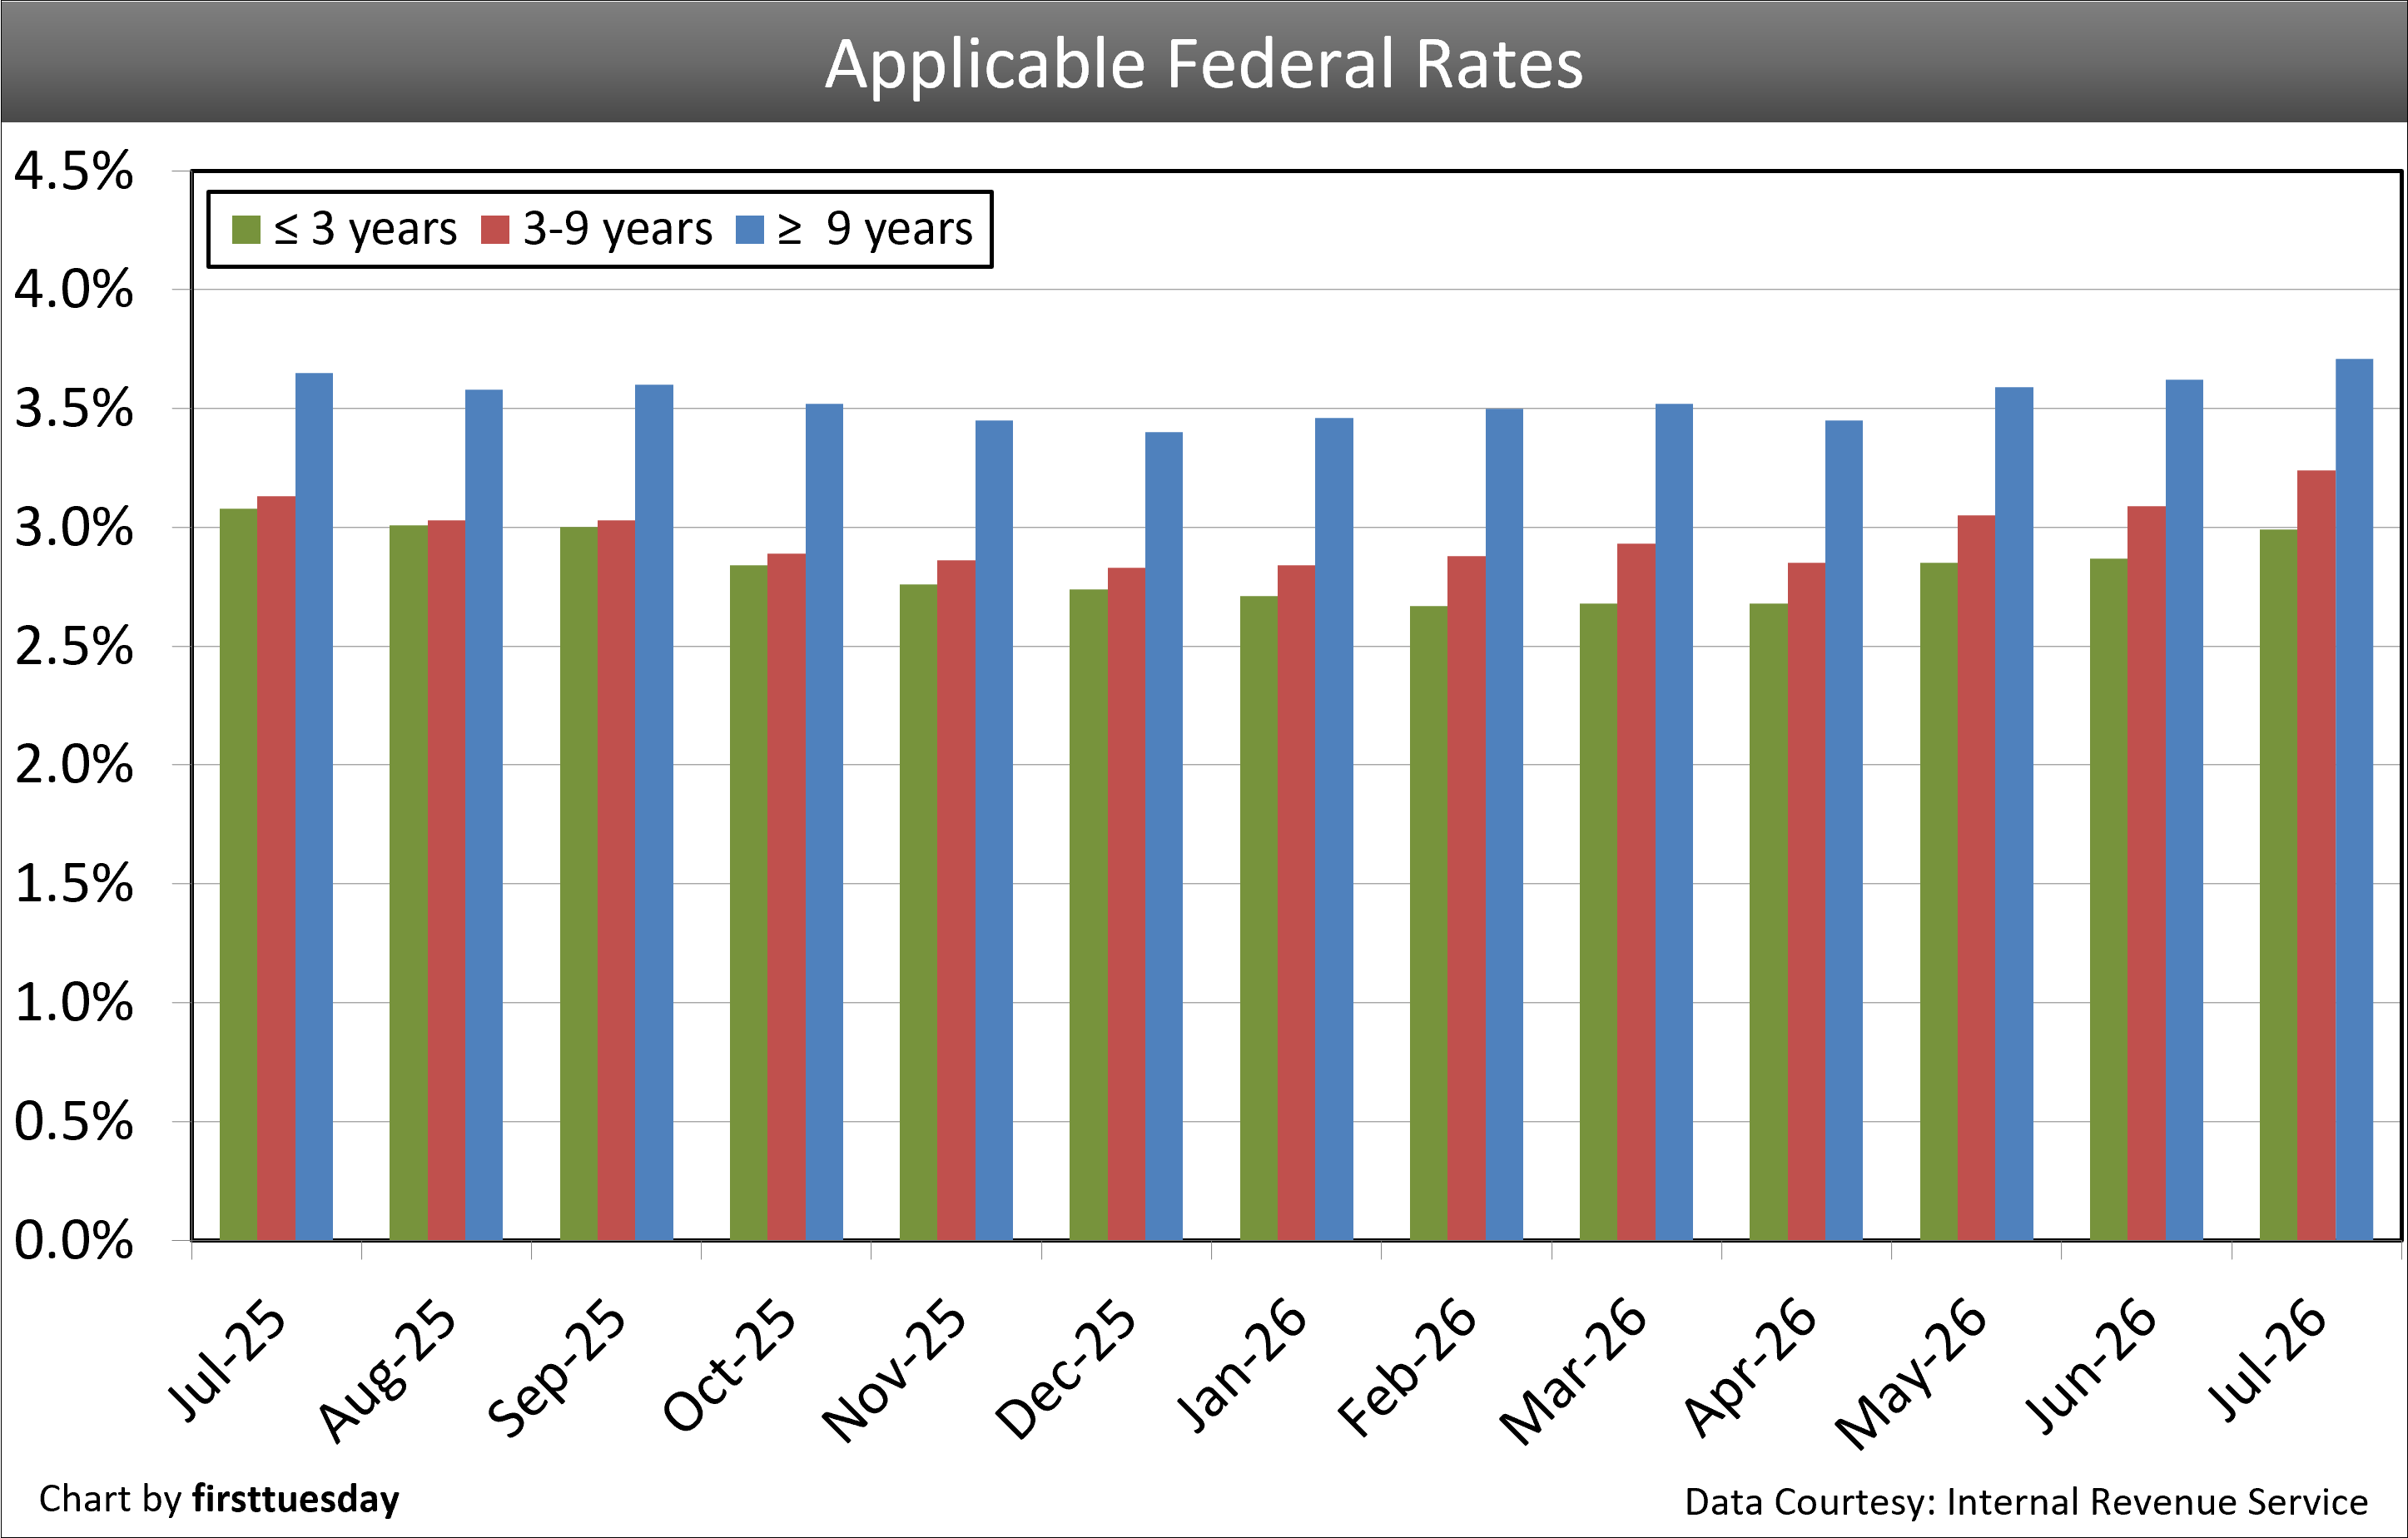
13. Applicable federal rates — Chart update 7/2/2026
 | ||
| Chart update 7/24/26 | ||
Current | Month ago 6/24/26 6.49% | Year ago 7/25/25 6.74% |
The average 30-year FRM rate in California is provided by the St. Louis Federal Reserve Bank.
| ||
 | ||
| Chart update 7/2/26 | ||
June 2026 Average 6.49% | May 2026 Average 6.44% | June 2025 Average 6.82% |
 | ||
| Chart update 7/24/26 | ||
Current 7/23/26 5.96% | Month ago 6/24/26 5.84% | Year ago 7/25/25 5.87% |
The average 15-year FRM rate in California is provided by the St. Louis Federal Reserve Bank.
| ||
 | ||
| Chart update 7/2/26 | ||
June 2026 5.77% | May 2026 5.71% | June 2025 6.18% |
The 5/1 average adjustable rate mortgage (ARM) rate shows the average rate for the first five years after origination. After the initial five-year period, the ARM rate is adjusted annually based on an index figure, such as a certain Treasury Bill rate (which reflects Federal Reserve rate movements) or the Secure Overnight Financing Rate (SOFR). The average ARM rate is provided by Freddie Mac’s survey of the U.S. | ||
 | ||
| Chart update 7/24/26 | ||
Current 7/24/26 4.66% | Month ago 6/17/26 4.45% | Year ago 7/25/25 4.39% |
This rate is a leading indicator of the direction of future Freddie Mac rates. The 10-year rate historically runs closer to 4% during a stable money market. The rate is influenced by worldwide demand for the dollar and anticipated future domestic inflation. | ||
 | ||
| Chart update 7/2/26 | ||
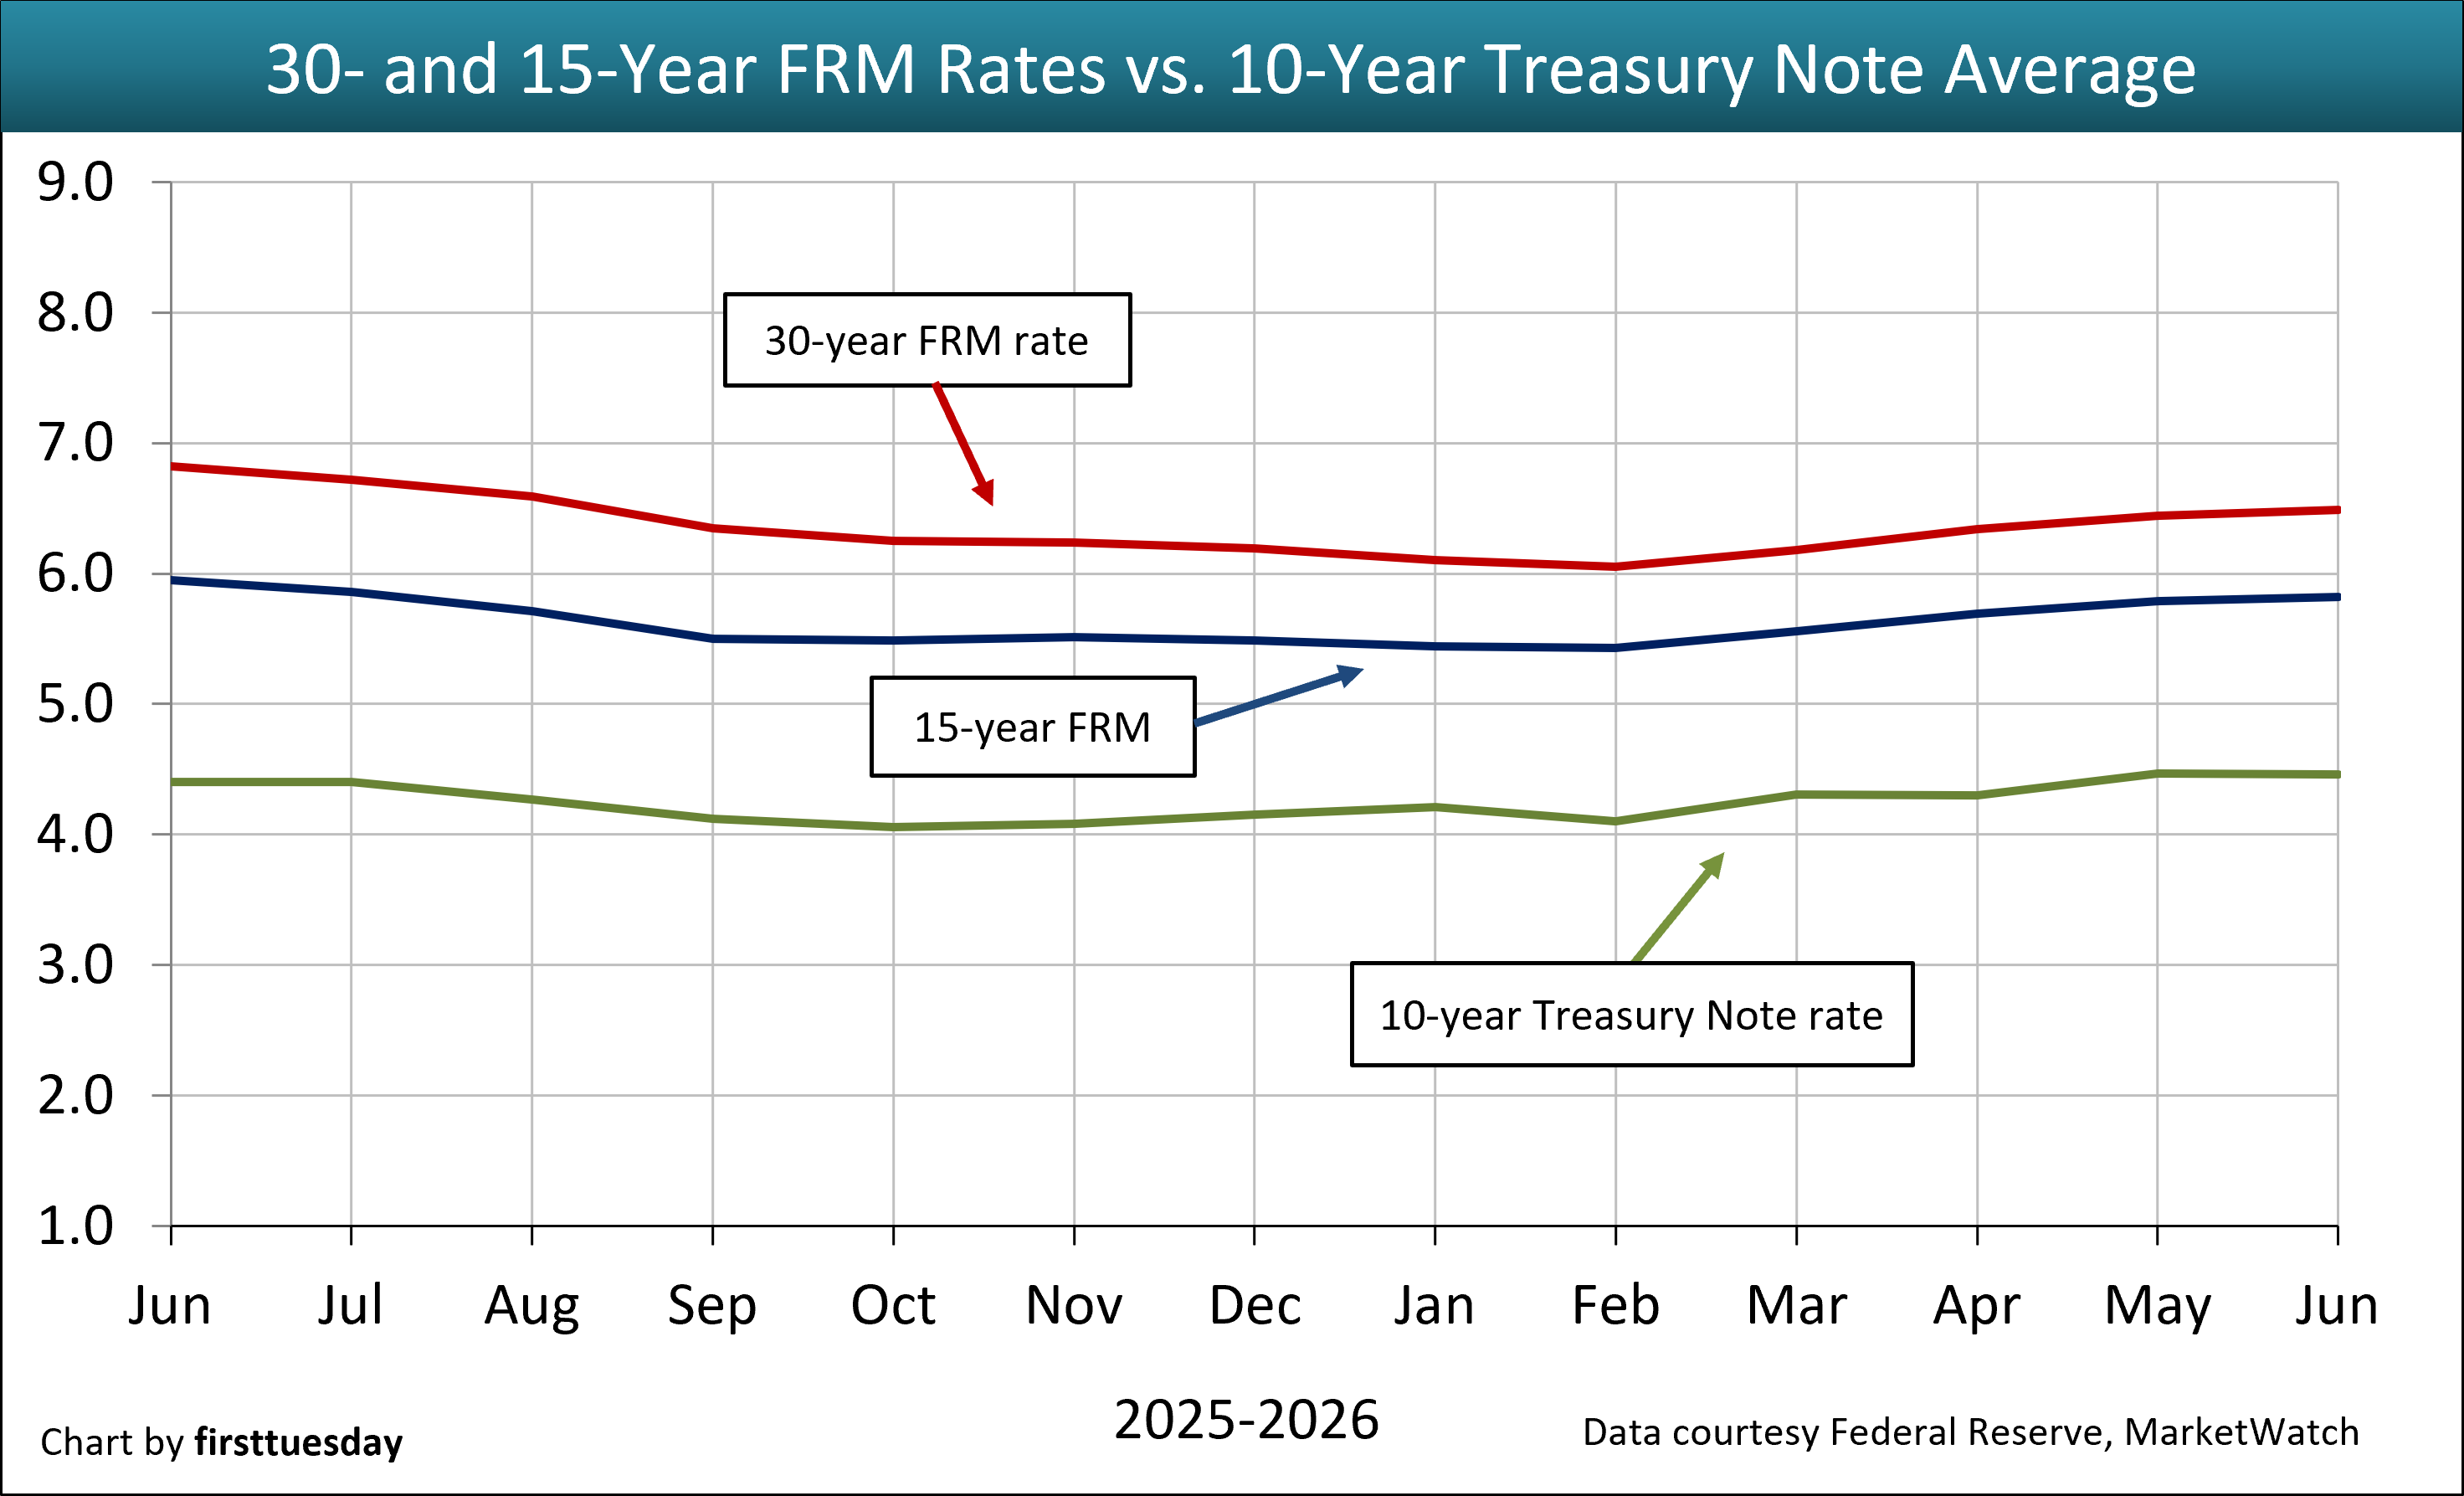
Avg 15-year June 2026 5.82% | Avg 30-year June 2026 6.49% | Avg 10-year T-Note June 2026 4.46% |
The average 15- and 30-year conventional commitment rates are the rates at which a lender commits to lend mortgage money in the United States-West/California for the duration of the life of each respective mortgage as reported by Freddie Mac. The green line reflects the 10-year Treasury Note Average, a leading indicator of the direction of future Freddie Mac rates. It is composed of the level of worldwide demand for the dollar and anticipated future domestic inflation.
| ||
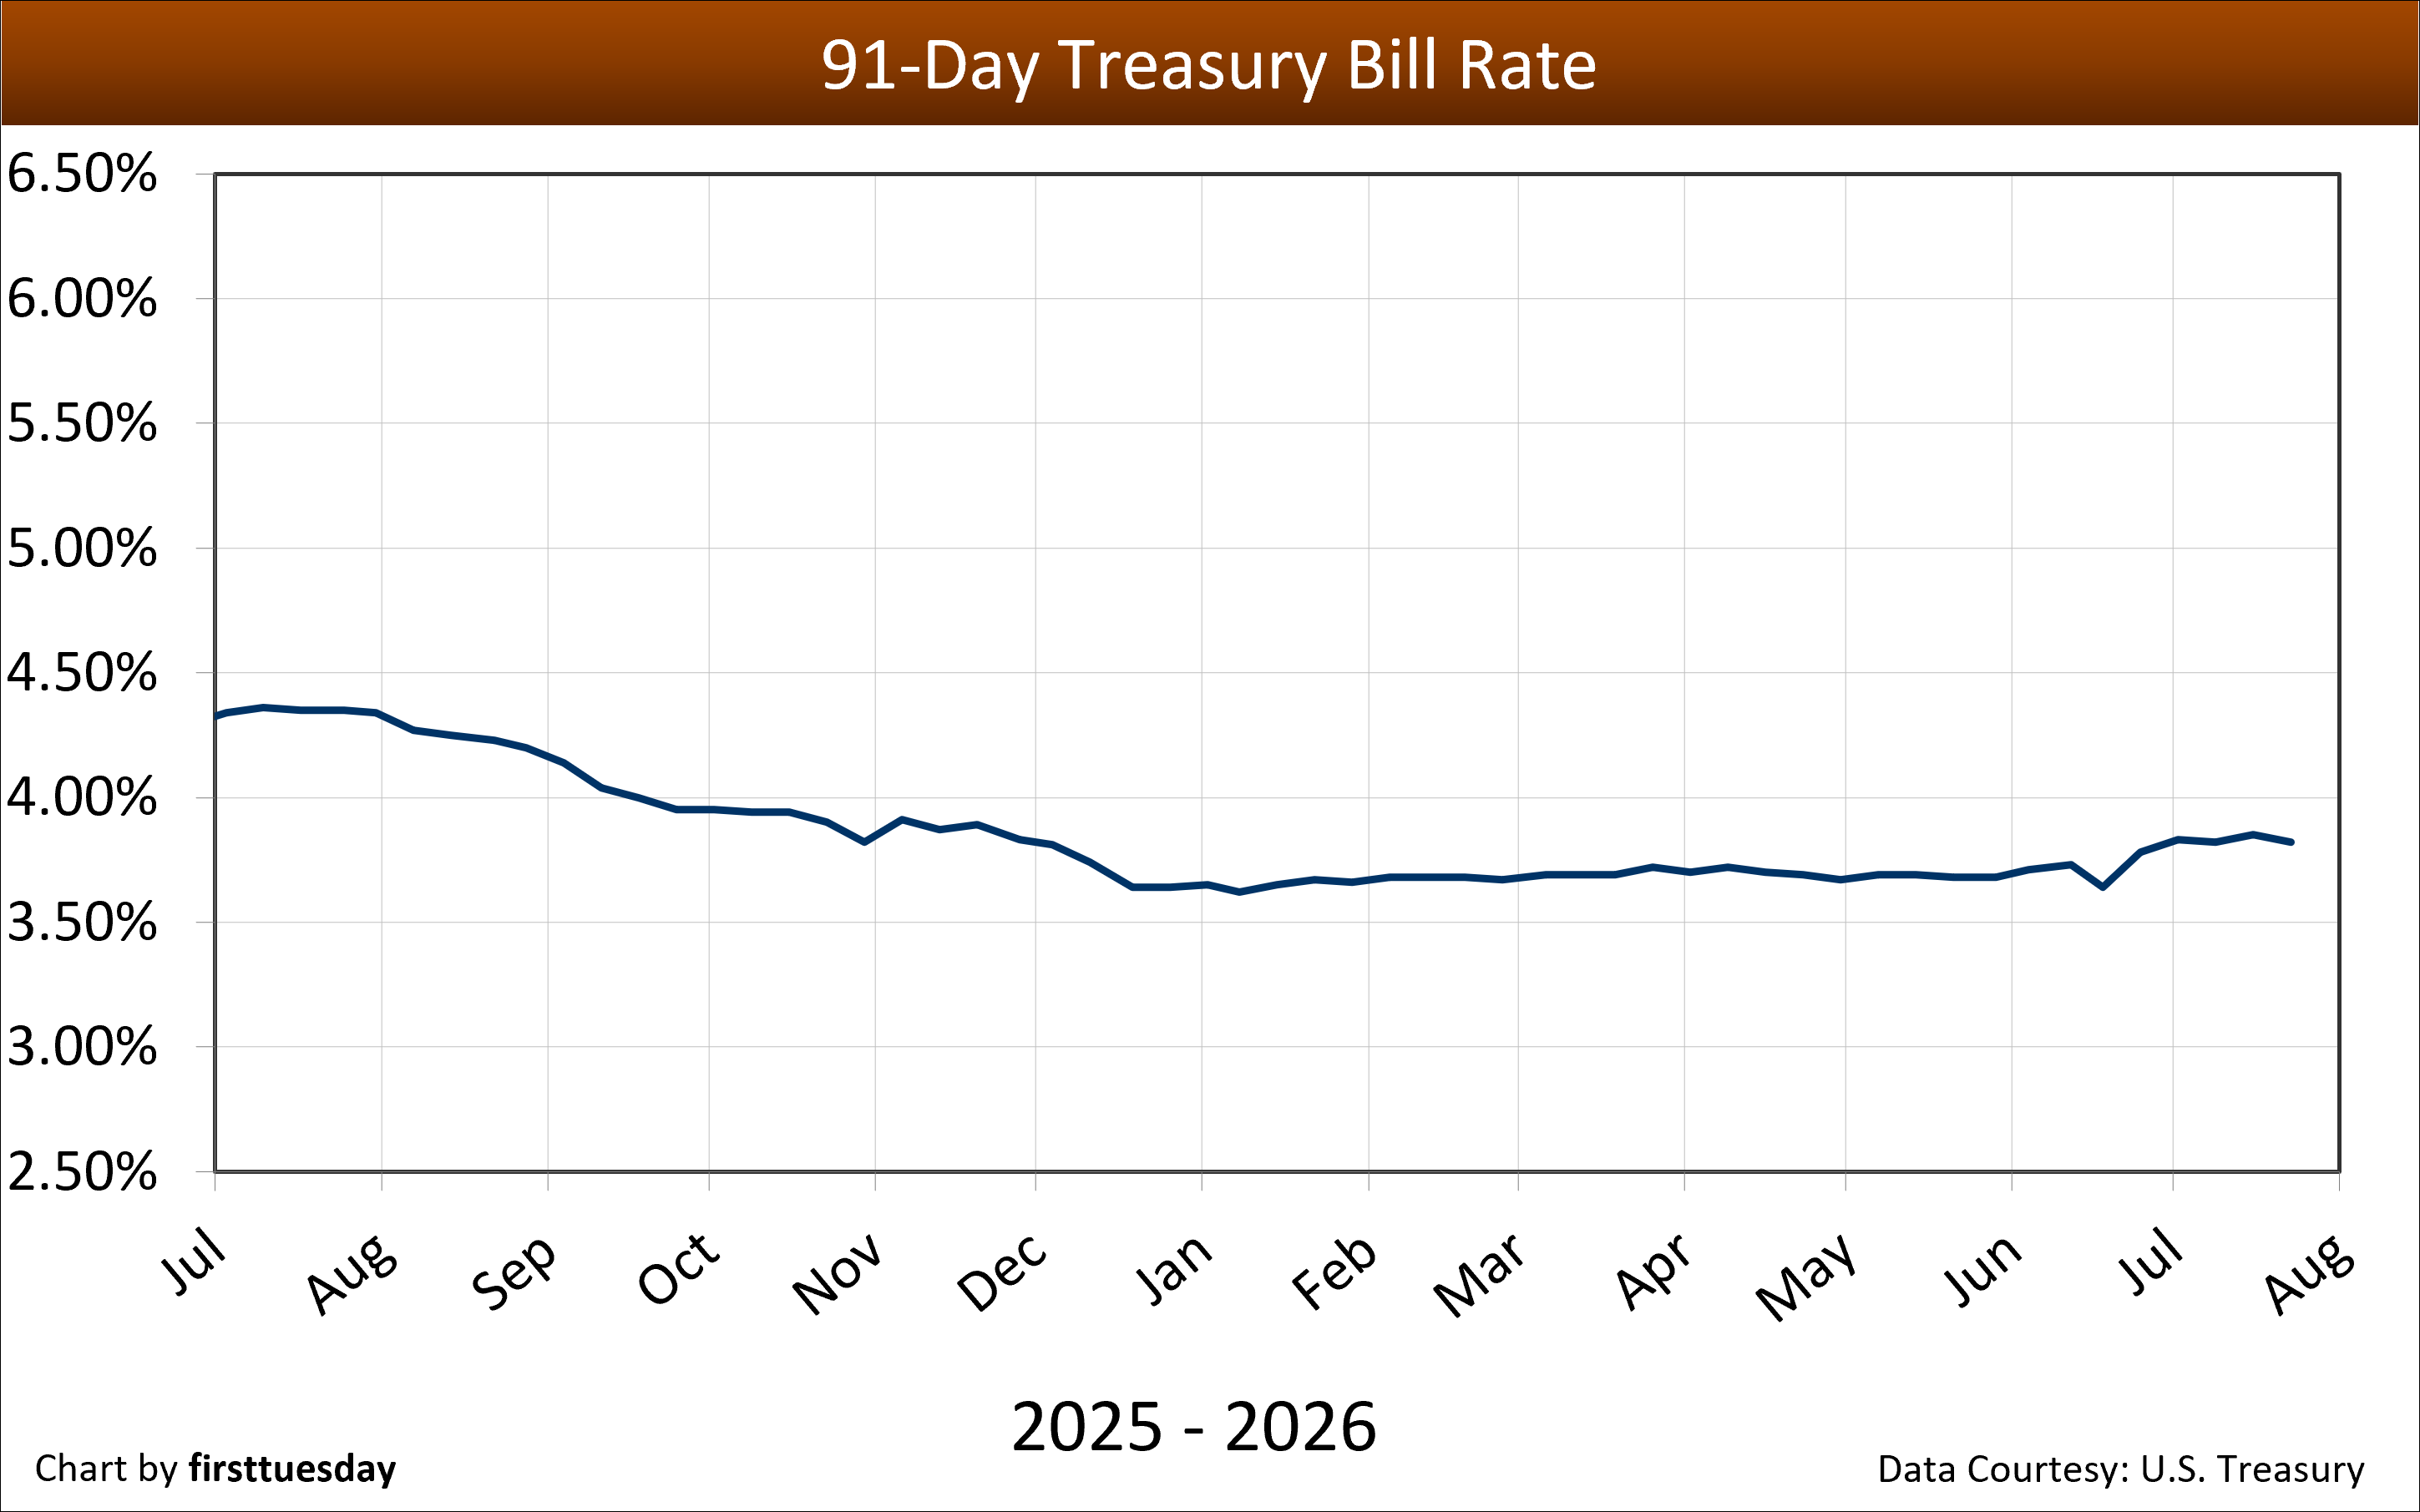 | ||
| Chart update 7/24/26 | ||
Current 7/23/26 3.82% | Month Ago 6/25/26 3.78% | Year Ago 7/25/25 4.35% |
This rate determines the minimum interest rate the seller must use in a delayed §1031 transaction and report when not receiving interest on §1031 monies held by a facilitator/accommodator. This rate also sets the amount of the ordinary income the facilitator/accommodator must report. | ||
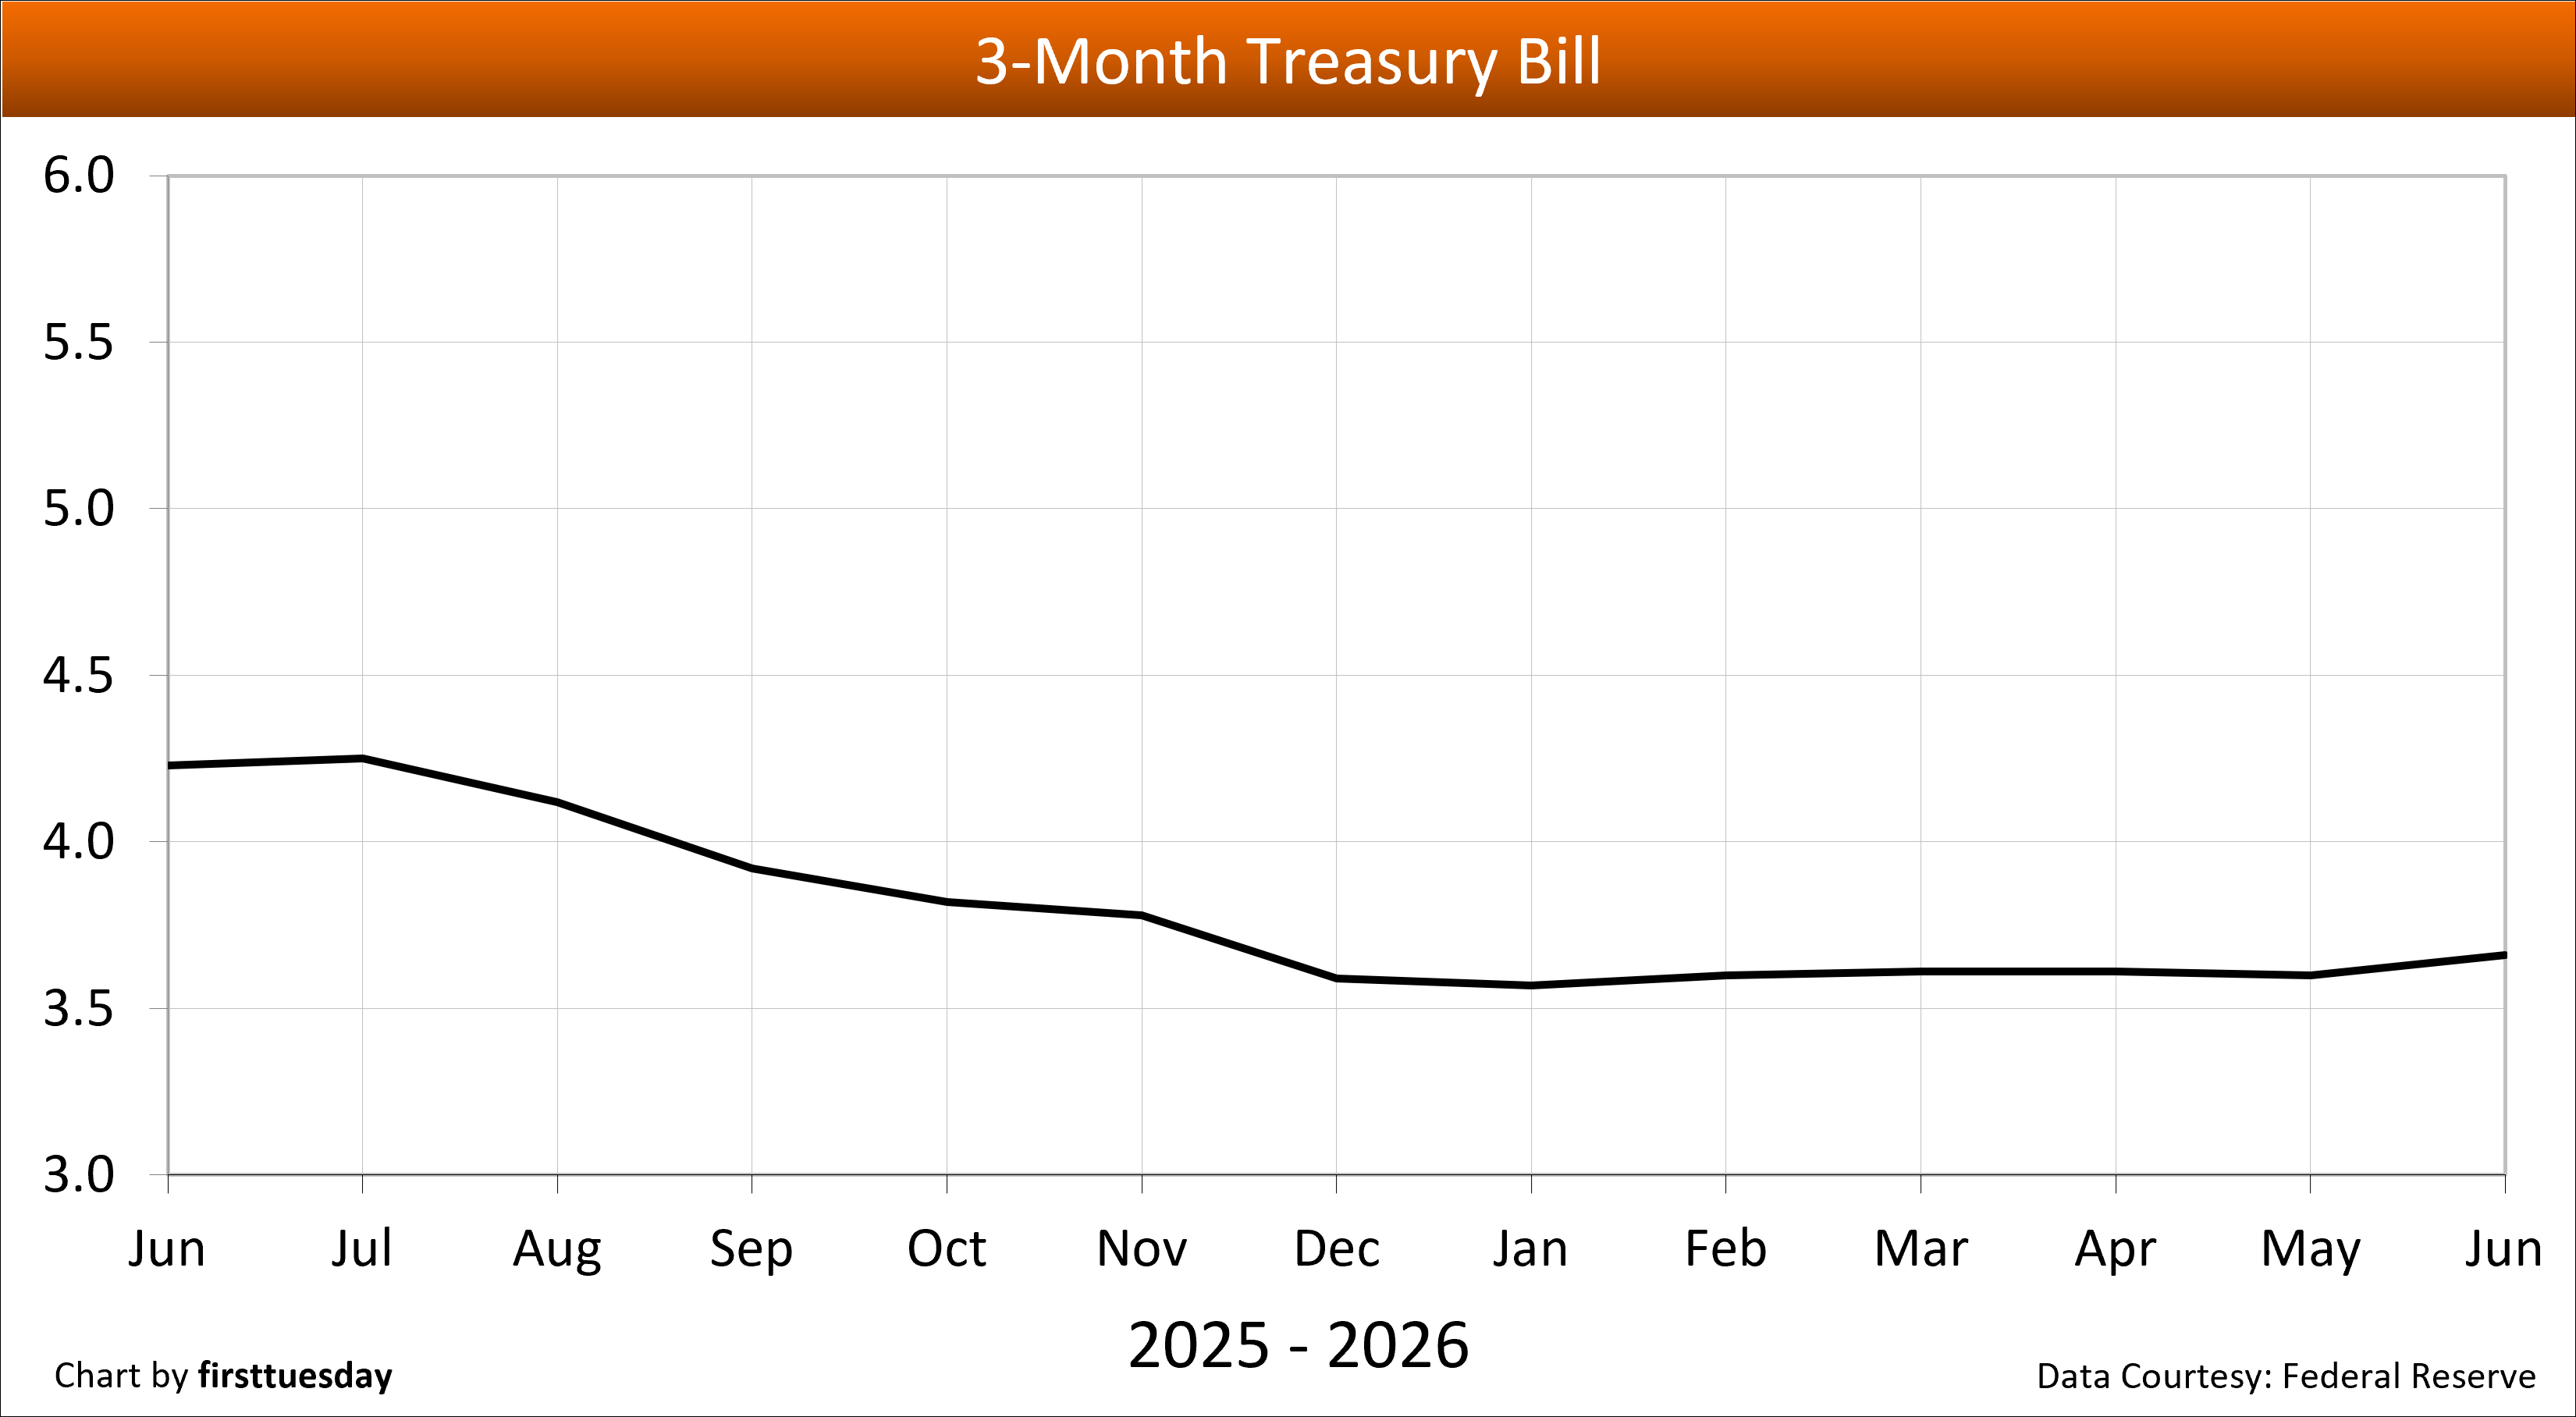 | ||
| Chart update 7/2/26 | ||
June 2026 3.66% | May 2026 3.60% | June 2025 4.23% |
The 3-Month Treasury Bill rate is heavily influenced by the Federal Reserve through the Fed Funds Rate as the base price of borrowing money in the short-term. It is used in determining the 3-month:10-year yield spread used to predict the likelihood of a recession one year forward. The posted rate is the monthly average for the listed month. Rates are released with a one-to-two month reporting delay.
| ||
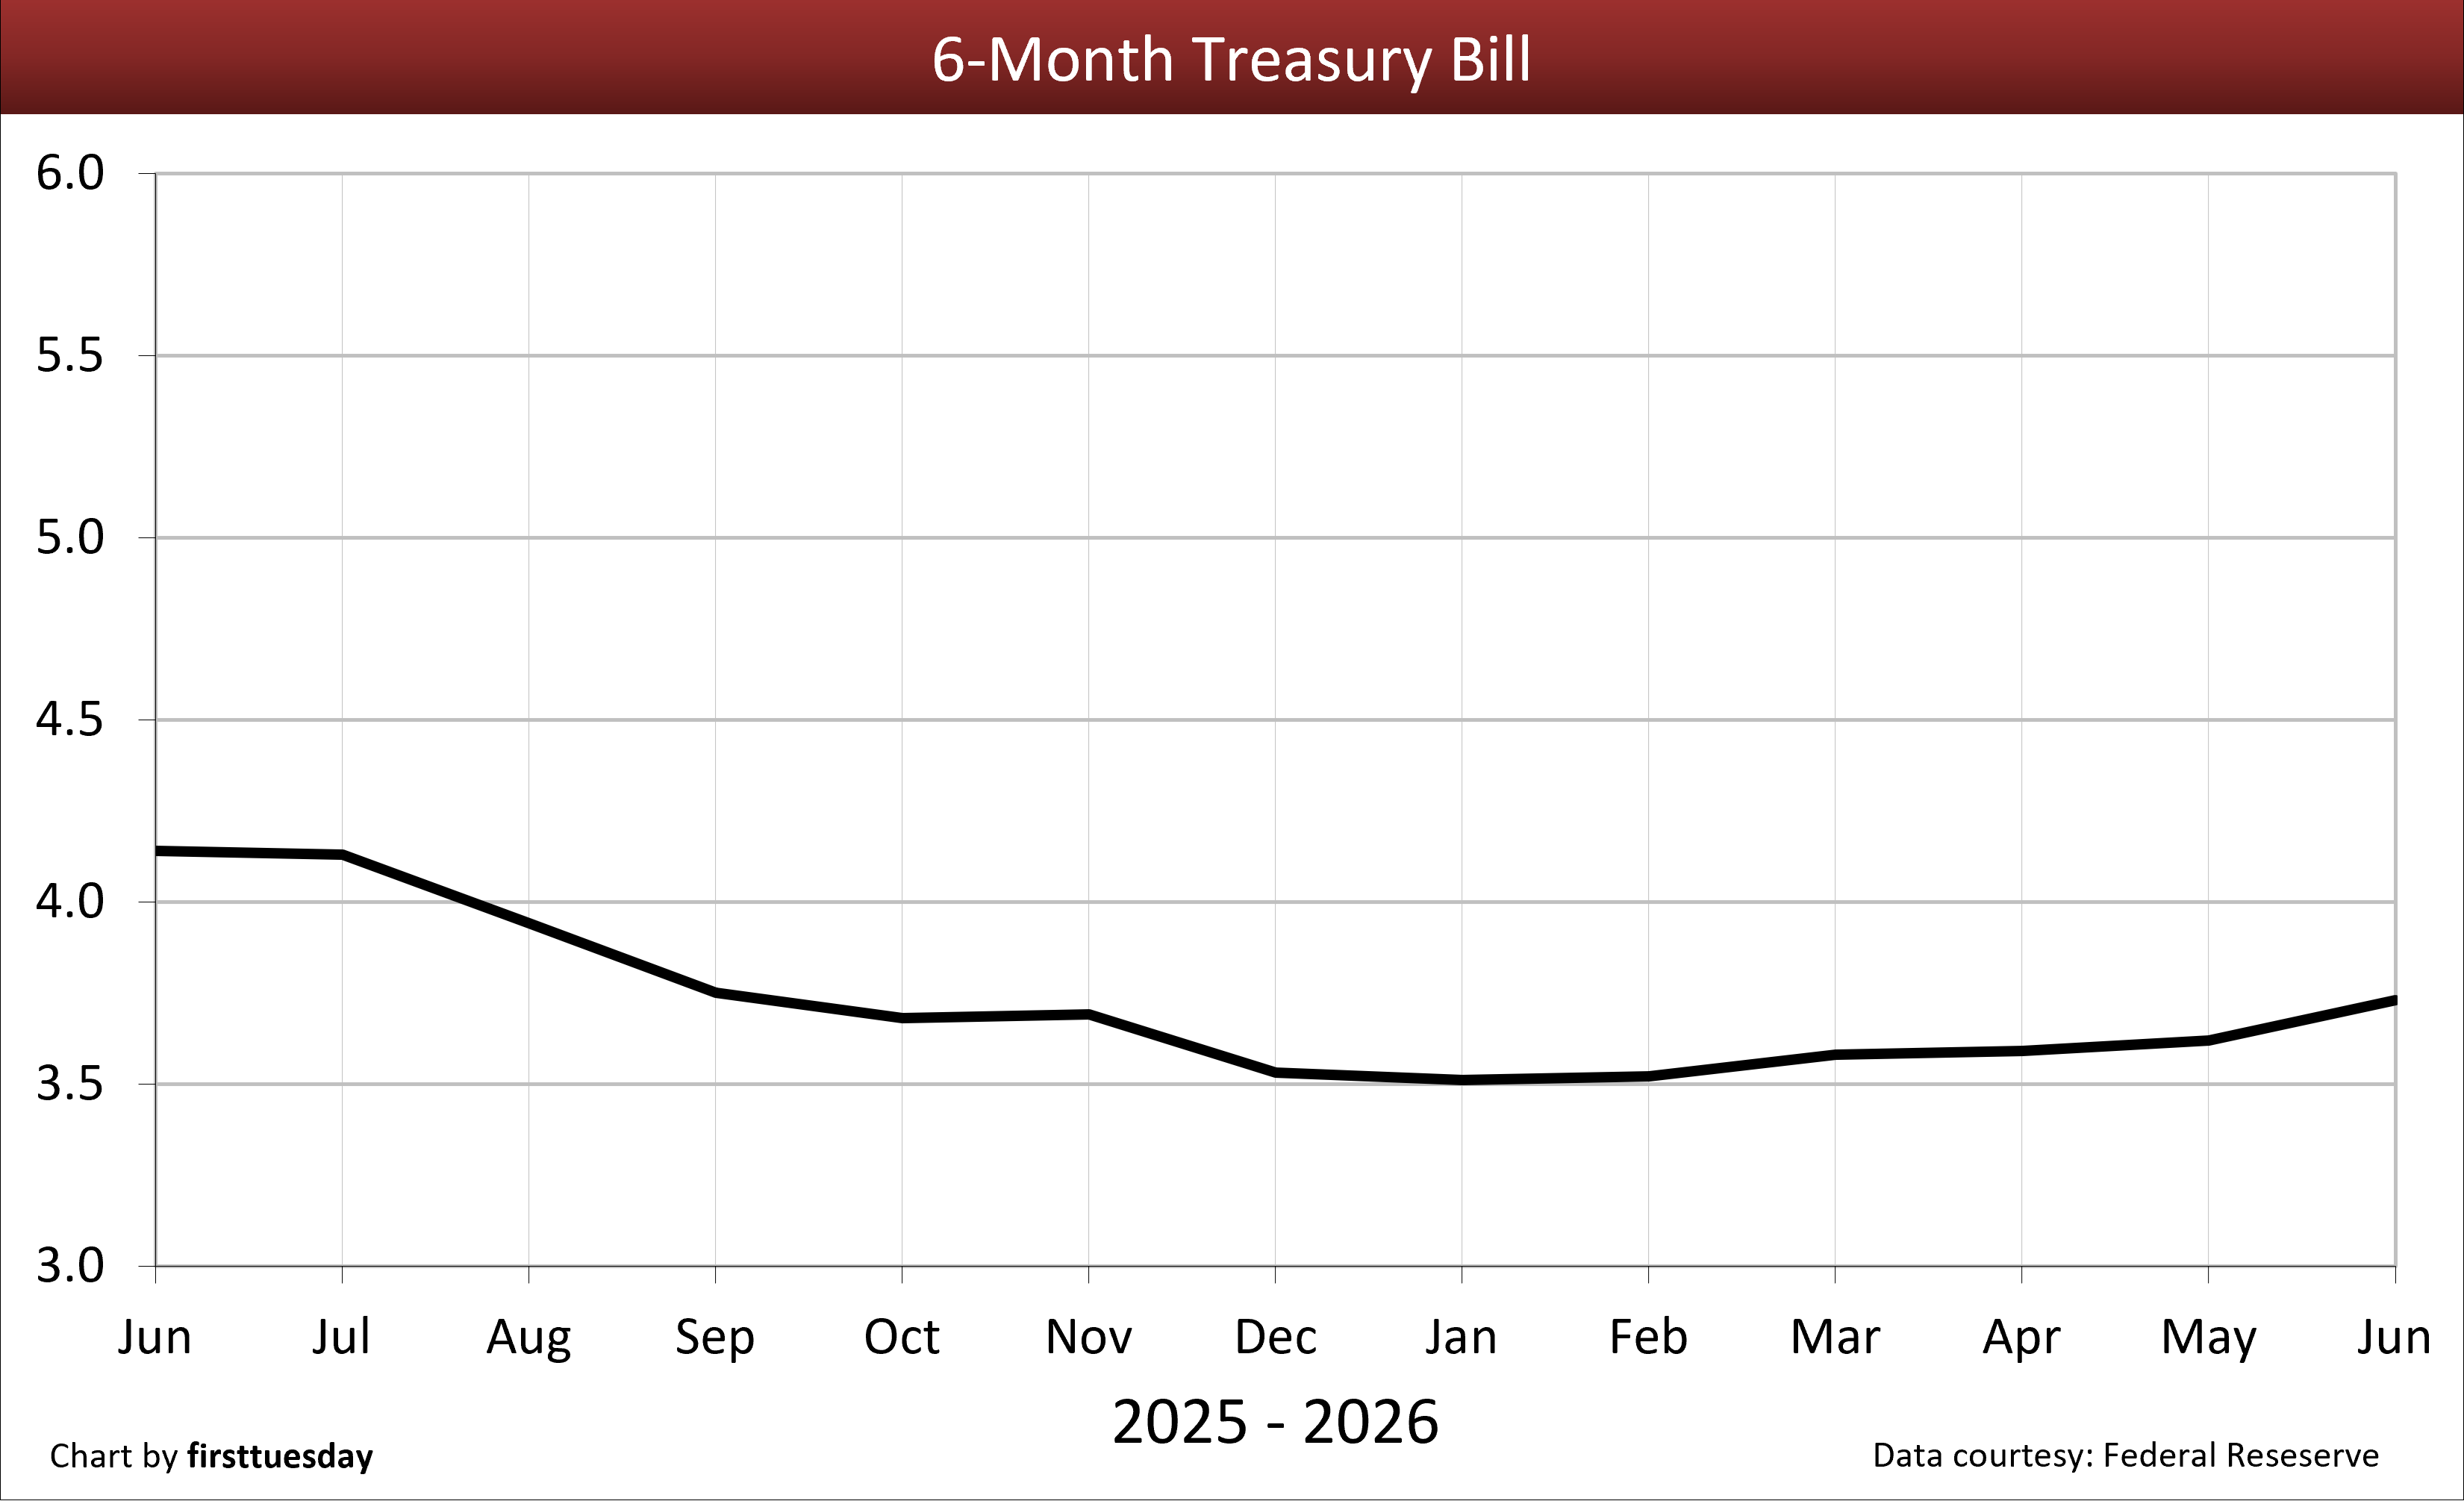 | ||
| Chart update 7/2/2026 | ||
June 2026 3.73% | May 2026 3.62% | June 2025 4.14% |
The six-month T-Bill rate is one of several indices used by lenders to periodically adjust the adjustable rate mortgage (ARM) rate. The adjusted rate equals the indexed rate (at the time of adjustment or an average of several prior rates) plus the lender’s profit margin. The posted rate is the monthly average for the listed month. Rates are released with a one-to-two month reporting delay. | ||
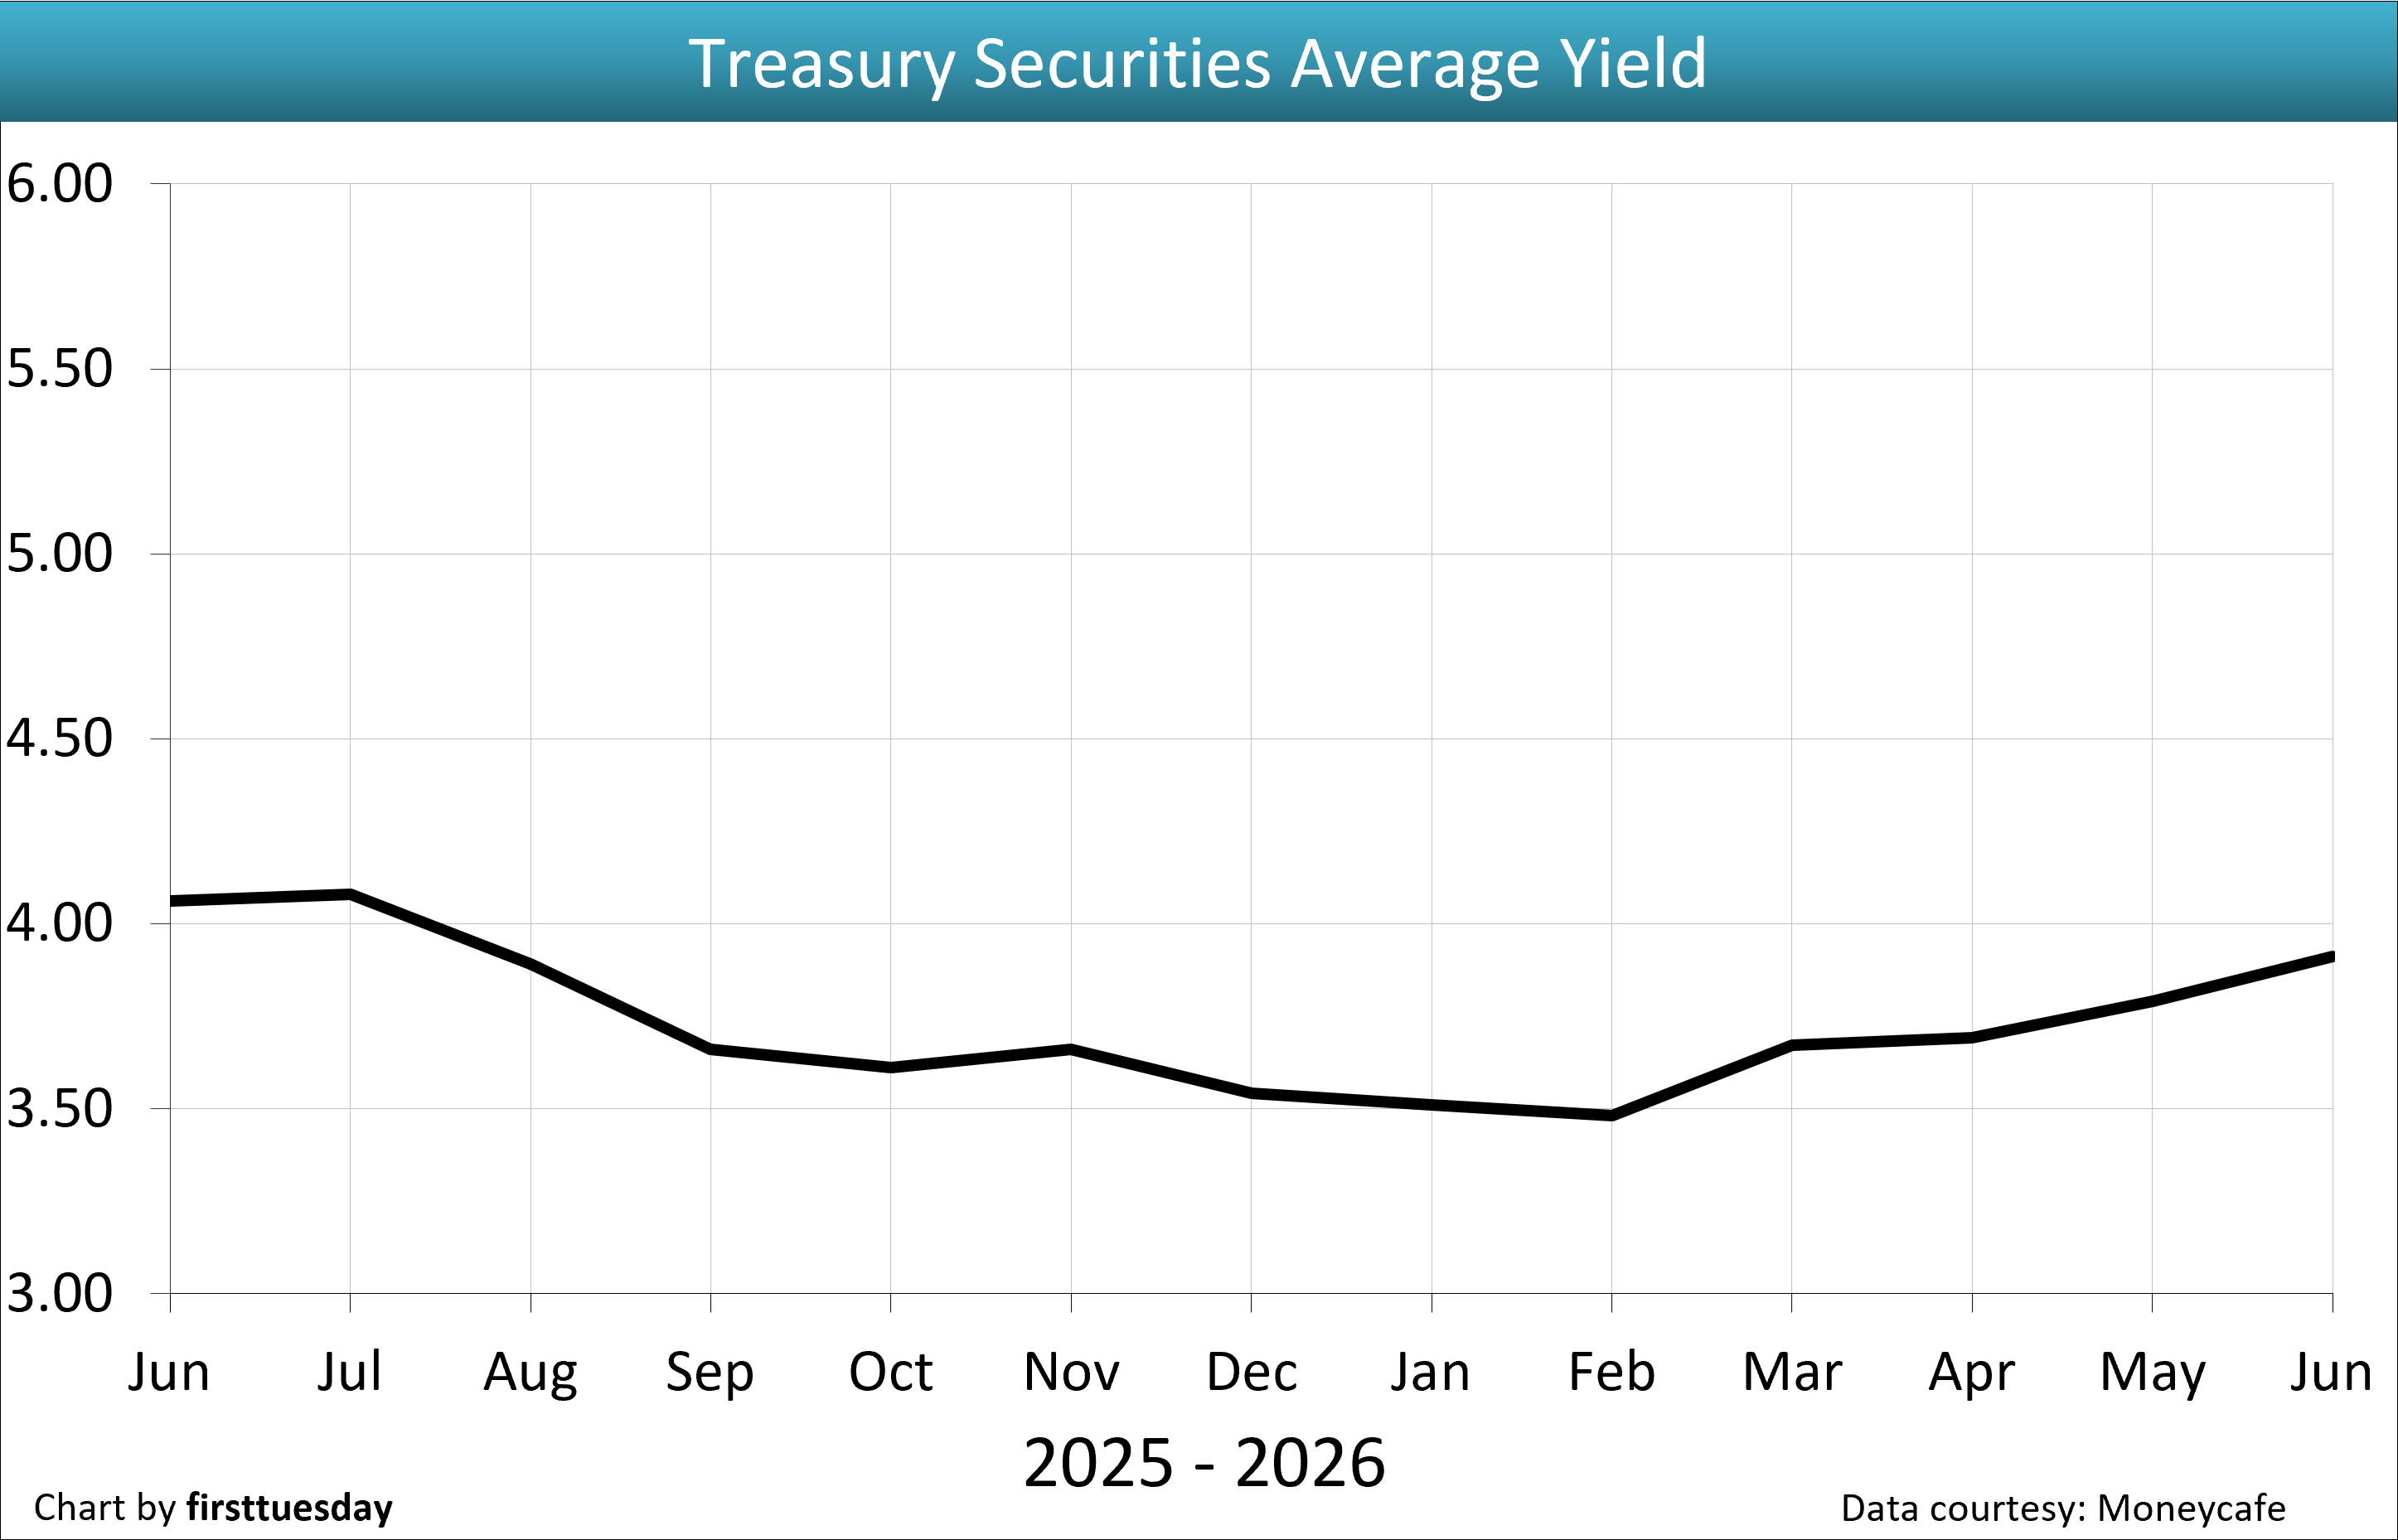 | ||
| Chart update 7/2/26 | ||
June 2026 3.91% | May 2026 3.79% | June 2025 4.06% |
This index is one of several indexes used by lenders as stated in their ARM note to periodically adjust the note’s interest rate. The ARM interest rate equals T-Bill yield, plus the lender’s profit margin. The index is an average of T-Bill yields with maturities adjusted to one year. | ||
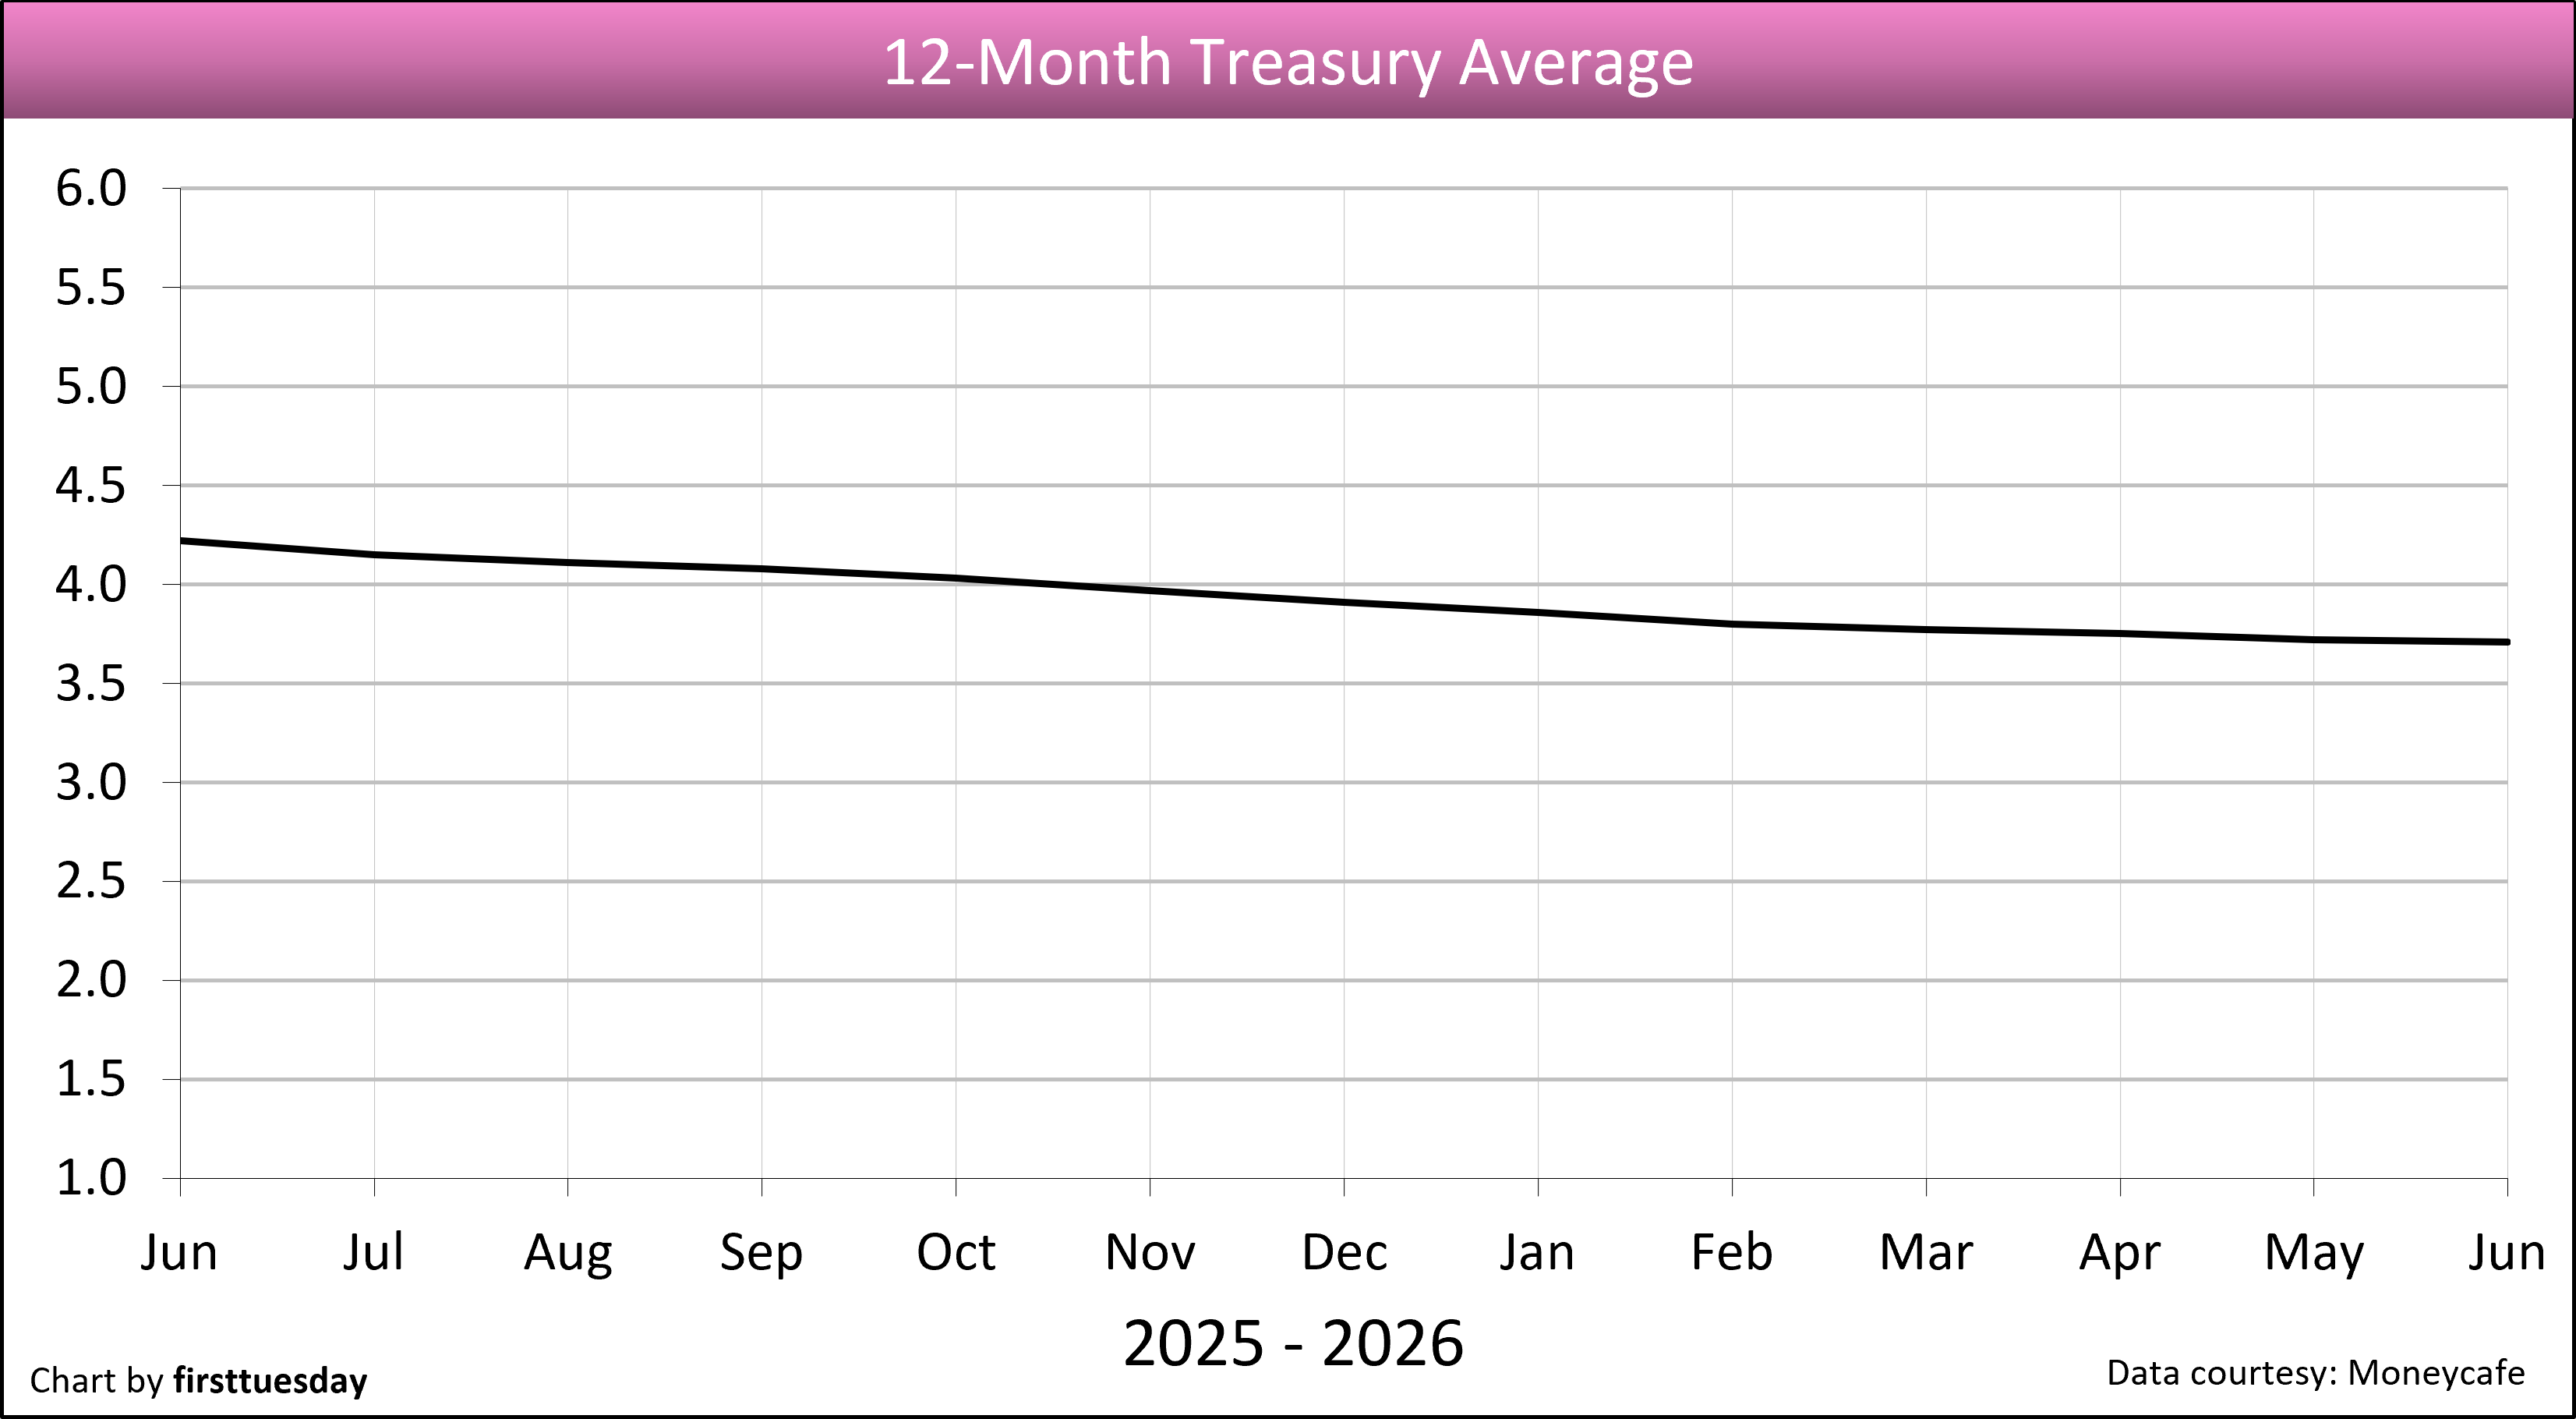 | ||
| Chart update 7/2/26 | ||
Current June 2026 3.71% | Month ago May 2026 3.72% | Year ago June 2025 4.22% |
This index is one of several indices used by lenders as stated in their ARM note to periodically adjust the note’s interest rate. This figure is an average of the one-year T-Bill rates for the past 12 months. The ARM interest rate equals the 12-Month Treasury Average yield plus the lender’s profit margin. There is a one-to-two month lag in data reporting for the 12-Month Treasury Average. | ||
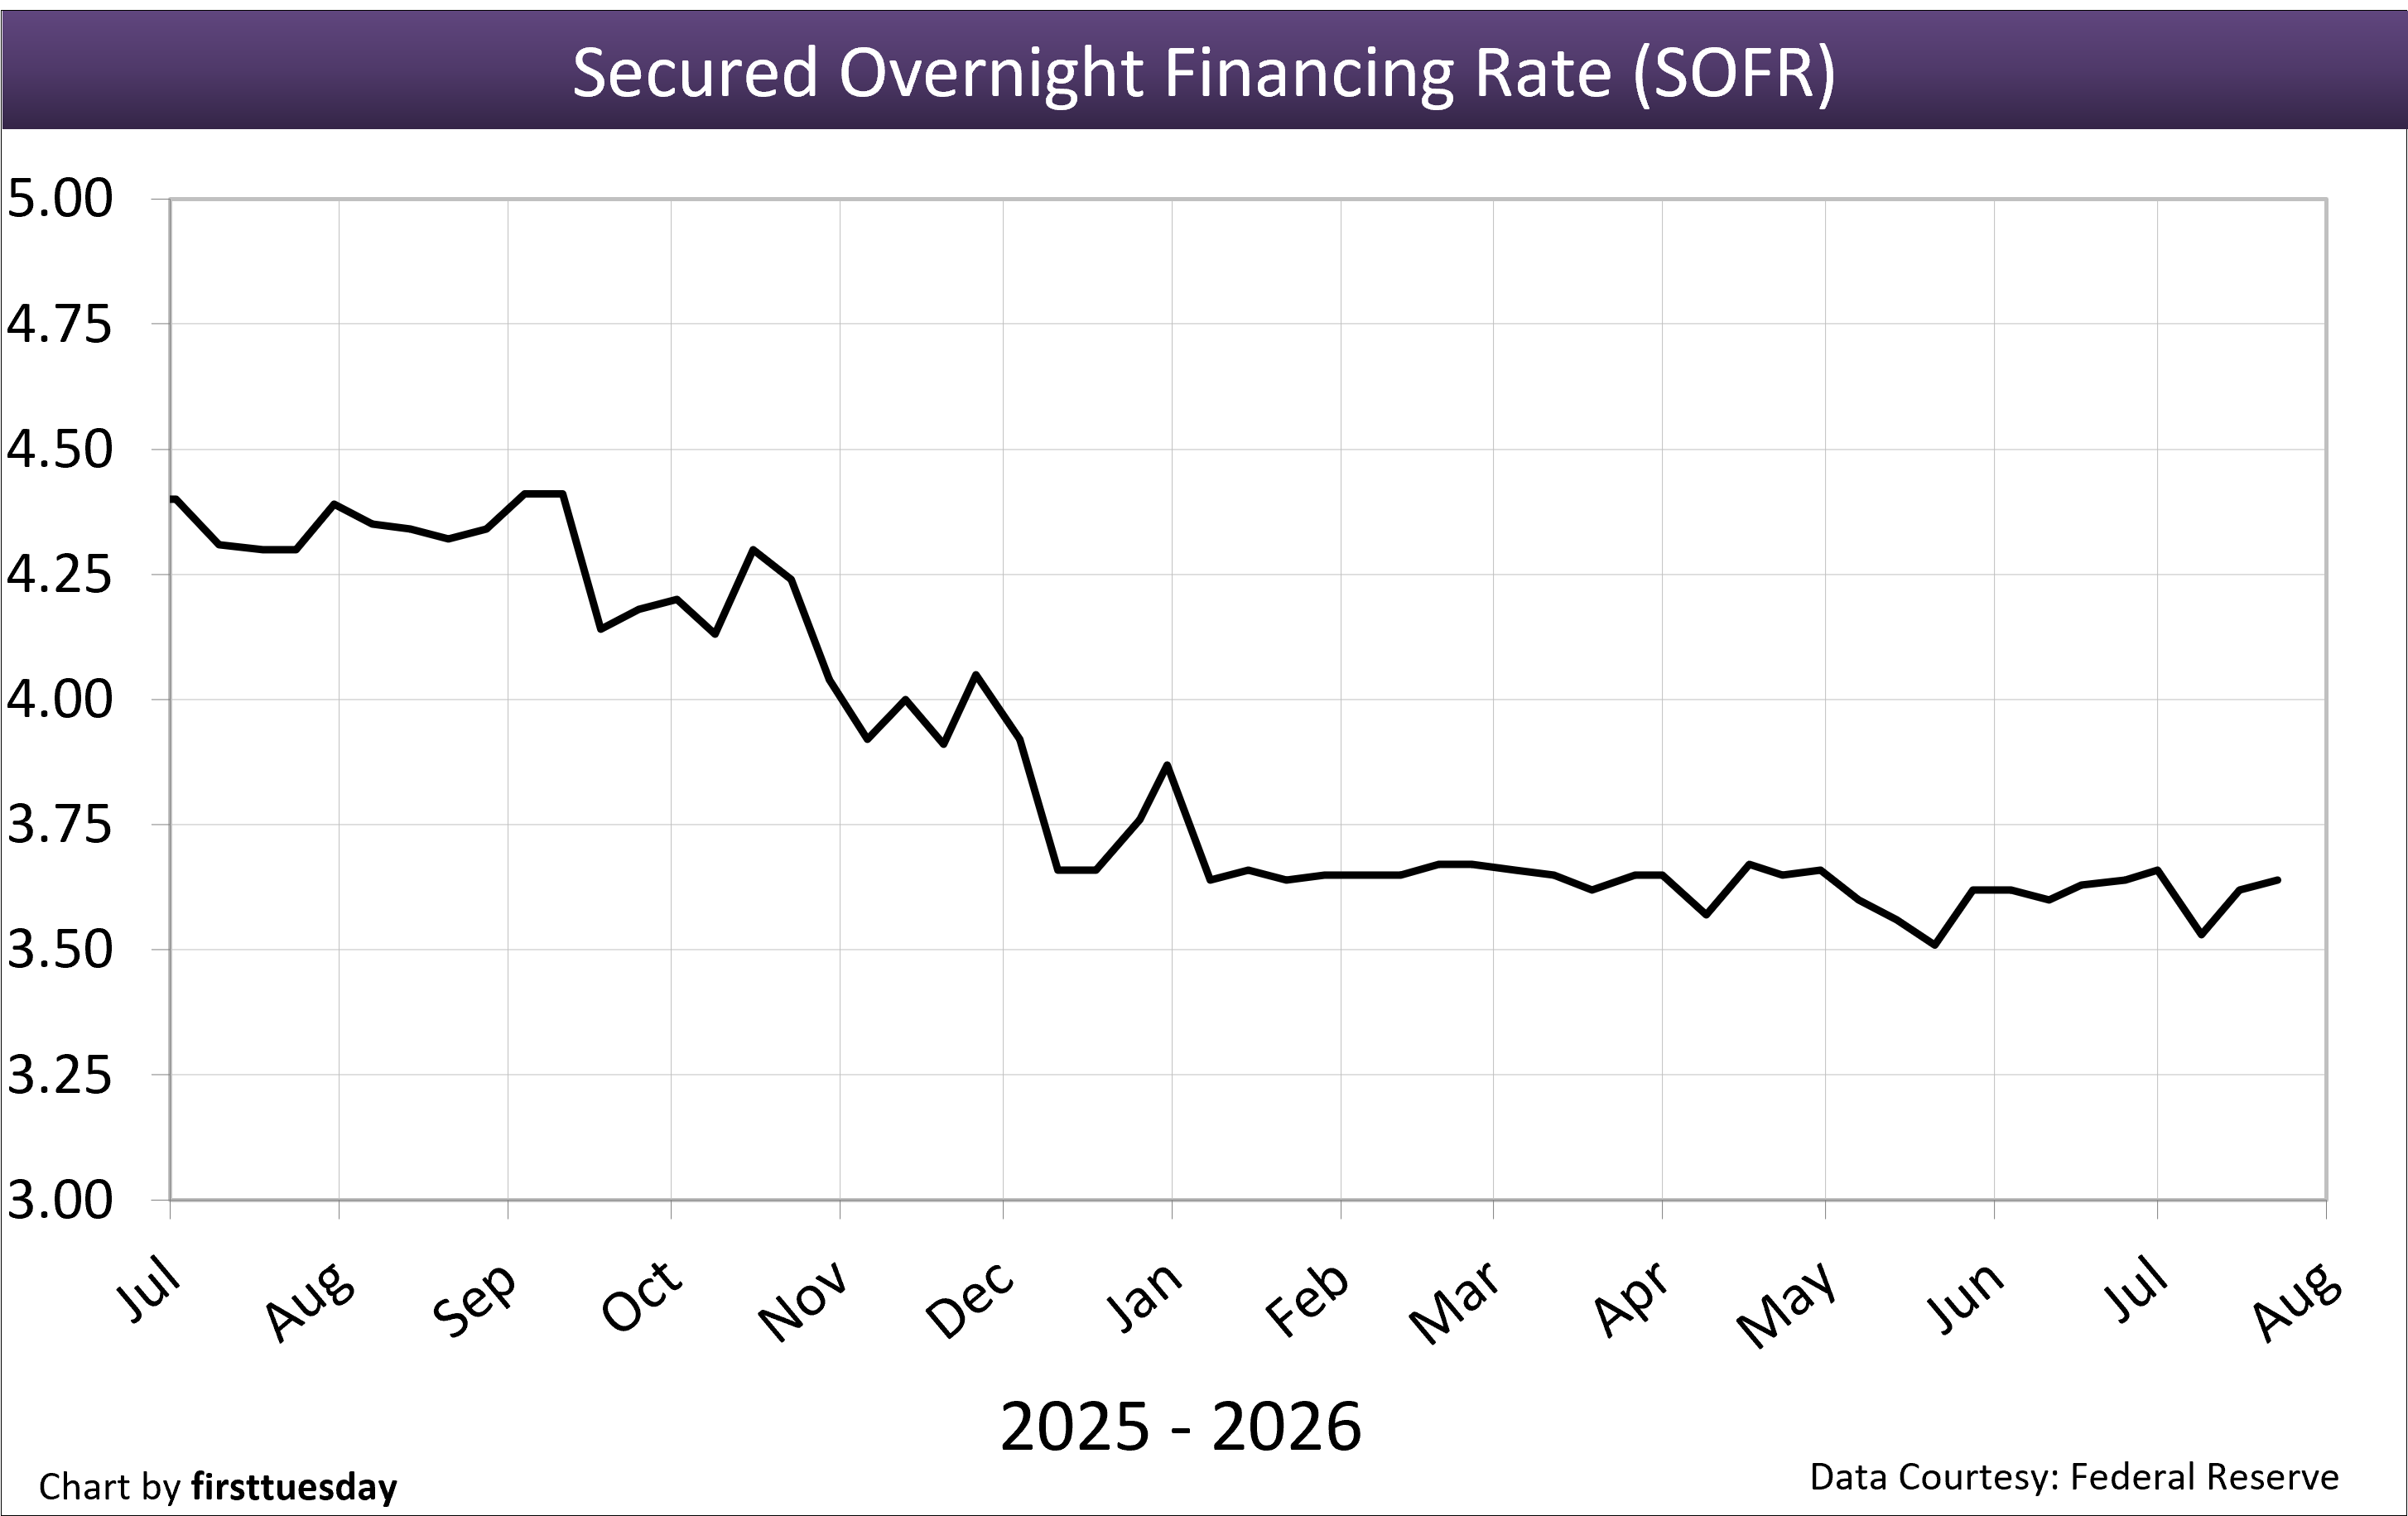 | ||
| Chart update 7/24/26 | ||
Current 7/23/26 3.64% | Month ago 6/25/26 3.64% | Year ago 7/24/25 4.30% |
This index is one of several indices used by lenders as stated in their ARM note to periodically adjust the note’s interest rate. It replaced the LIBOR in 2021, which was found to be manipulated in the years leading up to the 2008 recession and financial crisis. The ARM interest rate equals the SOFR rate plus the lender’s profit margin. The rate is based on overnight borrowing in the U.S. Treasury repo market. The SOFR is produced in a transparent manner and is based on observable transactions, rather than models, and, unlike the LIBOR, is not dependent on bank estimates. | ||
 | ||
| Chart update 7/2/26 | ||
Short (3 years or less) July 2026 2.99% | Medium (3 to 9 years) July 2026 3.24% | Long (9+ years) July 2026 3.71% |
These rates determine minimum interest yield reportable on carryback financing. The applicable federal rate (AFR) category is determined by the carryback due date. Rates are for monthly payments, reported for the coming month.
| ||


Excellent Set of GRAPHS 4 THE PUBLIC! 2 BAD THEY CAN’T UNDERSTAND IT UNLESS THEY HAVE A BUSINESS DEGREE LIKE ME!
Invest in property …while the rates are extremly low and our market prices in Ca.are half of the price as a home or piece of land 8-9 years ago. It may be years before we have a total recovery and the home price may not go up to where it was, butit is the best way to invest and cheaper to buy then to rent.
How low can it go? The U.S. government–up to its ears in debt–is still able to borrow at unbelievably low rates (well under 2%) from foreign investors. That ability is currently based solely on the belief that American will always pay its debts and is a good investment risk.
How about a little glimpse of macro-economics?
Now could that perception ever change? If ever the foreign investors come to decide that America might not pay its debts, then we would see a sudden rise in interest rates that would boggle the mind, kicking off a massive inflation in consumer goods or plunging us into a deeper depression with deflation—take your pick.
The U.S. government runs on borrowed money—borrowed from foreign investors.
FACT: The massive U.S. debt as it currently stands, could NEVER be paid off. But if the dollar were devalued (as Roosevelt did in 1934) the debt might be paid off in cheaper dollars. This would be concomitant with a rise in the Chinese yuan.
Here’s the catch: This would be done on the backs of the American people, as it would likely spur massive inflation and cause a spike in interest rates.
With rates so low, and other investment vehicles so turbulent, it would make perfect sense to invest in housing for rental income at this time.
ditto
Concise information, clearly explained. Good stuff!
Still more good news”
helpful Synopsis
You guys are great and I look to you for unadulterated truth.
No fear of me straying with great articles like this.
Next time I renew u can bet its with your program.
Really appreciate your continued current info on all types of market rates, sales, home prices, etc. Very useful for those of us working this business every single day.
Thank you for all of the great info and data each month!
Hi ,
This is a very helpful analysis. Keep it up monthly for those that are serious about following ARMs.