
Everyone wants to know the best time to buy, sell or hold real estate. Three factors, explained in the charts below, help you anticipate the best action to consider for 2021 and beyond.
The yield spread has rebounded since dipping below zero in mid-2019 as various economic factors lined up to produce the 2020 recession. When the yield spread goes negative, a recession is forecasted to arrive 12 months later. In this case, the recession began in February 2020 and continues today. The positive, yet still weak, yield spread in Q1 2021 indicates investors are still cautious about future economic prospects, but do not presently anticipate a second recessionary dip.
Home sales volume in 2021 continues its flat-to-down trend experienced since 2016. This is due to a lack of low-tier housing availability and home prices rising ever more beyond the reach of homebuyer-occupant incomes. Meanwhile, home prices have increased significantly over the past year, the measure of which coincides directly with the increase in buyer purchasing power induced by falling interest rates. However, as interest rates have begun to bounce higher in 2021 and the expiration of the foreclosure moratorium looms in mid-2021, don’t expect price increases to continue for long. Without fuel from decreasing interest rates and absent the support of a jobs recovery, the coming wave of distressed sales will drag down home values beginning a few short months after the moratorium expires.
Today’s market signals of a weak but positive yield spread, flat real estate sales volume and overbalanced prices indicate today’s real estate investors have reached the end of the most recent sell phase. Investors entered a hold phase heading into the 2020 recession. The duration of the ongoing recession and future recovery will largely depend on government intervention in the form of additional stimulus and/or job creation programs. The next buy phase will commence with the jobs recovery, which will herald the next sustainable and predictable boom in sales volume and pricing, anticipated to begin around 2023-2024.
Updated April 1, 2021. Original copy released December 2012.
Chart 1
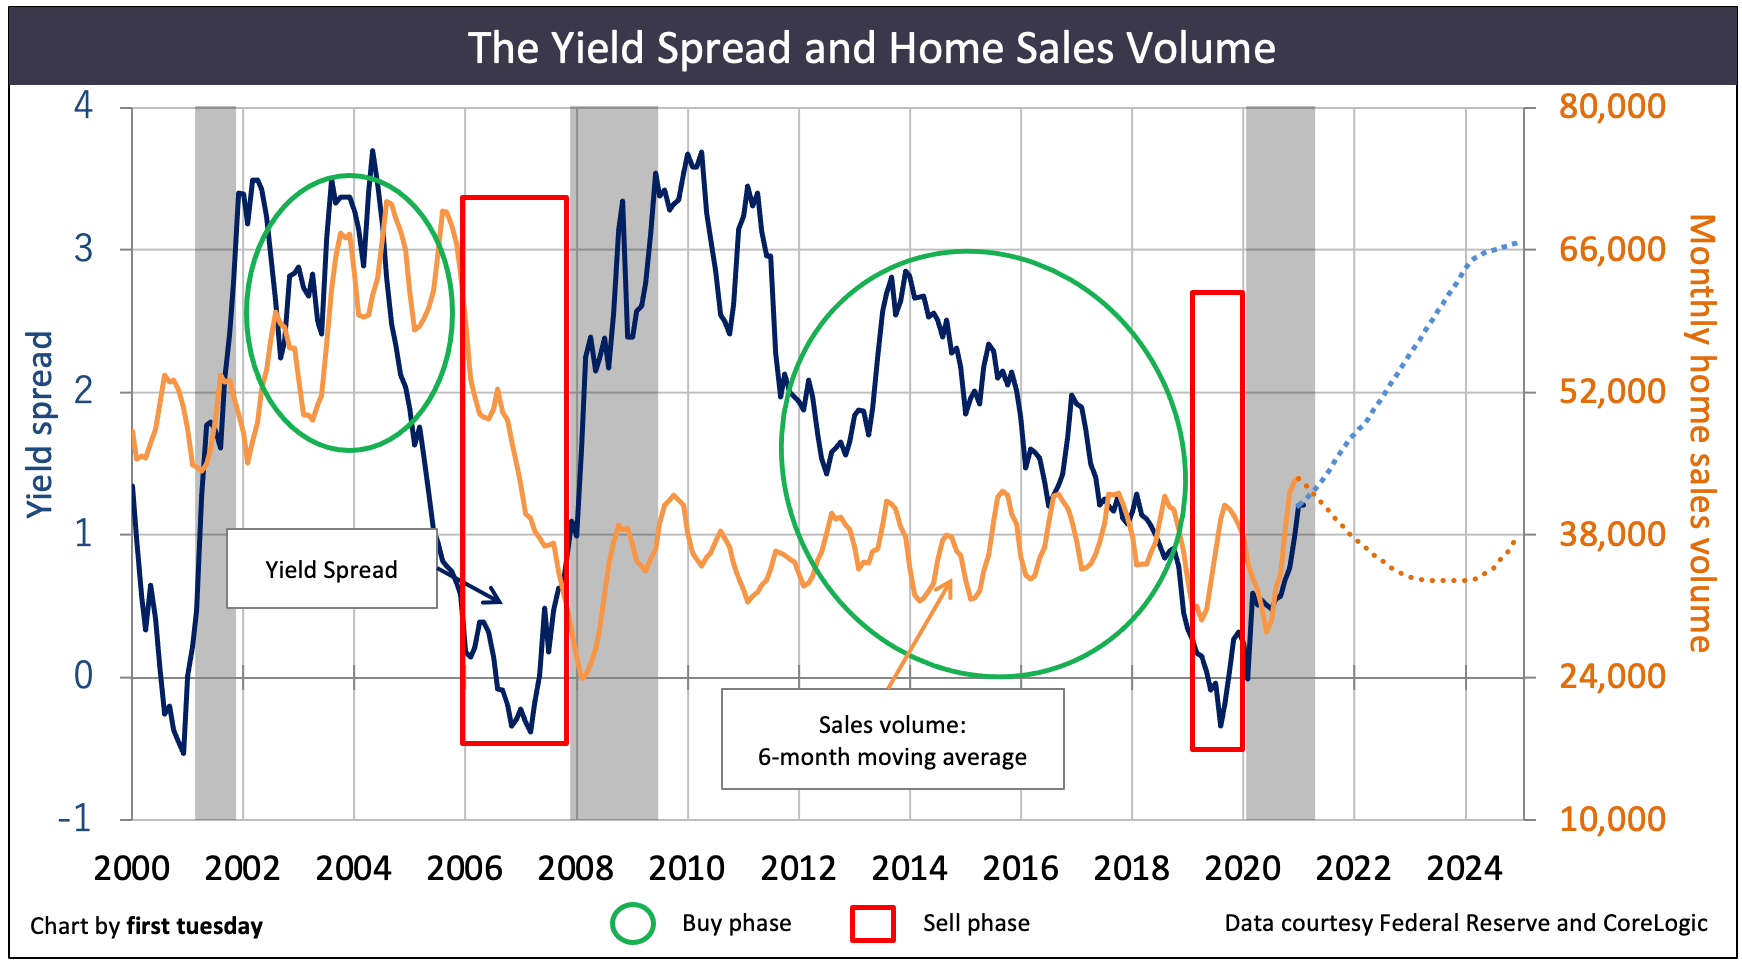
Chart update 04/01/21
| Jan 2021 | Jan 2020 | Annual change | |
| Yield spread | 1.21 | 0.24 | +0.97 |
| Home sales volume (12-month average) | 36,800 | 36,900 | +0% |
Chart 2

Chart update 04/01/21
| Jan 2021 | Jan 2020 | Annual change | |
| Home sales volume (12-month average) | 36,800 | 36,900 | +0% |
| Home price index | 320 | 286 | +12% |
These market charts are your investment planner. They tell you when a business cycle will enter a buy phase or sell phase.
To buy or sell in 2021-2022?
The best action for today’s housing market can be found by examining three factors:
- the yield spread (which forecasts future economic performance one year hence and is the difference between the 10-year Treasury Note and the 3-Month Treasury Bill rates);
- home sales volume (which forecasts home price movement nine months hence); and
- home pricing (the crucial factor of whether rental rates – as a base for applying a capitalization rate a prudent investor will use to discount future Net Operating Income (NOI)) – supports current pricing).
The situation:
As of January 2021, the yield spread averaged positive 1.21, up from 0.24 one year earlier. Today’s yield spread is low, but has rebounded from the negative figures experienced in mid-2019, which forecasted the 2020 recession.
As depicted in Chart 2, home sales volume has shown a dramatic change from quarter to quarter, but little long-term change since 2009. Total sales in 2016-2020 were essentially level.
California’s flat-to-down home sales volume continues the bumpy plateau recovery from the 2008 recession. A static sales volume forecasts flat-to-falling pricing nine months hence, absent other market influences. However, while sales have been flat since 2015, home prices have continued to increase at a pace faster than increases in wages. The distortion has to do with extra market influences — including:
- insufficient residential construction to keep up with population increases much less catch up on homebuyer demand due to nearly 1% annual population growth since the Great Recession; and
- the recent historic lows for mortgage rates experienced in 2020.
Likewise, when sales volume is rising rapidly, home prices are also likely to rise quickly, with a lag period of around six to nine months.
Speculator interference in 2012-2013 distorted price movement, causing an unsustainable price bump for lack of anything resembling pent-up end user demand. Home prices were 12% higher in January 2021 than one year earlier across all tiers of California home sales. This price bump is unsupported by sales volume and wages for monthly payments, and thus is unstable.
Price bumps are often misconstrued as cycles in and of themselves. However, they are merely the result of frenzied speculator attitudes in momentum markets to buy low and sell high within a matter of months. These short bursts in rising prices are unpredictable. You are better off not attempting to apply the factors influencing buy and sell phases to these short periods.
How can you tell the difference between a price bump and a more sustainable buy phase? Price bumps are characterized by:
- no long-term rise in the yield spread;
- no corresponding, long-term increase in sales volume; and
- unusual market factors, such as an increased speculator presence or percentage of ARM loan originations.
While home prices have increased significantly over the past year, the increase has coincided directly with the increase in buyer purchasing power induced by falling interest rates. Thus, as interest rates have begun to bounce higher in 2021 and the expiration of the foreclosure moratorium looms in mid-2021, don’t expect price increases to continue for long. Without fuel from decreasing interest rates and absent the support of a jobs recovery, the coming wave of distressed sales will drag down home values beginning a few short months after the moratorium expires.
Related article:
Long-term investors will hold onto their property until a future sell phase, when home values have had more time to appreciate.
Advanced charting: Buy, sell or wait out the market
The economy — being driven by humans — moves in cycles, much the way people behave as stop-and-go drivers on our freeways. The length of a cycle is determined by the extent and duration of economic excesses (go) and recesses (stop) during the cycle. The recent cycle from which we have emerged — 2001-2009 — had unprecedented levels of excess and recess.
Each real estate market cycle can be neatly divided into three phases:
The Buy Phase: the ideal moment for buying property is the start of the recovery. This phase is characterized by:
- cyclically lower prices;
- low interest rates;
- reduced sales volume;
- high inventory levels; and
- few willing buyers.
The Hold Phase: the phase following the acquisition of a property during the buy phase or after a sale in the sell phase, can be the longest time period in the cycle. Prudent investors patiently bide their time after a purchase, awaiting the boom or bust to play out before reentering to buy or sell.
The Sell Phase: this phase commences with a peak in sales volume. It is characterized by:
- rising prices;
- a drastic fall in the yield spread;
- low inventory levels;
- high mortgage rates; and
- reductions in monthly year-over sales volume.
The buy and sell phases each occur just once during a real estate cycle. The hold phase appears twice: once after the buy phase, and once after the sell phase.
The investor’s goal
The key to successful real estate investing is to look beyond the property’s annual operating income to the end goal: a sale. Whether on a quick flip or after a long-term buy-to-let period, the endgame is to maximize profit on a resale. That is, to sell at a price appreciated beyond the price paid and consumer inflation. Here, timing is the keystone supporting the purchase and sale activity, and thus is the profit.
For investors to sell for a profit, they first need to buy near the bottom to midway in a market recovery half cycle — the buy phase. This is when property prices are closest to their historic mean price. [See Chart 2]
It is rarely, if ever, possible to identify the top or bottom of a market cycle until after it has already passed. However, studied effort makes it more likely.
Anticipating prices
How can prices be anticipated? Fortunately, prices are a lagging indicator of real estate activity. Several early signs indicate an approaching long-term price increase.
The yield spread is the first domino in a series of movements influencing the housing market. The yield spread is the difference between the long-term (10-year) and short-term (3-month) Treasury rates. It indicates economic performance one year forward. [See Chart 1]
The yield spread directly affects home sales volume 12 months forward. Thus, if you observe movement in the yield spread, you can successfully predict the direction of future home sales volume. Six months of consistent yield spread movement is long enough to create a continuing trend.
Experience shows us that sales volume pace will follow in the same up or down direction 12 months after the yield spread trend began. Until it reverses course to run with the yield spread, sales volume will continue on its previous upward or downward path.
In turn, home sales volume sets the level of prices another nine months forward. [See Figure 1]
The best way to demonstrate is with an example from our recent history. [See Figure 1]
Figure 1: Phases of the real estate cycle
| Yield spread increases for 6 months (prepare for buy phase) | 12 months pass from the start of the yield spread movement | Home sales volume begins to increase (buy phase begins) |
| Sales volume increases (buy phase continues) | nine months pass from the start of the sales volume movement | Home pricing increases (buy phase continues) |
| Yield spread decreases for 6 months (prepare for sell phase) | 12 months pass from the start of the yield spread movement | Home sales volume begins to decrease (sell phase begins) |
| Sales volume decreases (sell phase continues) | nine months pass from the start of the sales volume movement | Home pricing decreases (sell phase ends, hold phase begins) |
The best way to demonstrate is with an example from our recent history.
1999-2002: hold phase
From 1999-2002, home sales volume declined annually even as home pricing continued its decade-long rise. The yield spread stood at an historic low, averaging 0.95 from 1999-2001. More importantly, it went negative (with short-term rates valued lower than long-term rates) for several months in early 2001. These conditions signaled an imminent recession.
When the Federal Reserve (the Fed) raises interest rates, their aim is to slow the market down, such as reduce the demand for employees. Concurrently, fewer loans are made, and sales volume slows within 12 months. However, the 2001 recession failed to fully materialize. As a result, the recession was unable to work its magic to cool the economy (and real estate prices) since the Fed prematurely bolstered the economy after September 11, 2001.
When the economy is deliberately slowed and delivers mixed signals, prudent investors hold onto their cash and their property. They neither buy nor sell.
2002-2004: buy phase
After a recession and when the yield spread has increased for a period of roughly six months, investors are to prepare for the beginning of a buy phase. Preparation includes researching location – where and what type of property the investor will buy – and price – how much they will pay.
The actual time to buy? Once the yield spread begins to waver at its peak, as in late 2001/early 2002. As can be seen in Chart 2, 2002 demonstrated upward price movement above the 2001 trough, increasing to a price peak in 2005. After that, prices slipped, then plunged.
The buy phase continued from 2002 through 2004. Preferably, an investor would have bought early in 2002 and waited until 2005 to sell. This waiting game is strategic — wait too long and you may lose money. Or, sell too soon and you may receive less than the maximum return on investment (ROI).
2005-2006: sell phase
When prices have risen sufficiently for you to meet your profit goals and the economy is delivering signals that the buy period is ending, sell. Sell periods are the shortest, quickest phases of the cycle.
The briefness of the sell phase is due to public pessimism. The general public is slow to trust the market (causing slowly rising prices) and quick to get out at the slightest hint of falling prices (causing a sharp price drop). Therefore, one ignores the signs of a sell phase at one’s peril: it will be over just as soon as it began.
When sales volume starts to drop, real estate prices continue to increase for about nine months. Prices rise beyond sustainable demand and sales volume declines further.
In 2005, both the peaks and low points for monthly home sales volume were lower than the previous year’s, the presage of a price drop nine months forward. This slip in home sales volume is the clearest indicator the sell phase is ending.
In 2006-2007, the price dropped abruptly, further accelerating within a matter of months. The time for selling preceding a price drop is marked by general optimism about ever-increasing prices. New buyers arrive every day, but in fewer numbers, still expecting unlimited profits on a resale. These late-arrival optimists are unaware of the quicksand beneath their feet.
A savvy investor can see the dramatic fall in home prices coming even before sales volume decreases. As soon as the Fed increases short-term interest rates for 6 months continuously, investors must prepare themselves to sell.
The Fed began raising rates in August of 2004. The yield spread began its precipitous fall just ten months later. It then dipped below the 1.21 spread which portends a recession some 12 months on. On schedule, the upward home sales volume reversed in mid-2005. Nine months later in 2006, again on schedule, home prices peaked and began their nosedive.
When selling is the short-term goal, sellers must be ready to list as sales volume begins to flag. Investigating price levels for comparable properties determines an appropriate listing price, and the acceptable sale price. Equally important, an investor uses this time to locate a broker or agent who will aggressively market the property, locate a buyer and close escrow.
Real estate is local
Of course, this theme has variations. Real estate demand is highly localized. Thus, a thorough knowledge of local economics is necessary to accurately pinpoint the real estate phases.
Even when the yield spread is continuously increasing, pockets of high loan-to-value ratio (LTV) mortgage debt and low-income buyers may blunt any future stable price increases. There just isn’t sufficient buyer-occupant demand. This situation is currently observed in Riverside, San Bernardino and much of the Central Valley, though driverless vehicles for commuting are likely to put end to that.
Likewise, regional employment levels can either escalate or kill the profit-making aspects of a buy phase. After all, employment is the basis for a buyer’s ability to take out a mortgage and create demand for real estate. Thus, suburban locations have their own demand issues separate from coastal areas, where job opportunities are most abundant.
When employment is rising but prices remain low, it is time to prepare for a buy phase.
This is the time to:
- canvass your region and categorize local inventory.
- select where to buy, whom to work with and what type of properties to purchase (size, valuation-rent);
- investigate the local lenders and their rates, including getting pre-approved by multiple lenders; and
consider short- and long-term ownership objectives, including what type of property (multi-family, SFR, vacation home, etc.) will meet your goals.
Risk of opportunities lost
It must be emphasized, of course, that it is ultimately impossible to determine the absolute best moment to take advantage of an economic boom – to sell; or crisis – to buy. Those moments only become realized in hindsight. In this copy, we have identified historical moments of opportunity for the reader’s consideration. However, our forecasted ideal times to sell and buy are only informed opinions, sometimes jokingly referred to as educated guesses. Facts and data can only be derived from the past as they have been experienced.
The actual decision of whether to buy or not depends not only on the economy — which is highly localized — but also on the specific homebuyer, and the seller’s willingness to carry paper.
2021 and the following few years will not be times of untrammeled get-rich-quick investment opportunities. Nonetheless, if you have an eye for long-term market stability in real estate prices, you will be rewarded.
Related article:


Perfect article about realtors
Great article, thank you for this write up.
WOW!! I love this author/teacher! The articles are very in depth! I am a licensed real estate agent. I’ve never seen such awesome charts and teaching like this! I love how the author walks you through various scenarios. I”m getting into residential real estate REITS. I need to understand all this stuff. I will need to study all of this in much more detail here. Anyways, awesome articles and charts! Thanks so much!
In the next few days I’m closing escrow on selling my residence. I’ll rent for a while waiting for prices to soften then buy another residence.
Why did I decide to sell? Nothing more than my opinion that values in my area are at least 20% too high along with there being a significant shortage of houses for sale.
Any uptick in interest rates will cause the present market to crater.
Prices have almost doubled since 2015…
Timing is impossible!!
This is a fantastic starter article for anyone just getting their feet wet with real estate investing. Thank you very much for the content!
If anyone needs private capital for real estate investing in CA please take a look at my company’s site, I’d love to work with some people that really understand the ebb and flow of the market:
http://www.AAAPrivateMoney.com
It is a fact that the sale price of homes is driven by supply /demand.
and it is a fact that the population keeps going over time and people need housing to live in–thus an ever-increasing demand.
so, this increasing demand for less and less land creates rising prices based on the law of supply and demand. Even some of the public nets the landlord who has to build new housing to provide for the demand has to pay ever increasing prices for land ( and materials and labor).
the yield spread has little too do with the demand of n ever increasing population for housing.
The “yield spread’ has nothing to do with the supply of housing. the “yield spread” has nothing to do with the ever increasing population and it’s need and demand for housing.
But most importantly it is a fact that, nationwide, over the long term, the price of housing doubles roughly every 10 years. ( about an average of 7% a year) . In other words real estate is not a short term investment but is a long term investment.
It is a fact that the yield spread is not a long term forecast but rather is only a short term forecast—-and therefore has nothing to do with the capital gain of a real estate investment.
Lastly, if prices of real estate drop in the short term , that creates “bargain prices” that brings out all the investors and speculators who buy like crazy and this demand by investors drive up the price of real estate.
Carrie, the more I read your articles, the more I agree with them. But…… they are kinda “conservative” aka calling buy years too long and sell window years too short!
I found this thought provoking and i would like to read more related articles. I found the charts, if even somewhat accurate stimulating. I would like all of our clients to read this.
It is true that all things work in cycles. Anyone savy enough to learn how the cycles operate will profit from the knowledge.
But, remember, if your ONLY goal is money for your OWN use, with no thought of helping anyone else or persons in need, all the savy in the world won’t do you much good, as eventually, you will lose whatever you selfishly gained, either financially or in other ways (health, peace of mind, etc.). LAW OF THE UNIVERSE 101.
Study the lives of the most financially prominent persons, and you will discover that so many of them are involved in some type of philanthropy, such as in the widely publicized Bill and Melinda Gates Foundation. They realize that if their goal is ONLY to get, then they will eventually end up losing.
You have to GIVE before you deserve to GET. And, even after you GET, be sure you SHARE with those needier than yourself in some way. The way of self and only self is NEVER a benefit to you or to society.
Truly reflective persons know that.
Hey! Fred & Carrie, can I get some credit here, pennies? I have been doing this since since 1977 when my dad forced me into real estate sales while I was an Engineering student (Civil & Mechanical). The buy/sell analysis for real estate was learned & perfected while I was at the Hawaii Dept. of Real Estate analyzing “condo & HOA” documents & seeing the “bonkers” condos going up. I was the “book worm” Business student working for free (college credits) auditing, editing & inspecting condo projects in Honolulu & Waikiki while being a business student @ the University of Hawaii. The HOT market was the time to sell and the dead time was the time to buy. That was the easy part of real estate. When there is blood on the streets, that’s the time to buy. While in CCIM classes, I met a CCIM teacher that “knew my dad”. Wow, what a small world. Anyway, this writing was great! Made me feel good about all that calculus I took (4 semesters).
Excellent! Read every word. Tech. analysis however when dealing with Real Estate, leaves out perhaps the most important factor in the equation. Emotional Perception. Which is never based upon Factual information. 2004-2006 is the ultimate example.