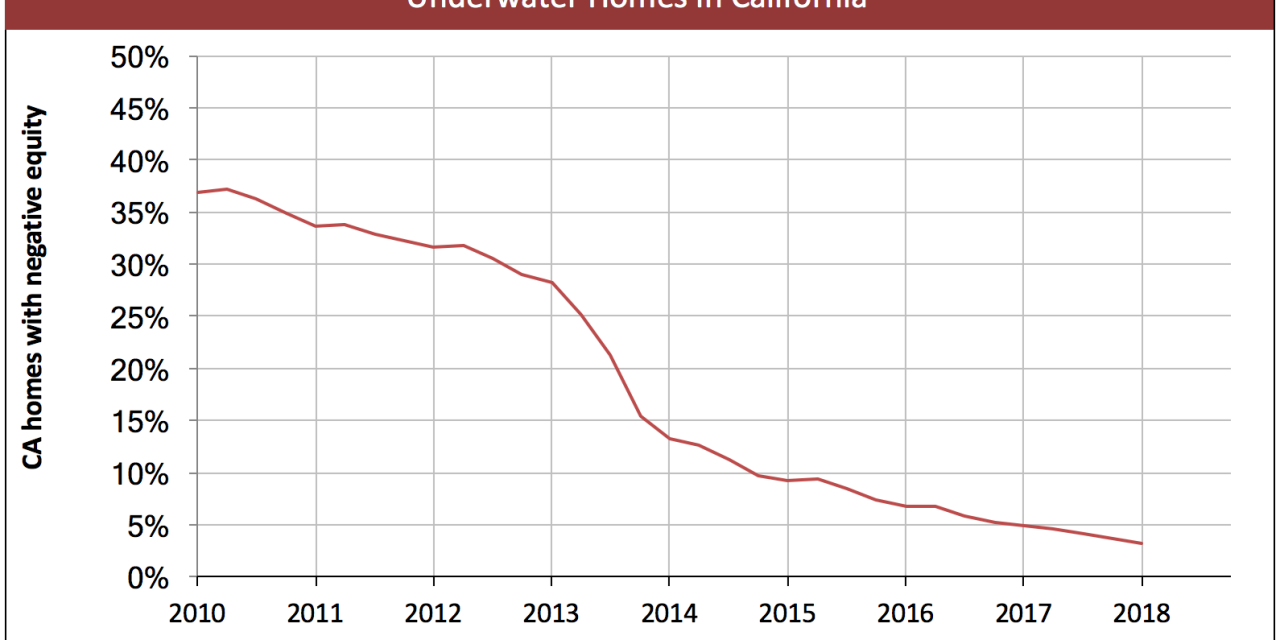
The share of mortgaged homes with negative equity in California fell to 1.5% in Q3 2020, down from 2.1% a year earlier. Going into 2021, California has the fewest underwater properties since the Millennium Boom. However, 2020’s rapid home value increase coincided directly with the drop in interest rates, set in place by the Federal Reserve (the Fed) to boost borrowing during the 2020 recession. Now that interest rates have bottomed and jobs remain far, far away from recovery, support for home values is waning quickly.
While the foreclosure moratorium continues to keep jobless homeowners housed, the 90+ day delinquency rate is growing, at 4.8% in Q3 2020. Once the foreclosure moratorium expires, the number of foreclosures will rise sharply, dragging down home values. Real estate professionals can prepare for now distressed sales by researching rules and practices for assisting clients with foreclosures, short sales and real estate owned (REO) properties.
Updated February 4, 2021. Original copy published November 2012.
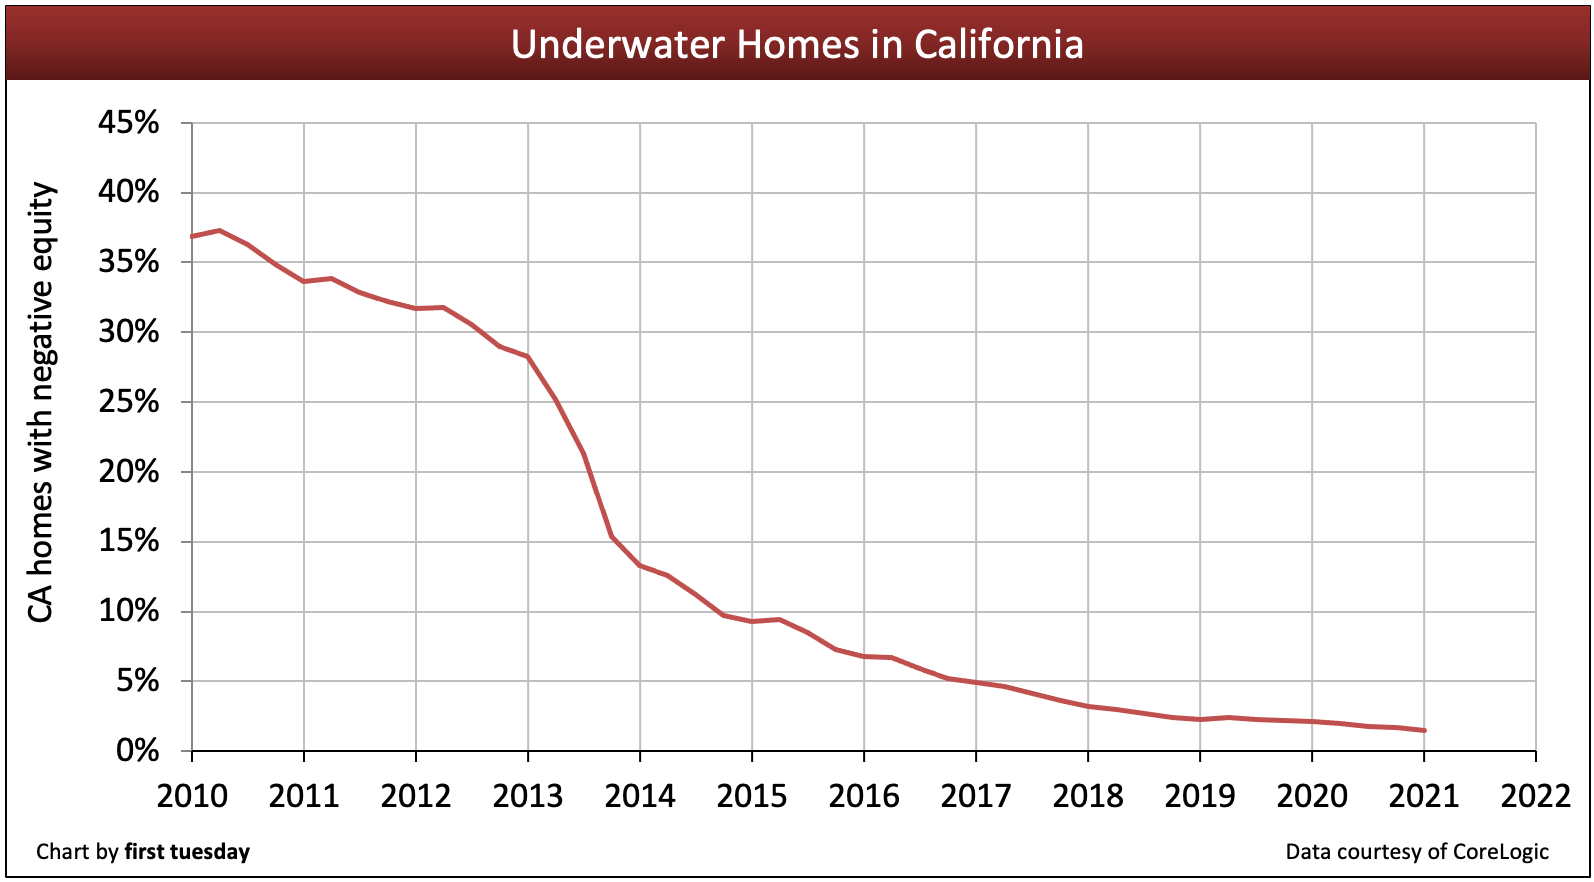
Chart update 02/04/21
| Q3 2020 | Q3 2019 | Q3 2018 | |
| Share of homes with negative equity | 1.5% | 2.1% | 2.3% |
Underwater homeowners are not alone
As of Q2 2020, just 1.5% of California’s mortgaged homeowners owed more on their mortgages than the value of their homes. While few in number, these California homeowners are underwater.
The negative equity share varies by state and particularly by neighborhood. While California’s share of negative equity homes stands at 1.5% in Q3 2020, the Los Angeles-Long Beach-Glendale metropolitan area declined to an 1.1% share of negative equity, while San Francisco-Redwood City-South San Francisco metropolitan area remained level at 0.7%.
Up until the end of 2012, any decrease in underwater homes was mainly due to short sales and foreclosure sales. However, the price jump experienced in 2013, particularly in low-tier homes, is credited with pulling many homes into positive equity, accelerating the disappearance of underwater homeowners. This price increase has leveled out, as it was due primarily to speculator activity, which has substantially slowed down.
As of Q3 2020, the average California homeowner gained a significant $34,000 in equity over the previous 12 months, an increase from a year earlier when the average home gained just $8,000 in equity over the course of a year. As price growth has leveled off going into 2021, expect the number of underwater homes to remain level in the first half of the year before rising once again. These numbers will grow when the foreclosure moratorium expires, currently scheduled to occur in March 2021, though it has been extended several times over the past year. With continually rising 90+ day mortgage delinquencies, the coming wave of distressed sales is certain, and when it arrives, home values will fall and negative equity will rise.
The rate of delinquencies, notices of default (NODs) and rising home prices are indicators of when underwater homes will disappear.
NODs, delinquencies at normal levels
An NOD is filed when a homeowner is three or more months delinquent on their mortgage payment.
California’s inventory of homes in foreclosure comprised just 0.5% of all mortgaged homes in the state in July 2015. However, as prices continue to falter in 2020, expect foreclosures and the resulting distressed sales to creep back up. By then, increased mortgage interest rates will have reduced purchasing power for long enough to push down home prices, increasing negative equity and thus driving a modest increase in foreclosures.
Related article:
California distressed sales, foreclosure inventory fall sharply
These economic tenants will be unable to fully contribute to the state’s economy. An excessive portion of their income will go toward paying above-market interest rates on their mortgages. Significantly underwater homeowners make monthly mortgage payments greater than the rental value of the property.
That money is sucked into their black-hole asset, and removed from the economy. Instead of going towards goods and services, the money just makes Wall Street bond market investors richer.
Prices remain tenuous
Home price increases kept pace with inflation in 2019, an increase is markedly smaller than experienced anytime since 2012. Then, historically-low interest rates added rocket fuel to buyer purchasing power in 2020, causing home prices to rise despite the 2020 recession.
However, once government support ends to keep jobless homeowners housed, the overall trend for home prices will be down, the result of historic job losses and rising 90+ day mortgage delinquencies, which will lead to a wave of distressed sales beginning to arrive in the second half of 2021. Home prices are expected to fall and bottom around 2023. At that time, watch for interference from real estate speculators, who tend to distort home prices with momentum purchasing.
Related article:
When will my home (and I) be solvent for good?
Underwater homeowners hoping for prices or amortization will make them solvent will eventually reach their goal. Of course, this will take roughly 10 to 15 years of paying into an underwater mortgage. Underwater homeowners who purchased at the height of the Boom, have now seen their principal balance and home price crossed over for good. Then, for the first time, their mortgage payments are actually create positive equity. After 10 to 15 years, they’ll finally know the magic of amortization.
The wildcard in this timeline is asset inflation. Home pricing undulates around the historical mean price, at times above and at times below. During a mini-boom bounce, home prices may briefly carry some homeowners out of negative equity. 2024-2025 appears to be set as the next mini-boom on the horizon.
Related article:


I’m looking for statistics regarding the distribution of equity all the way up the value levels, starting from those with, say 0-$10,000 in equity, “to infinity and beyond.” ;-) I’m focused on California, but it would be helpful to get the information for any or all states. Any idea where I could get such statistics? HUD doesn’t seem to have them, or doesn’t make them easy to find. That’s natural enough since HUD is focused on low-income people.
Dear Researchguy,
The data in our Underwater Homes chart is courtesy of CoreLogic. CoreLogic’s negative equity report will have the information you need. You may download it for free and search negative equity by severity and by state at this link: CoreLogic Negative Equity Report.
Thank you,
first tuesday Editorial Staff
How is it that people commented in 2012 on an article that wasn’t published until 2015?
Calculating the number of underwater homes is very difficult. First, loan balances can be higher, the same, or lower than indicated by the D/T. Second, values, especially AVMs, are very difficult to estimate, even in the case of individual appraisals. Third, we often have no information about interest rate; e.g., an ARM with a current rate of 2.5% but an LTV of 110% may be less at risk of foreclosure than a 95% 30 year fixed at 5%, even though the former is underwater.
Loan modifications have also complicate assessment of the danger for homes that may be technically underwater. E.g., a client received a mod with an 18% principal reduction and a rate on the balance of 2% fixed for 35 years. Another client received a principal forbearance of $400,000 that bears no interest for 40 years. Those statistics would not show up in any public data.
I am not aware of any way the above underwater analysis could account for any of the foregoing factors. Some of the factors would increase the portion, some would decrease. But the real problem is whether there is payment distress, and underwater analysis sheds no light on that.
Notice: Exports of USA go nuts and IMPORTS STAY SABLE so the CHEAP DOLLAR INCREASES SALES & PROVIDED USA WITH A SMALL TRADE IMBALANCE! I said this 5 days ago…
THE RED DOTTED LINE IS WRONG. THIS LINE IS BASED ON THE SAME “appreciation rate” from 2009 to 2012…. Wrong… If the appreciation rate is the SAME, that line is good. But the APPRECIATION RATE IN CALIF. IS EXPECTED TO BE ABOUT 8-15% PER YEAR FROM 2012 TO 2016. That’s more than double (some times 3-4x) the rate from 2009 to 2012. The “appreciation” of these Underwater homes will make the declining line dive very quickly. My “shoot from the hip” based on the numbers, will make the line more of a NOSE dive like 5 O Clock vs. 330 on your graph (100 degrees on graph vs. 160 degrees)….. Does this make sense to you based on 8-15%/year appreciation? Input the $40billion per month on QE3 and the low Rates practically guaranteed to 2015 by the FED & the appreciation rates will be “supported” by the cash inflows. This will devalue the Dollar and increase our exports too.
This is GOOD NEWS FOR EVERYONE EXCEPT THE PERSON THAT HAS 100% CASH EQUIVALENT ON THEIR BALANCE SHEET.