
Why this matters: When adequate new construction starts are limited by either zoning or prohibitively high construction costs — as are affecting builders in 2025 — property prices rise excessively. Real estate agents and brokers looking to guide their practice by a review of available data need to understand the connection local for-sale inventory, jobs and construction starts have on determining property prices which permit a stable rate of turnover in the community.
Slow to start, priced to sell now
Single family residential (SFR) construction starts during the six-month phase ending August 2025 were 13.3% down from the same phase one year earlier. During the same six-month phase, multi–family construction starts were up 16.7% from a year earlier.
For the year 2024, multi-family construction experienced a 26% decrease from the prior year, with 39,156 new units started. Demand for multi-family rentals has generally been higher during this past decade compared to new SFRs. But new multi-family construction to meet demand continues to hit roadblocks in the form of labor and supply shortages, lack of entrepreneurial local general contractors and uncertainties about tariffs on the price of materials — on top of politically vocal not-in-my-backyard (NIMBY) advocates.
In contrast, SFR construction starts in 2024 were up 8% from the previous year, for a total of 61,229 new SFRs started. This upward movement follows a construction bounce in 2021, the surge then being the result of homebuyer fear of missing out (FOMO), low home-resale inventory, and demand for remote locations where zoning is not used to interfere with construction starts as occurs in wealthier coastal urban centers.
And yet, compared to the 150,000 SFR starts achieved in 2005 at the height of the millennial boom, the 61,229 SFR starts achieved in 2024 were just a fraction of the starts needed to meet demand.
State-initiated legislative efforts to add to the low- and mid-tier housing stock have focused on encouraging more multi-family construction in recent years. As a result, metro areas with the highest annual increases in construction include Sacramento, Riverside and San Diego. The most anemic growth occurs where zoning remains restrictive for housing, including San Francisco, San Jose and Los Angeles.
While builders, primarily local general contractors, were beginning to cash in on legislative incentives and rising homebuyer demand, leaping mortgage rates and spiraling sales volume and prices crushed builder sentiment in 2022, causing starts to plummet.
Since the 2022 peak in pricing, housing across all price tiers in California’s major metro areas struggled to keep up with consumer inflation. As the trend setter, the most expensive housing felt the effects of the real estate recession first. As of June 2025, the middle- and high-tier priced housing across San Francisco, Los Angeles and San Diego are flat, having risen less than a full percentage point since May 2022.
The downward trend is more pronounced comparing June 2025 with the same time a year earlier, observing a 1% drop in price across all tiers in the same metro areas. This pressure on pricing drives more competition between sellers of a used home with builders offering newly constructed housing at a lower cost.
A new study published in July 2025 showed existing California homes were priced significantly higher than new ones. One of the few states with this reversal, Californians looking to buy new homes face the largest difference in price compared to any other state in the country. California homebuyers purchasing an existing home are facing 24.7% higher prices than buyers of new homes.
With prices overall dropping in the state, builders are motivated to grab the attention of buyers before recessionary prices push potential homeowners to wait for all home prices to bottom. Sellers of existing housing on the other hand may pull their property from the market rather than drop asking prices to compete with already less expensive brand-new homes.
Thus, residential construction starts will not reach their full potential until after the coming economy-wide recession. Prices will likely bottom around 2028 as the real estate recovery begins to work its way out of its recession.
Updated September 26, 2025.
Chart 1
This chart illustrates the number of California residential construction starts during semi-annual phases ending in February and August.
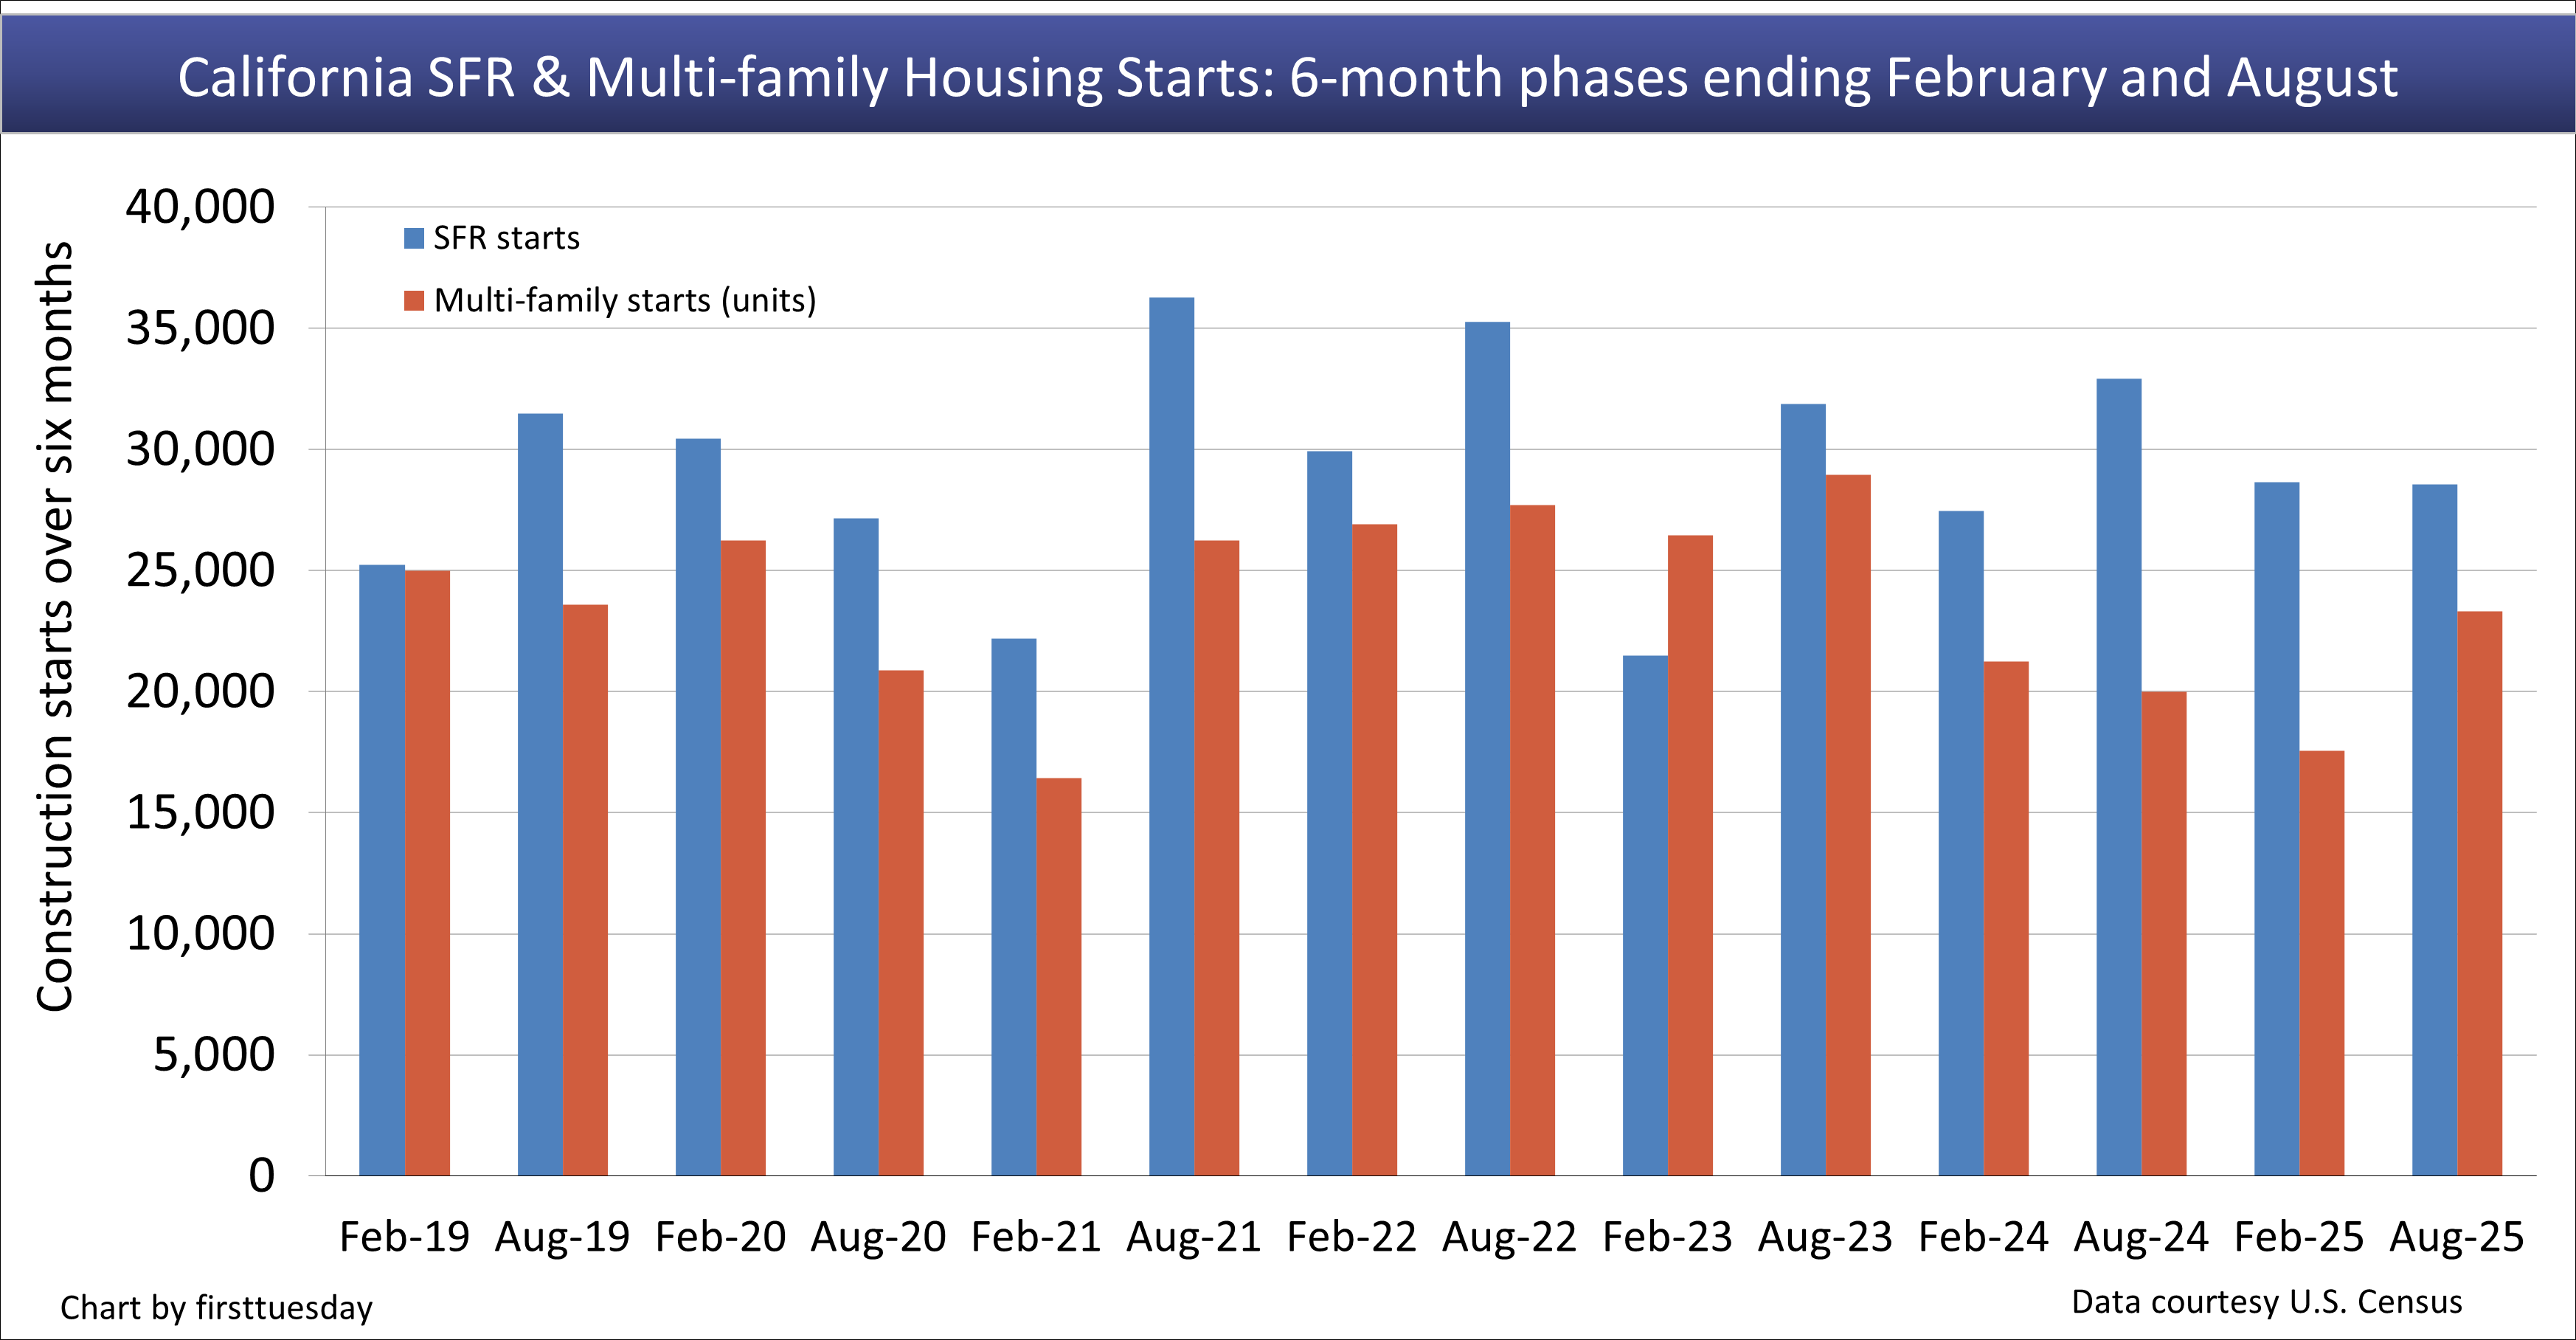
Chart update 9/24/25
| Six-month period ending | Aug 2025 | Aug 2024 | Annual change |
| SFR Starts | 28,633 | 32,926 | -13.3% |
| Multi-family Starts | 23,325 | 19,982 | +16.7% |
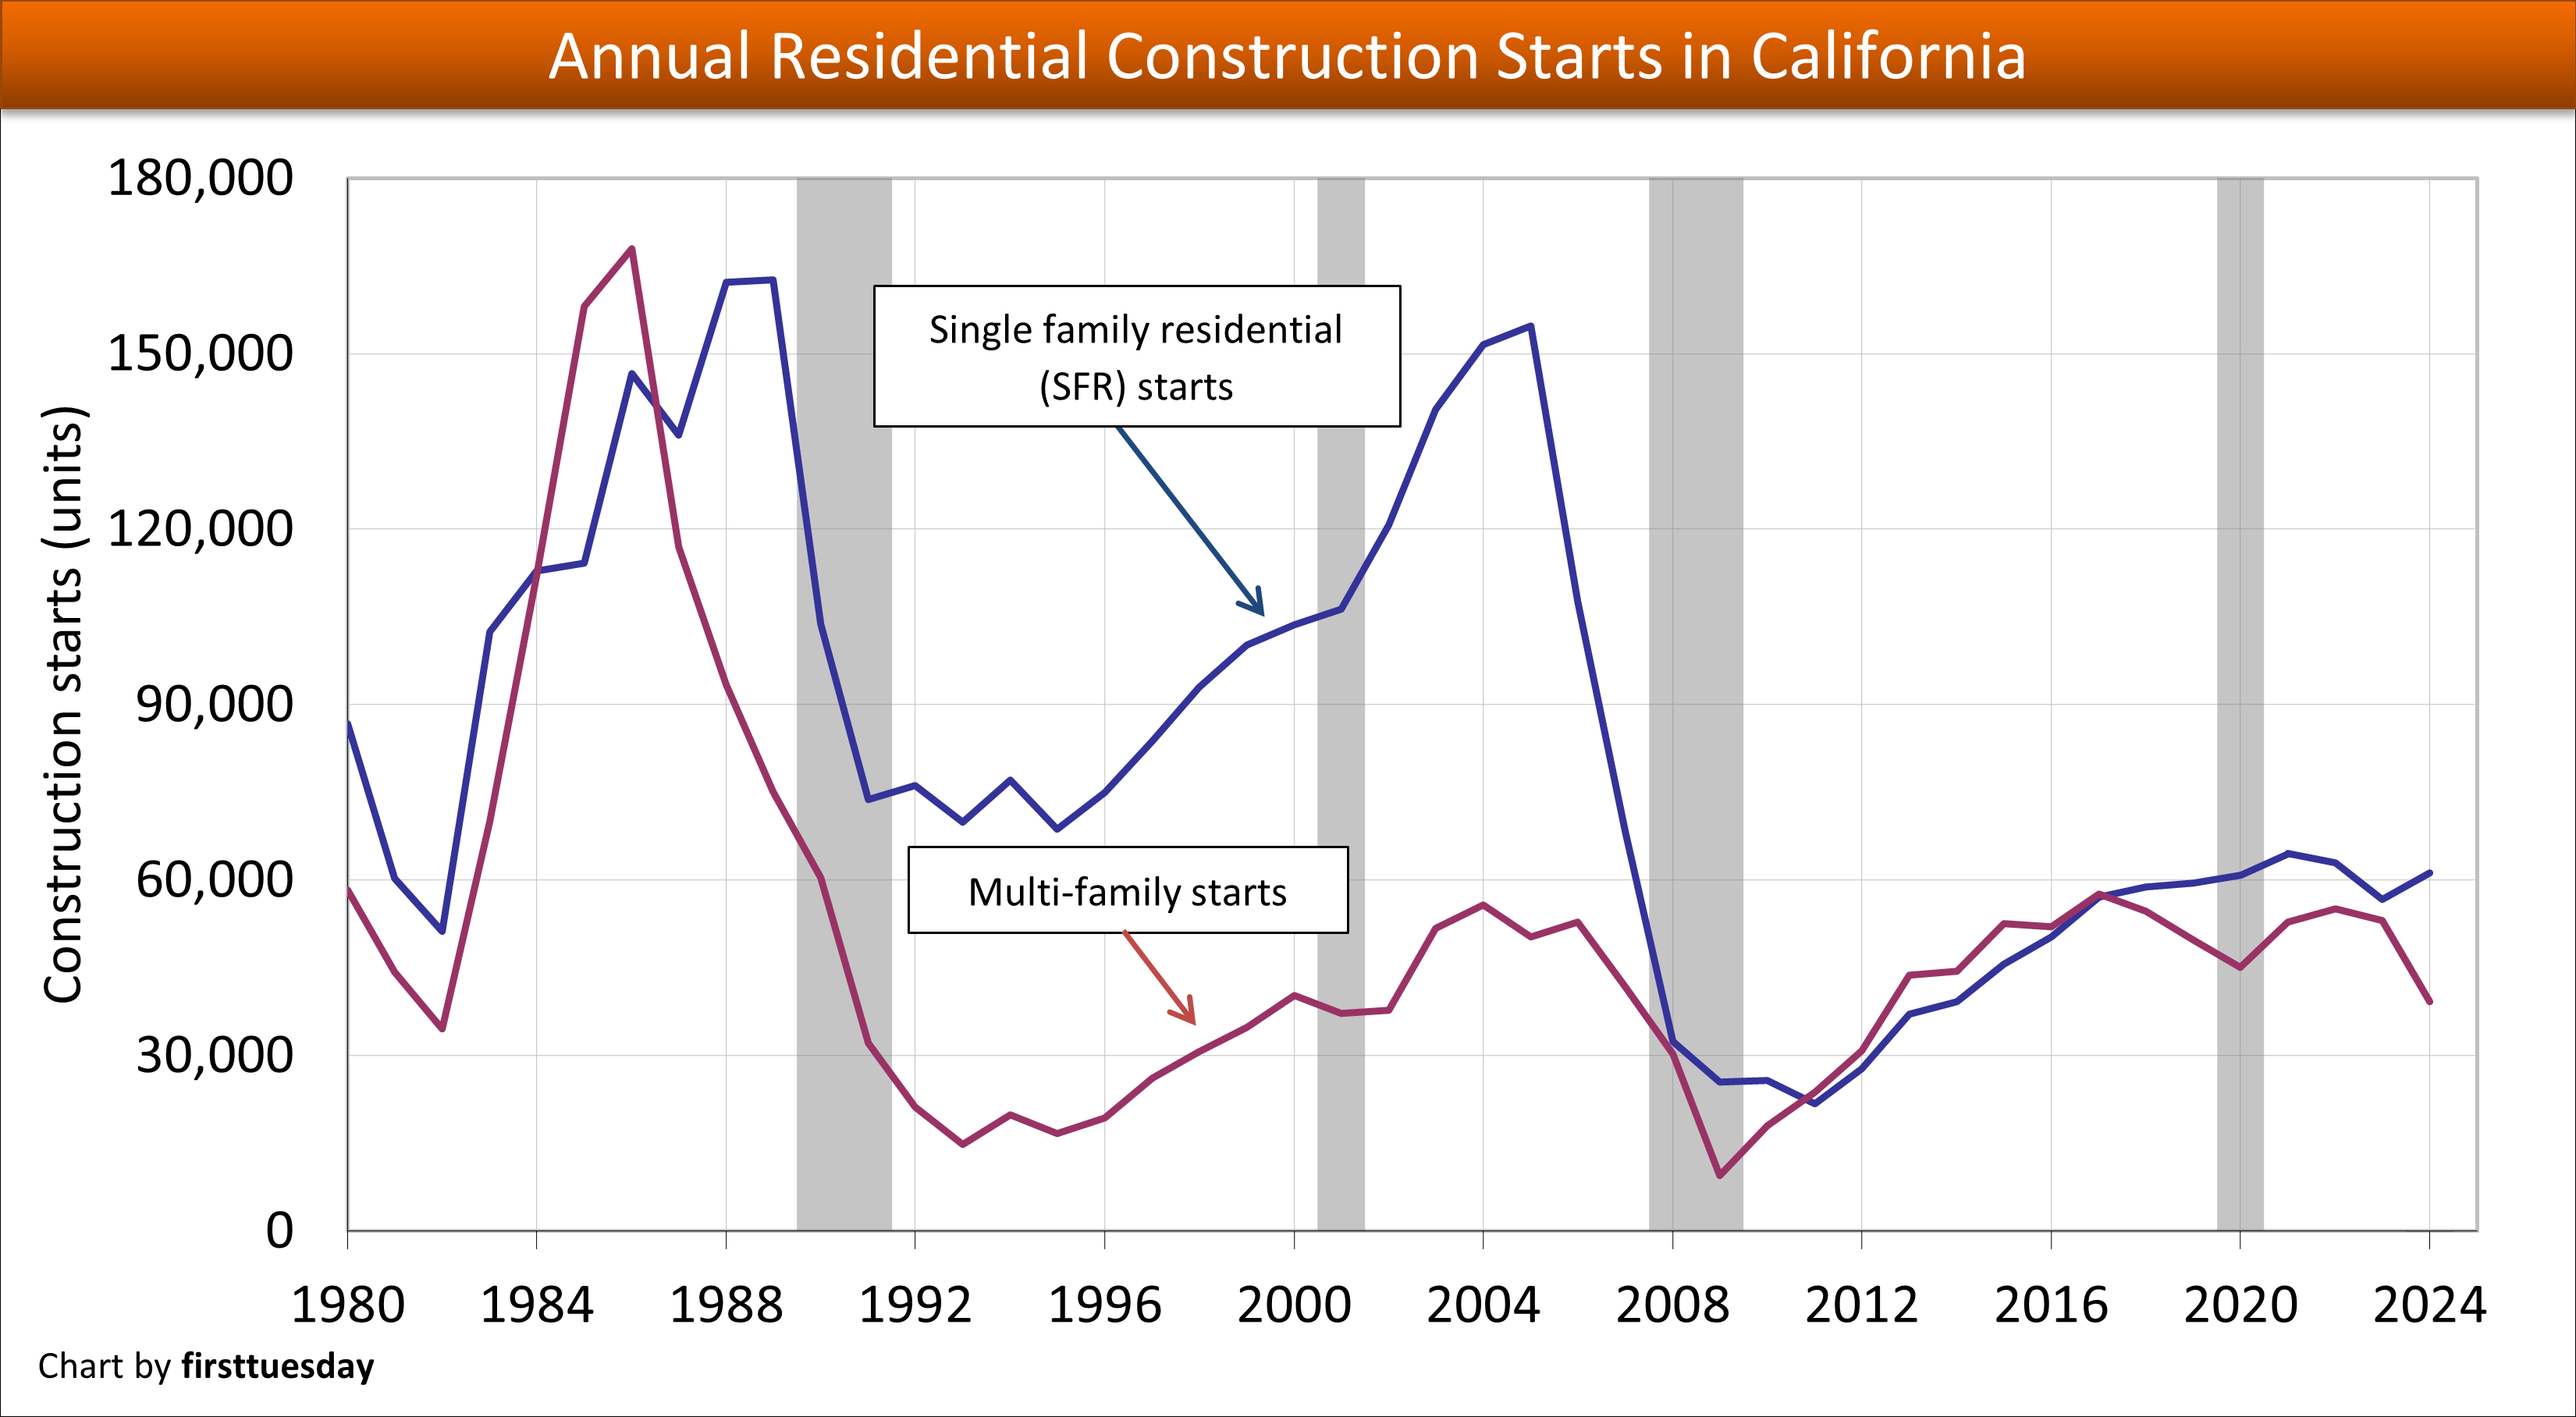
Chart update 03/25/25
| 2024 | 2023 | 2022 | 2005 peak | |
| SFR Starts | 61,229 | 56,655 | 62,937 | 154,700 |
| Multi-family Starts | 39,156 | 53,052 | 55,153 | 50,300 |
*Forecasts are made by firsttuesday and are based on current new home sale trends, actual construction starts and current government policies.
Detached single family residential construction trends in California:
- 28,552 SFR starts took place in the six-month period ending August 2025. This is 4,374 fewer starts than occurred during the same period one year earlier, a 13.3% decrease.
- In 2024, SFR starts totaled 61,229. This is up 8%, or 4,574 starts, from 2023.
- For perspective, this cycle’s peak year in SFR starts was 2005 with 155,000 starts. The lowest year was 2011 with 22,000 starts, the year before the recovery set in after the Great Recession of 2008.
Detached SFR forecast:
- firsttuesday‘s projection for SFR starts in 2025 is a decrease from the prior year, as is currently the case with 2025 down 6.6% compared to 2024 as of August. The forecast for 2025 is most affected by the downward pressure brought on by higher interest rates which slashed buyer purchasing power, and uncertainties which increases caution among consumers due to trade embargos and taxed imports. Expect SFR starts to remain below their potential in the next two plus years, until a recovery from the next recession picks up steam, likely after 2028.
- Subdivision final reports will remain low until local developers determine a return of older first-time homebuyers is on the horizon.
- The next peak in SFR starts will likely occur during the boomlet period in the years following 2028.
Multi-family housing construction trends:
- 23,325 multi-family housing starts took place in the six-month period ending August 2025. This is 3,343 more starts than occurred during the same period one year earlier, a 16.7% increase.
- 39,156 multi-family housing starts took place in 2024. This was 26% lower than 2023, and below 2018 when multi-family starts hit their most recent peak.
- For perspective, this past cycle’s peak year in multi-family housing starts was 2004 with 61,500 starts. The lowest year was 2009 with just 9,500 multi-family housing starts.
Multi-family housing forecast:
- firsttuesday forecasts multi-family housing starts to be down in 2025 from the past year. As the economy stumbles, builders of residential improvements are hampered by increased inflation from induced shortages in construction materials, workers panicked over volatile deportation conditions, mortgage lenders keeping a tight fist on funds, and taxes remaining elevated on imports. These dynamics worsen as long-term interest rates continue to rise over the coming decade, impeding buyer purchasing power.
- Multi-family housing starts were expected to rise at a gradual pace beginning in 2020, as several legislative changes aimed at increasing multi-family construction encouraged more building of dense, low- and mid-tier housing. However, pandemic disruptions and tightening lines of credit pushed multi-family construction numbers down significantly in 2020-2021, picking up slightly since 2022.
- For 2025, and likely 2026, we will see a much diminished residential development environment as the USA moves into its first world-wide trade war in 90 years concurrent with the population’s consolidation into larger households per unit. Opportunities for residential construction have been set aside until an industrial revolution condition is reinstalled in the USA, after moving into higher education and resulting skills following the end of the American industrial revolution around 1900.
- The next peak for multi-family housing starts will likely appear after 2028 and beyond, but only after we have completed the coming recession and moved into recovery.
Statistics related to California housing:
- 14.88 million total housing units existed in California in 2024, 13.8 million of which are occupied and 7.7 million of which are owner-occupied, according to the U.S. Census Bureau. This continues a slight increase over prior years.
- Prior to 2020, California population growth had been increasing at a rate of 0.5%-1% per year. But California’s population has since begun to decline, the result of more deaths than births alongside more residents moving to other states in search of a lower cost of living than those moving in. As an offset, those moving in possess higher skills and wealth than those moving out of California.
- Roughly 18.3 million people were employed in California in December 2024. This is just over the number of jobs held at end of 2019, prior to the 2020 recession, according to the California Employment Development Department (EDD).
- California’s residential rental vacancy rate was 4.8% in 2024.
Related articles:
California’s low residential vacancy rates signal more construction


What is the source of this data? It is interesting, but won’t be as useful in public policy debates unless we know the precise source of these numbers. Please reply with sourcesd. Thanks. J
construction is a very good way to produce more work and improve better living developments.
Could you fix the first number in this statement you have? $ million is wrong.
Statistics related to California housing:
4 million total housing units existed in California in 2019, 13.2 million of which are occupied and 7.2 million of which are owner-occupied, according to the U.S. Census Bureau. This continues a slight increase over prior years.
James,
Thank you for alerting us to this typo. We have fixed the error and gone ahead and updated these statistics with the latest numbers.
Thanks for reading!
Great content, thanks for sharing.
This make no mathematical sense.
“4 million total housing units existed in California in 2019, 13.2 million of which are occupied and 7.2 million of which are owner-occupied, according to the U.S. Census Bureau. This continues a slight increase over prior years.”
13.2 mil + 7.2 mil = 20.2 million. You said there were 4 million total. If you made such a basic error in math, how could we expect accuracy in any part of the article?
Double check your math.
The writer appears to have meant “14” not “4” million. !3.2 million occupied units means that about 800,000 were vacant. Subtract the 7.2 owner occupied from 13.8 million occupied to get 6.6 million occupied by renters. These numbers are consistent.
It would be helpful to know if any of the multi-family construction increase is privately financed as opposed to gov’t subsidized (ie: “affordable” construction.
Lots of useful information, thank you. I noted the construction chart going back to the 1980’s. The chart shows a total collapse of multi-family development beginning about 1986. I wonder how much of this may have been caused by the Reagan tax changes? Prior to that there was a period where limited partnerships built or bought apartments and commercial properties. After the tax change many people decided it was better to invest in a larger personal residence rather than a small income property and the limited partnership industry disappeared. Any thought on how tax law and government policy other than zoning laws can affect change?
If you add factors of living in CA… it is extremely costly. Land banking will do good but… having such a high tax state with cost of living so high… plus capital gain on both Federal and State end… does it really make sense???
I used to be positive about CA… real estate… as an investment…
Your own home, ok, but mortgage plus high property tax plus all others…
What is your intake?
New construction will only come back when we stop some of the wayward government t programs. No more debt forgiveness and no more refinancing underwater properties (Harp). It’s time to let the marketplace get back to normal buyer and seller demand conditions so employment will return and demand will new homes will follow. Just hope we elected the right person this time around.
THE BLACK SWAN
It interests us how so many persons, when offering their predictions as to what turn future events and trends might take, virtually NEVER figure in a black swan event.
What is that? A black swan event is a dramatic, even cataclysmic event that comes on suddenly and unexpectedly and can have a drastic effect on any prognostication based solely on observable, historical, or cyclical trends.
The huge storm in the East–hurricane Sandy–is a type of black swan event. A huge earthquake would be one on the West Coast. Such things can turn the trend-lines upside down. Massive damage means massive reconstruction. Is it good or bad for the economies so affected?
MASSIVE SOLAR EVENT IN THE NEAR FUTURE?
And no one is figuring in the possible catastrophic solar event that astrophysicists are saying could very likely hit before the end of 2012 or during 2013. (for more info on that see: AthenaAcademy.net/home/current_news). Would such an event bring negative consequences or positive? Apparently Earth has gone through such monumental solar events in the past.
Builders are “Re-active” to demand. They are NOT Pro-Active and build for the DEMAND. Long term investors shoot for 5-10 years out like me. I bought thousands of Acres in 2009 to 2012 at the BOTTOM BOTTOM LOW! Builders are consumers of LAND.