In early 2026, low-tier priced housing has the lowest level of inventory available for sale or rent.

California’s for-sale inventory growth: buyer caution rises faster than owner need to sell
read more

Learn the 25 economic factors that drive California’s real estate market.
Stay current on the latest news, videos, forms, and updates for Real Estate Economics.

06/25: The 2025 rules for buyer representation and fee-splitting avoidance are currently being edited into this e-book.
In early 2026, low-tier priced housing has the lowest level of inventory available for sale or rent.
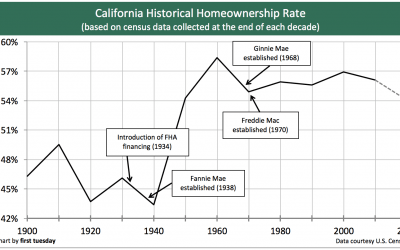
California’s homeownership rate ballooned during the Millennium Boom, but quickly fell to today’s stable level of 55%.

Want a deeper understanding of your local real estate market? These charts show the price-per-square-foot history of home sales in communities across California.

Get to know Sacramento County’s local housing fundamentals in these charts and forecasts.

Santa Clara’s housing market is experiencing the downfall from 2021’s pandemic bounce.

View these charts for current activity and forecasts for San Francisco’s housing market.

View these charts for current activity and forecasts for San Diego’s housing market.

View these Riverside regional charts for details on current activity and forecasts for its local housing market.

View these Orange County regional charts for details on current activity and forecasts for its local housing market.