

Why this matters: Real estate agents and brokers representing themselves as experts in their community are better prepared when available data drives decisions in their practice, especially during shifting currents in their local real estate market.
The median cost has the message
The median price-per-square-foot gave us a mostly stumbling performance in 2025. Outside of the outlier San Francisco which received a massive bump to the sale price of housing central to the AI boom, most counties continued their recent leveling out unaffected.
The pandemic-era fear of missing out (FOMO) and half-priced mortgage funds drove sales to a false peak in 2021. Since then, each spring buying phase was (and remains) a weaker force.
May 2026 received a slight bump from the prior month but fell flat compared to a year prior. No major county outside of San Francisco saw price per square foot raise a single percentage compared to May 2025.
Statewide, the median sale price per square foot in California landed at $472, up 0.4% from a year earlier after the state’s recent peak of $479 in February 2025. A puny amount next to consumer inflation now more than double an acceptable rate and possibly running loose.
This downward shift during the spring bounce indicates an underlying weakness in pricing based on this stalled price-per-square-footage trend.
Expect home prices to stagger, then decrease as the housing market adjusts to higher mortgage rates. Also, sellers are no longer able to maintain asking prices by simply holding out to score a buyer. In turn, increasing buyer caution due to the uncertain economic outlook for jobs and excessive cost of living increases will depress property prices and rents through 2026 and beyond.
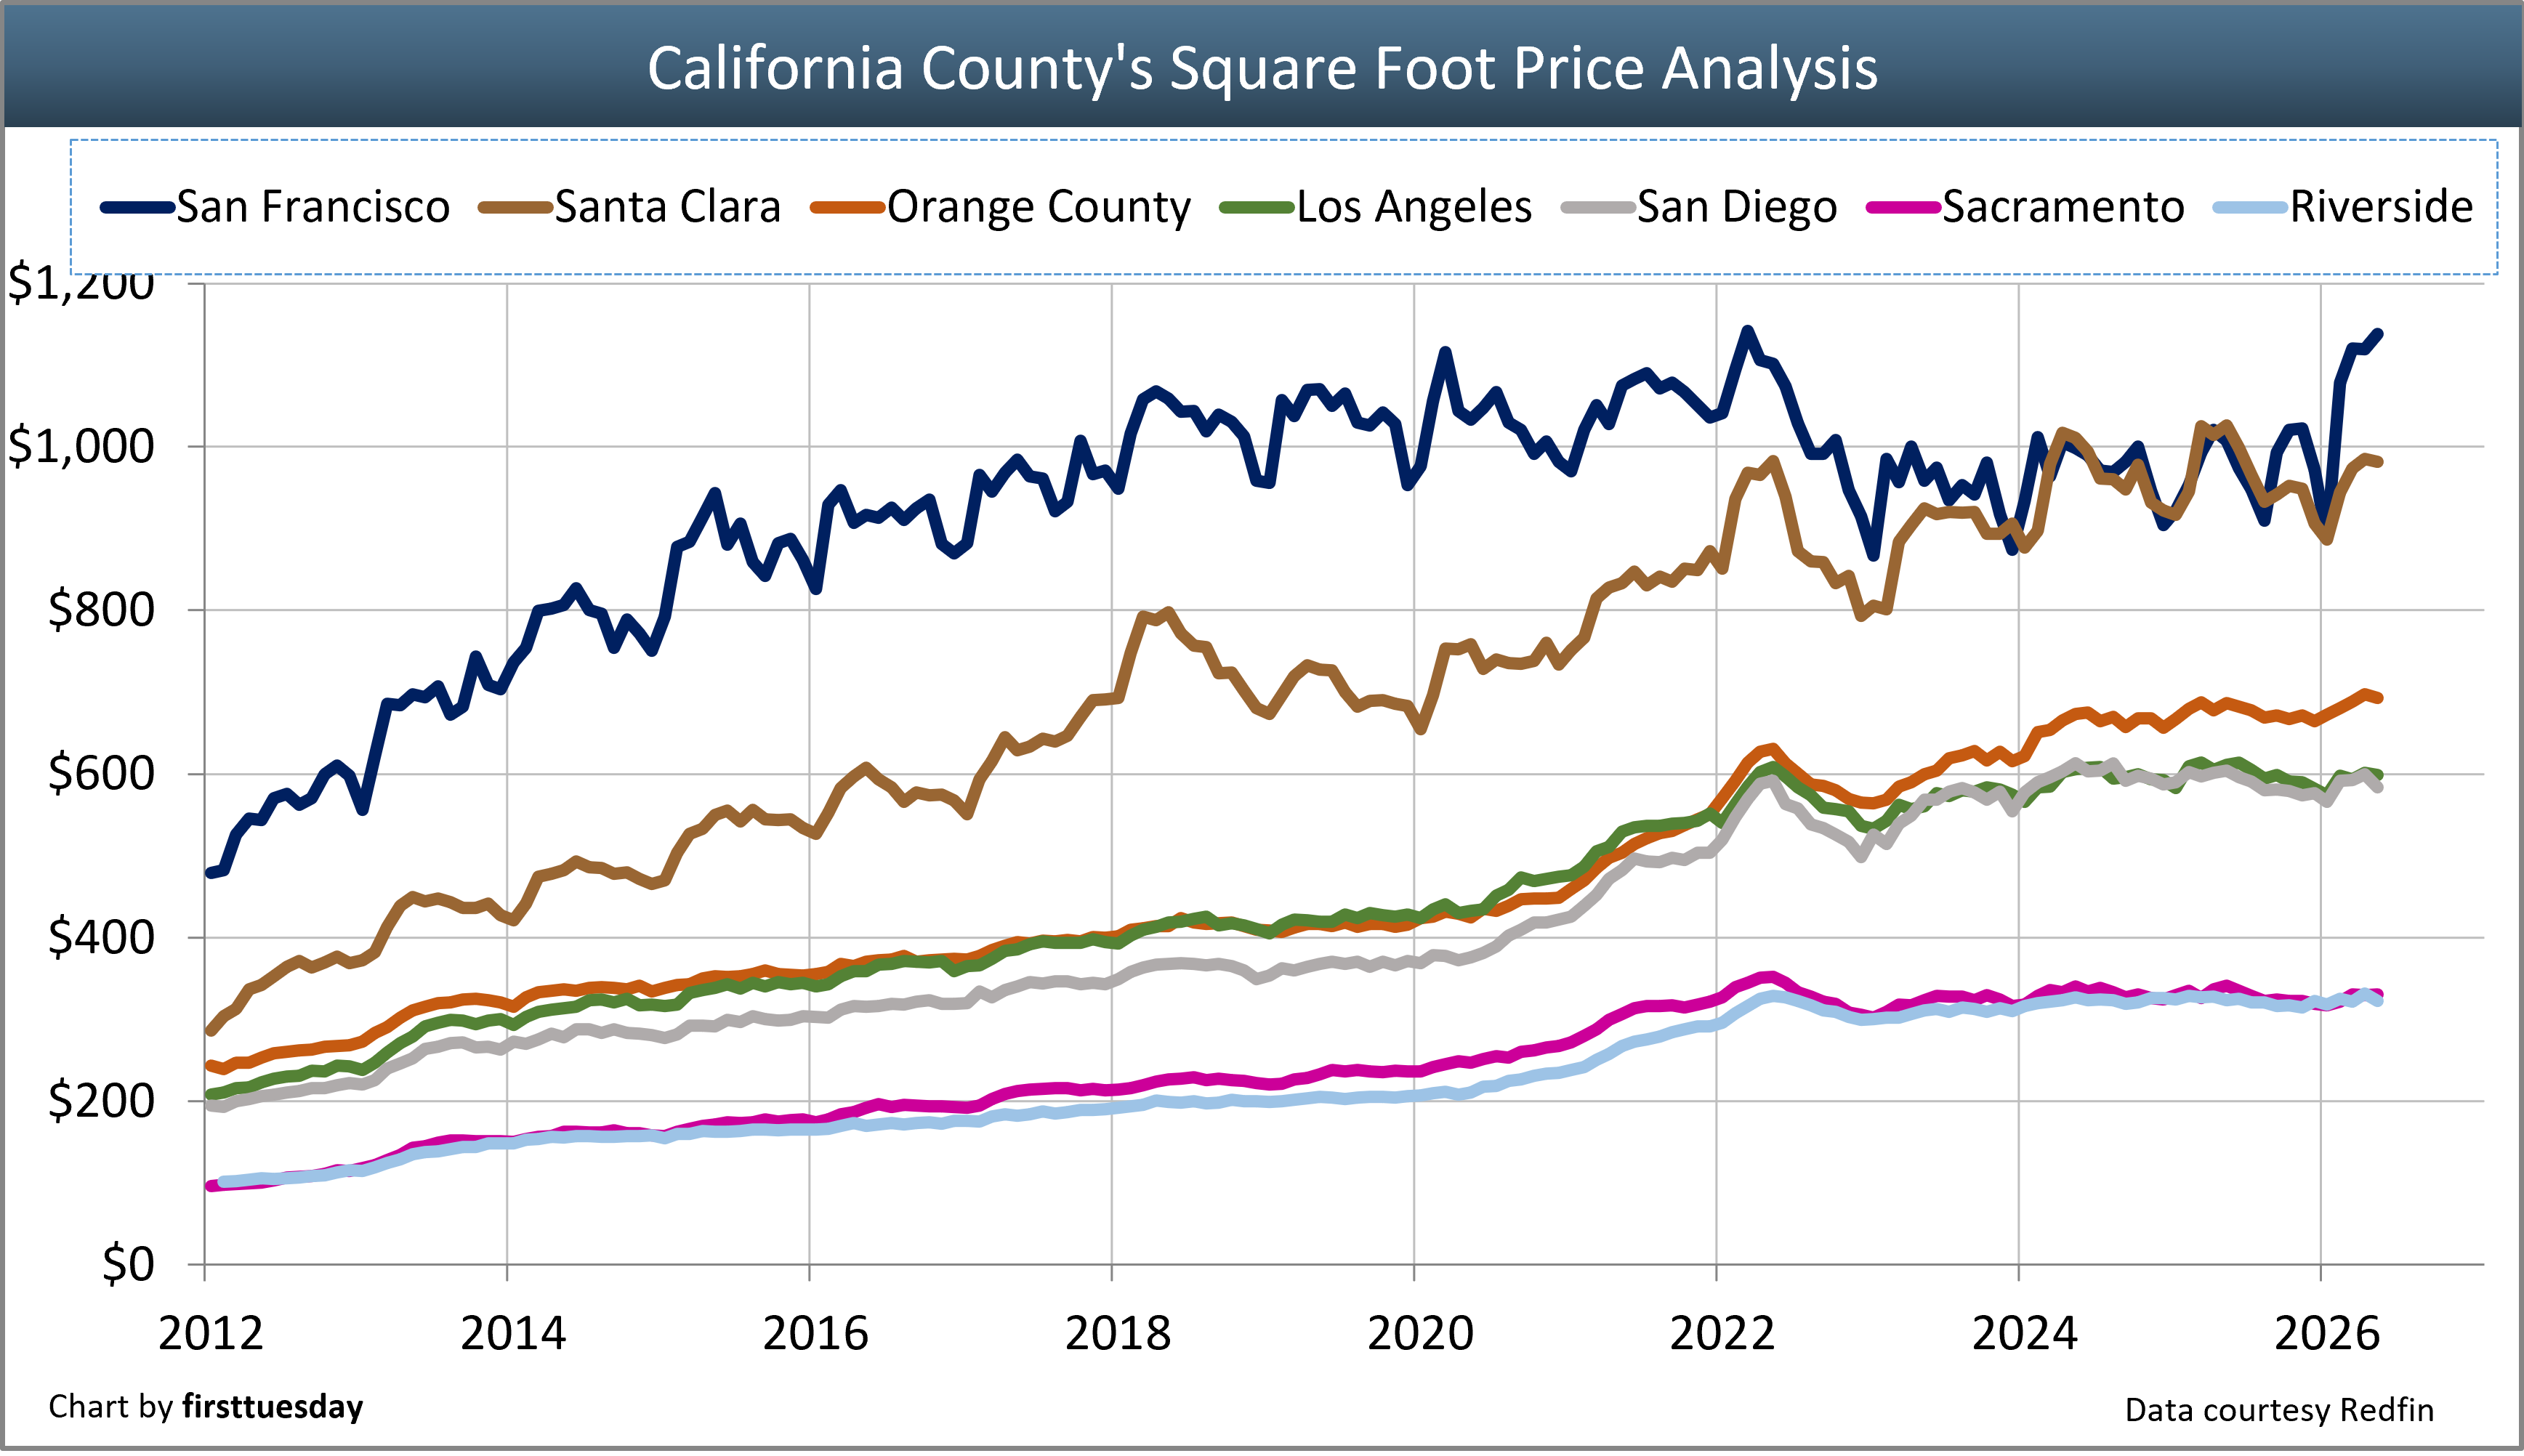
Price per square foot analysis
The median sale price per square foot in each of these areas during 2025 was:
- $978 in San Francisco, up 0.5% from 2024;
- $965 in Santa Clara up 0.8% from 2024;
- $675 in Orange County, up 2% from 2024;
- $589 in San Diego, down 1% from 2024;
- $600 in Los Angeles, up 0.9% from 2024;
- $328 in Sacramento, down 0.7% from 2024; and
- $322 in Riverside, down 0.1% from 2024.
The bottom price areas largely consist of home sales of low-tier properties (a favorite of speculators and buy-to-let investors). When low-tier property sales are predominant as in 2025, they drag down the average price per square foot as top-tier property sales volume decline — as they are now.
Related article:
Of course, using median price is a mathematical abstraction – it applies to no single property anywhere in any price range. Thus, by compressing so much information into one number, it tells you nothing about a property’s true value. It is just a number at the center of what’s happening generally.
Median prices give the inaccurate appearance of a simple collective increase or decrease for prices of all property types in all neighborhoods. In fact, high-tier home prices might be rising quickly while low-tier homes drop and mid-tier prices go nowhere.
In reality, neither the median price nor the average price represents the direction of market conditions since they compress any contradiction. In contrast, the tiered-pricing approach reflects the willingness of different levels of wealth to buy or sell property, which also sets trends not available with per square foot pricing analysis.
When analyzing a particular property, these charts offer no advice beyond demonstrating localized cost-per-sq-foot lagging conditions. Pricing a particular home’s value requires agents and their sellers and buyers to consider:
- the property’s fair market value (FMV) based on a comparison of recent sales of similar properties (CMA); and
- local end user demand, based on:
- the local job market; and
- local demographics.
Check out the price-per-square-foot history of home sales in these seven California communities.
Posted updated June 29, 2026.
Los Angeles 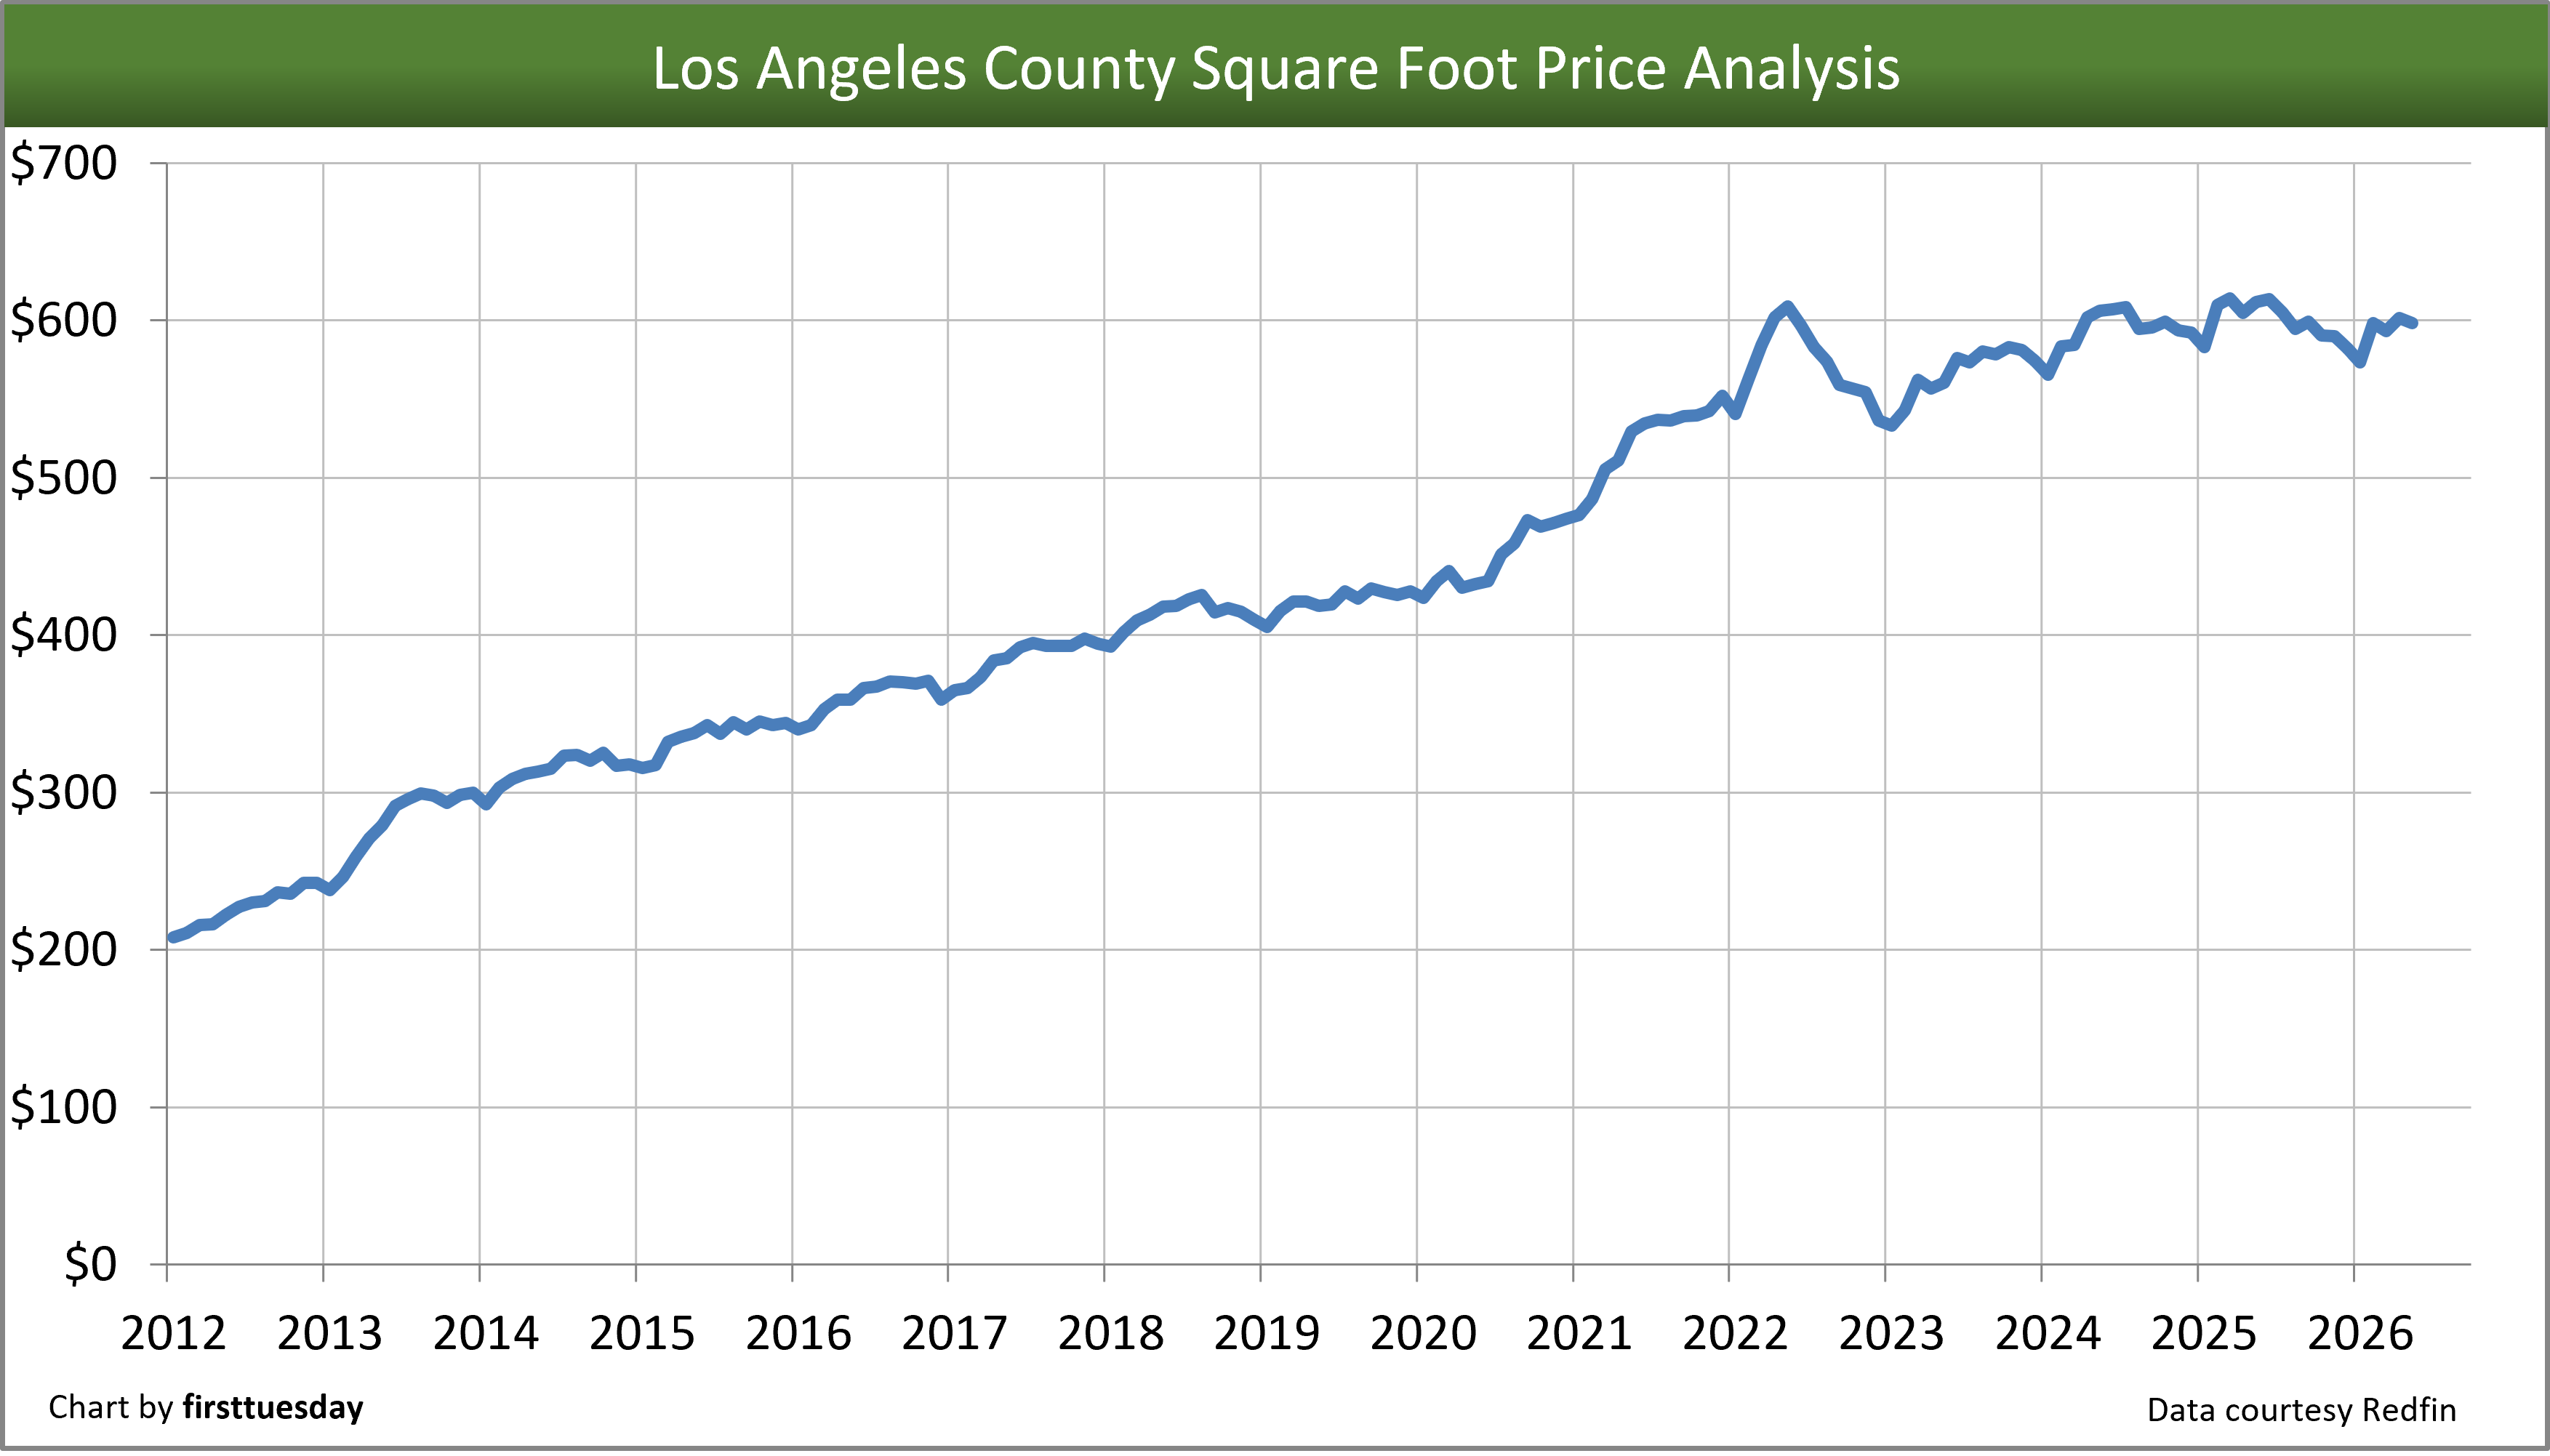 Chart update 6/24/26
| May 2026 | April 2026 | May 2025 | |
| Median Square Foot Price | $598 | $602 | $612 |
Orange County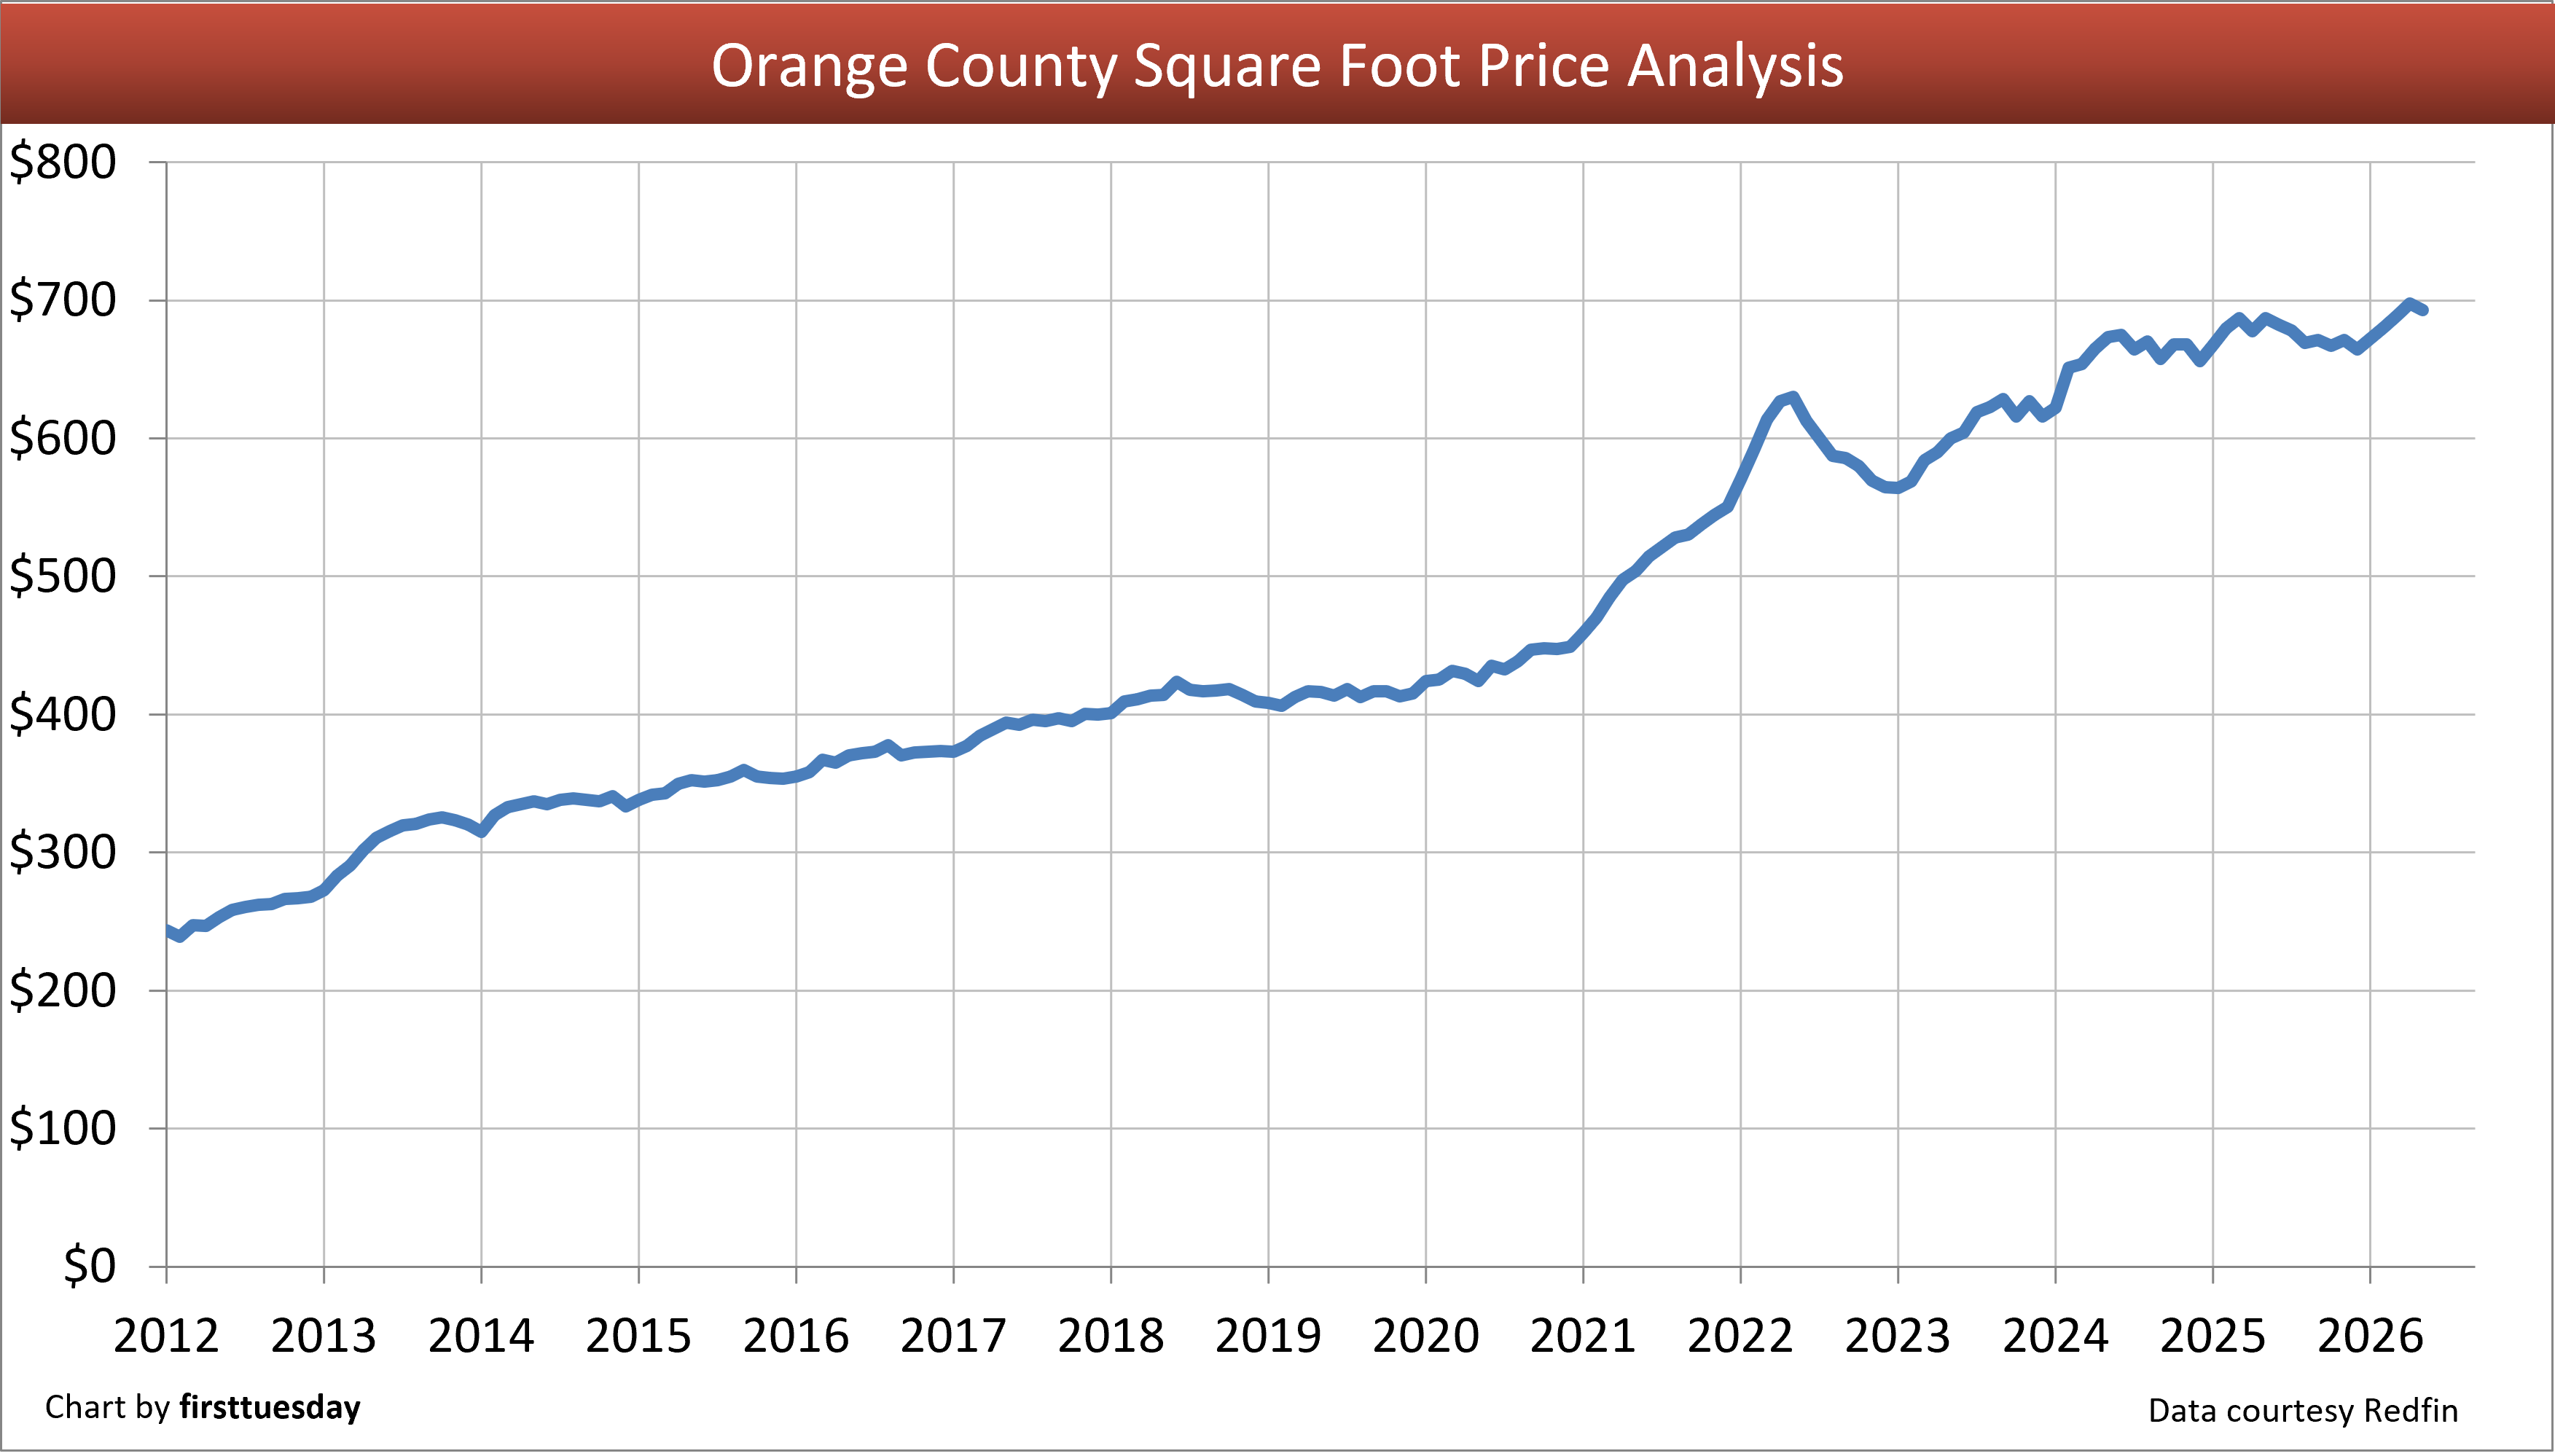 Chart update 8/25/25
| May 2026 | April 2026 | May 2025 | |
| Median Square Foot Price | $693 | $698 | $687 |
Riverside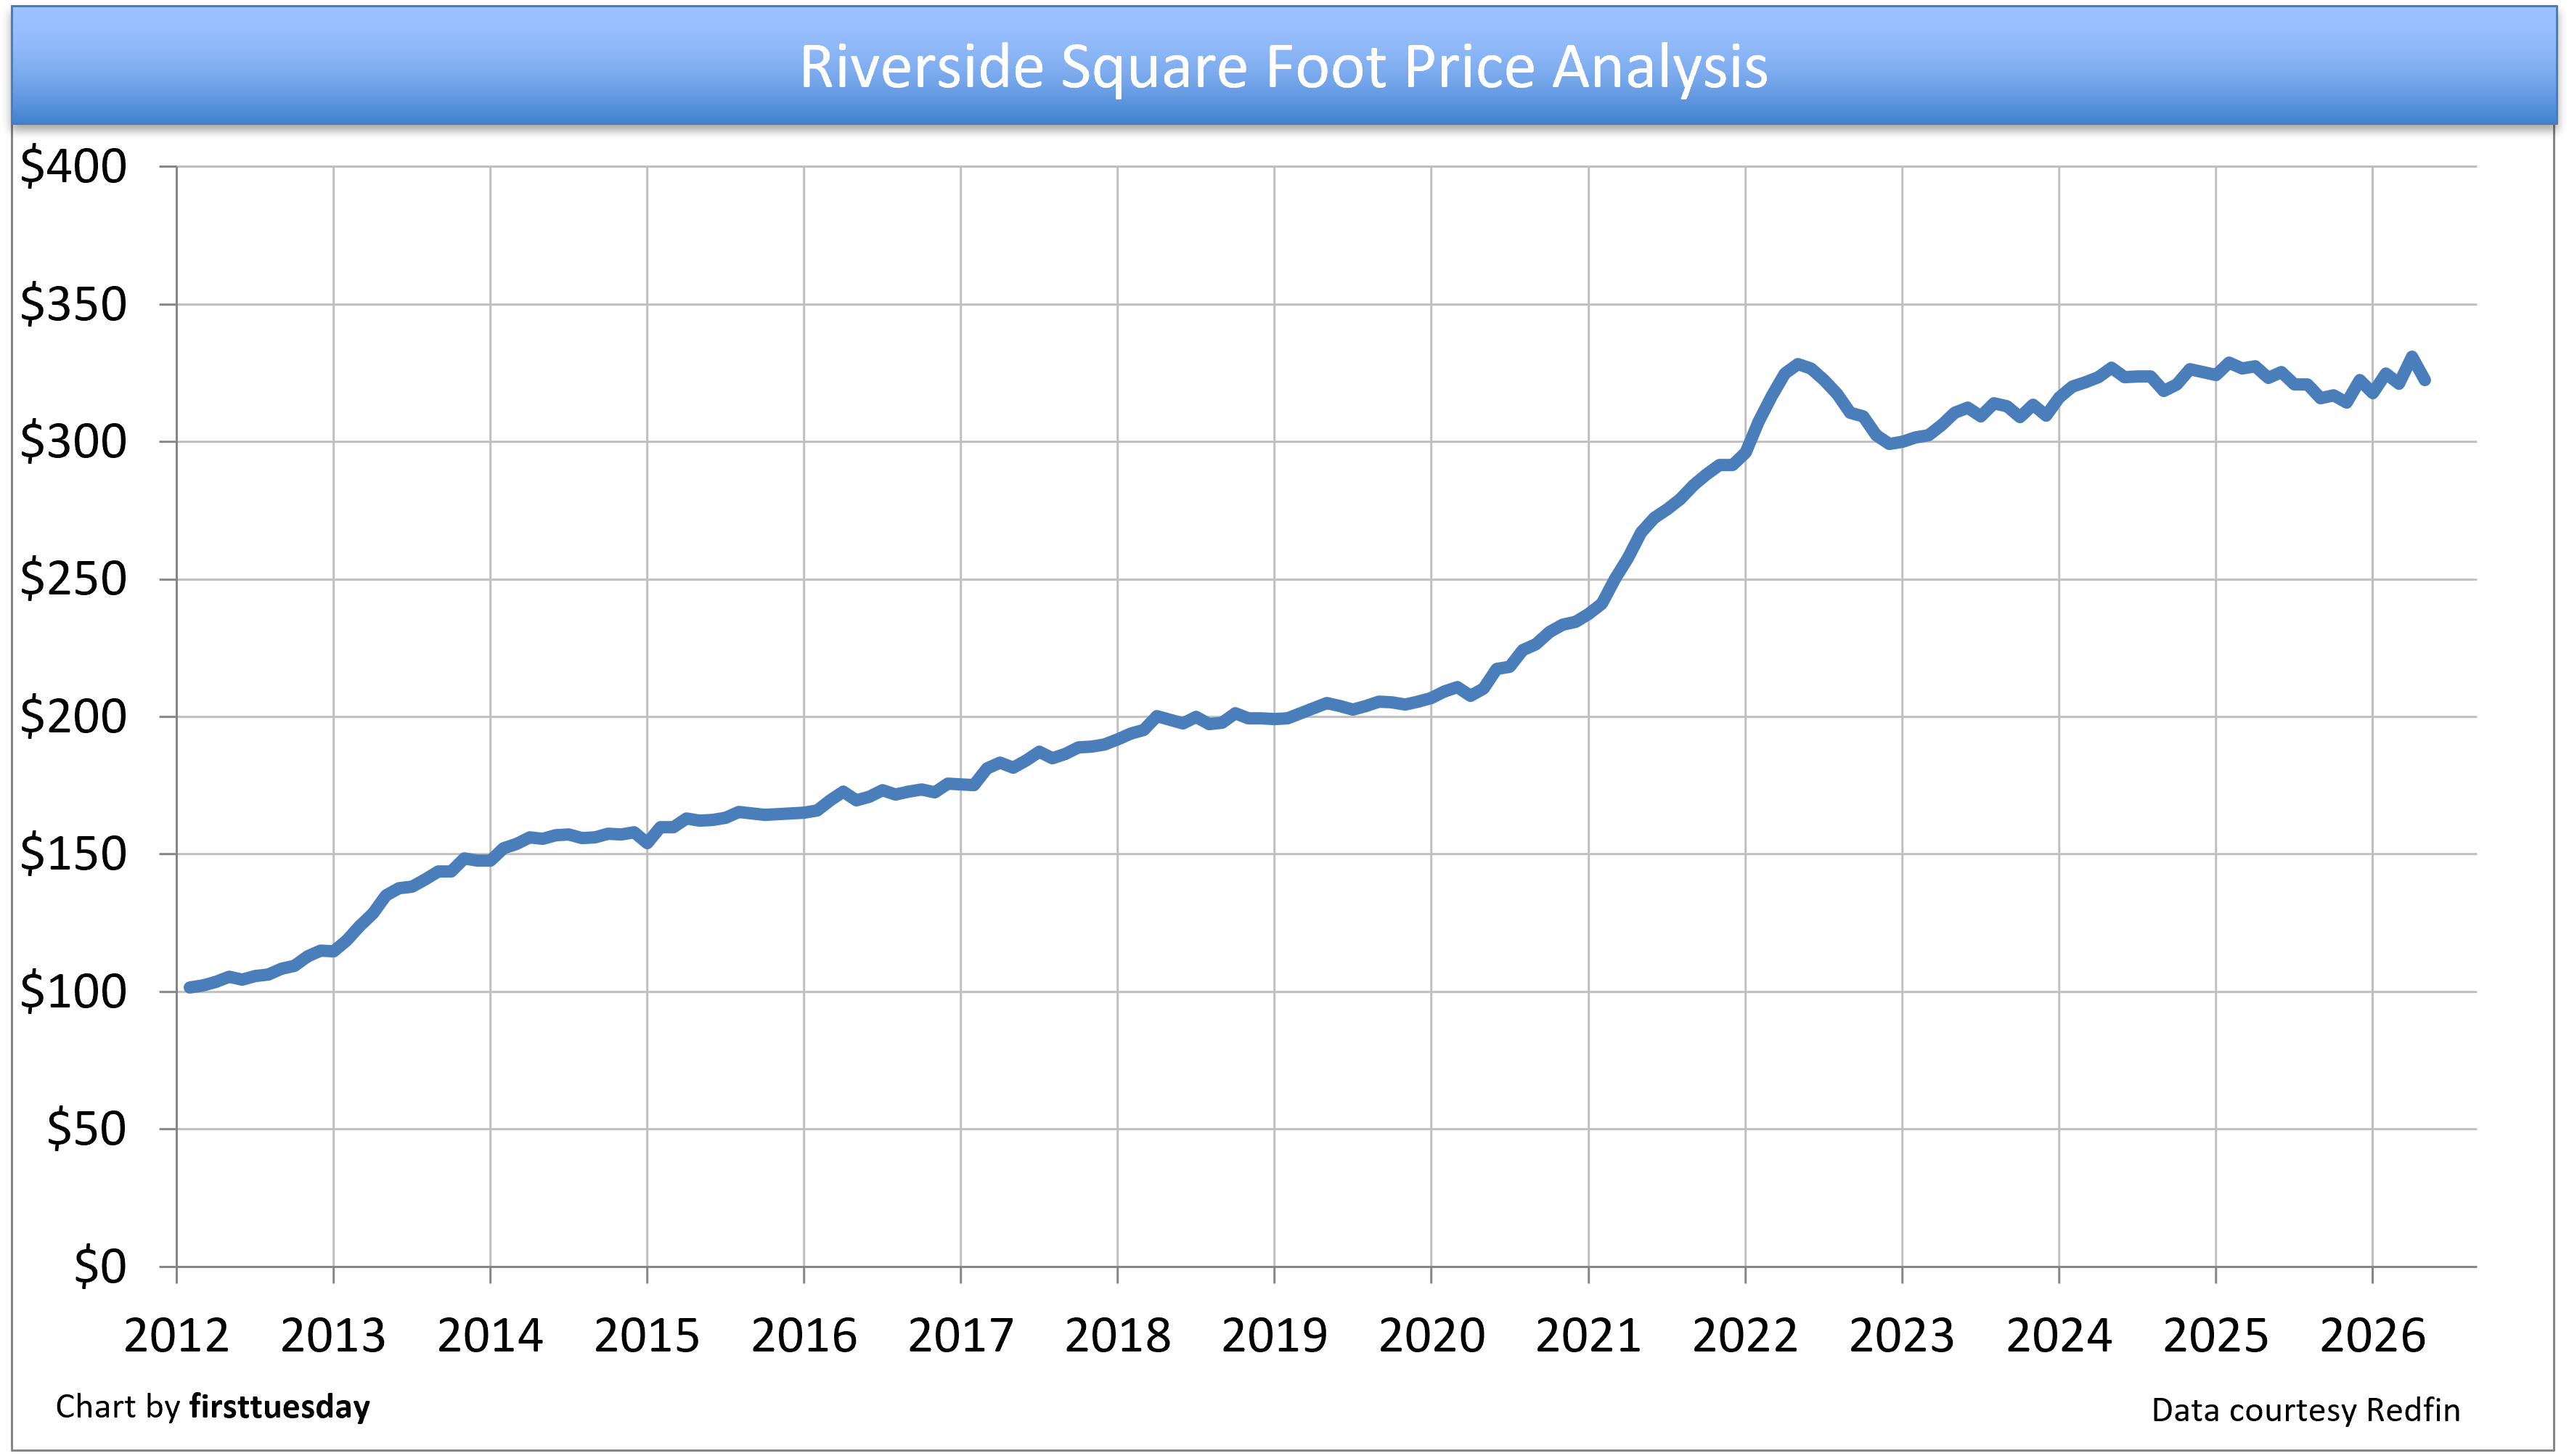 Chart update 6/24/26
| May 2026 | April 2026 | May 2025 | |
| Median Square Foot Price | $322 | $331 | $323 |
Sacramento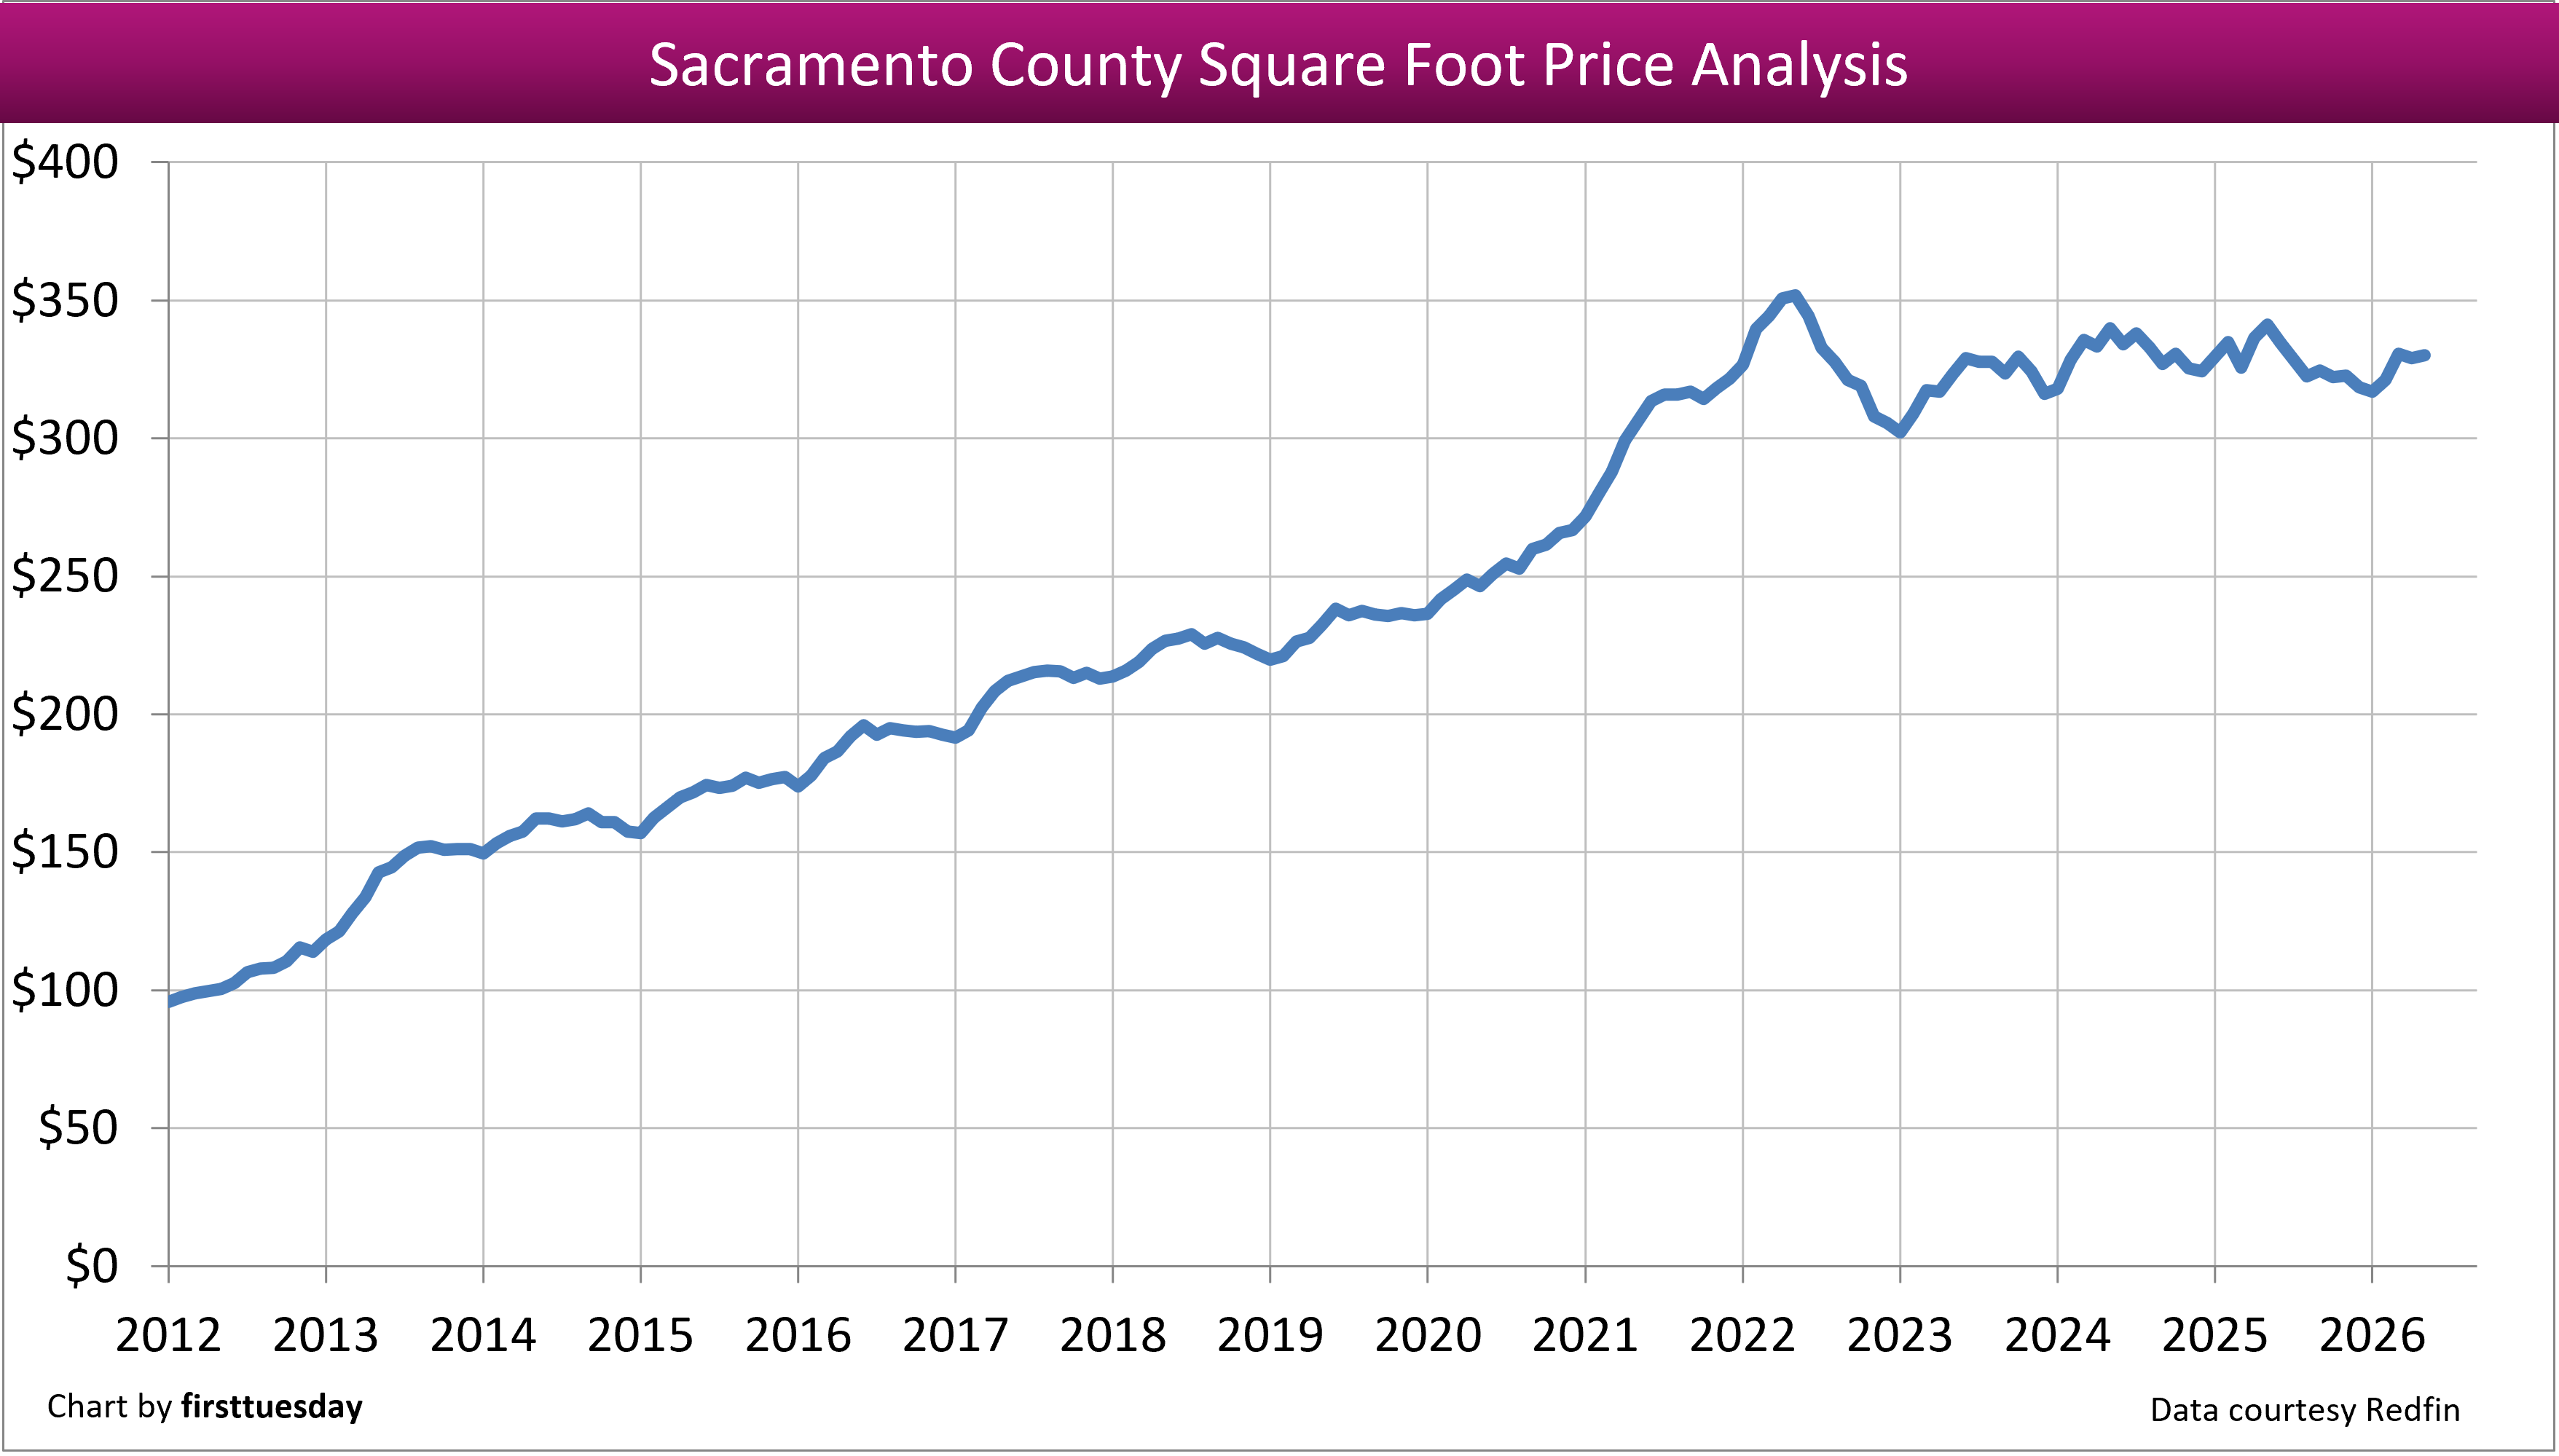 Chart update 6/24/26
| May 2026 | April 2026 | May 2025 | |
| Median Square Foot Price | $330 | $329 | $341 |
San Diego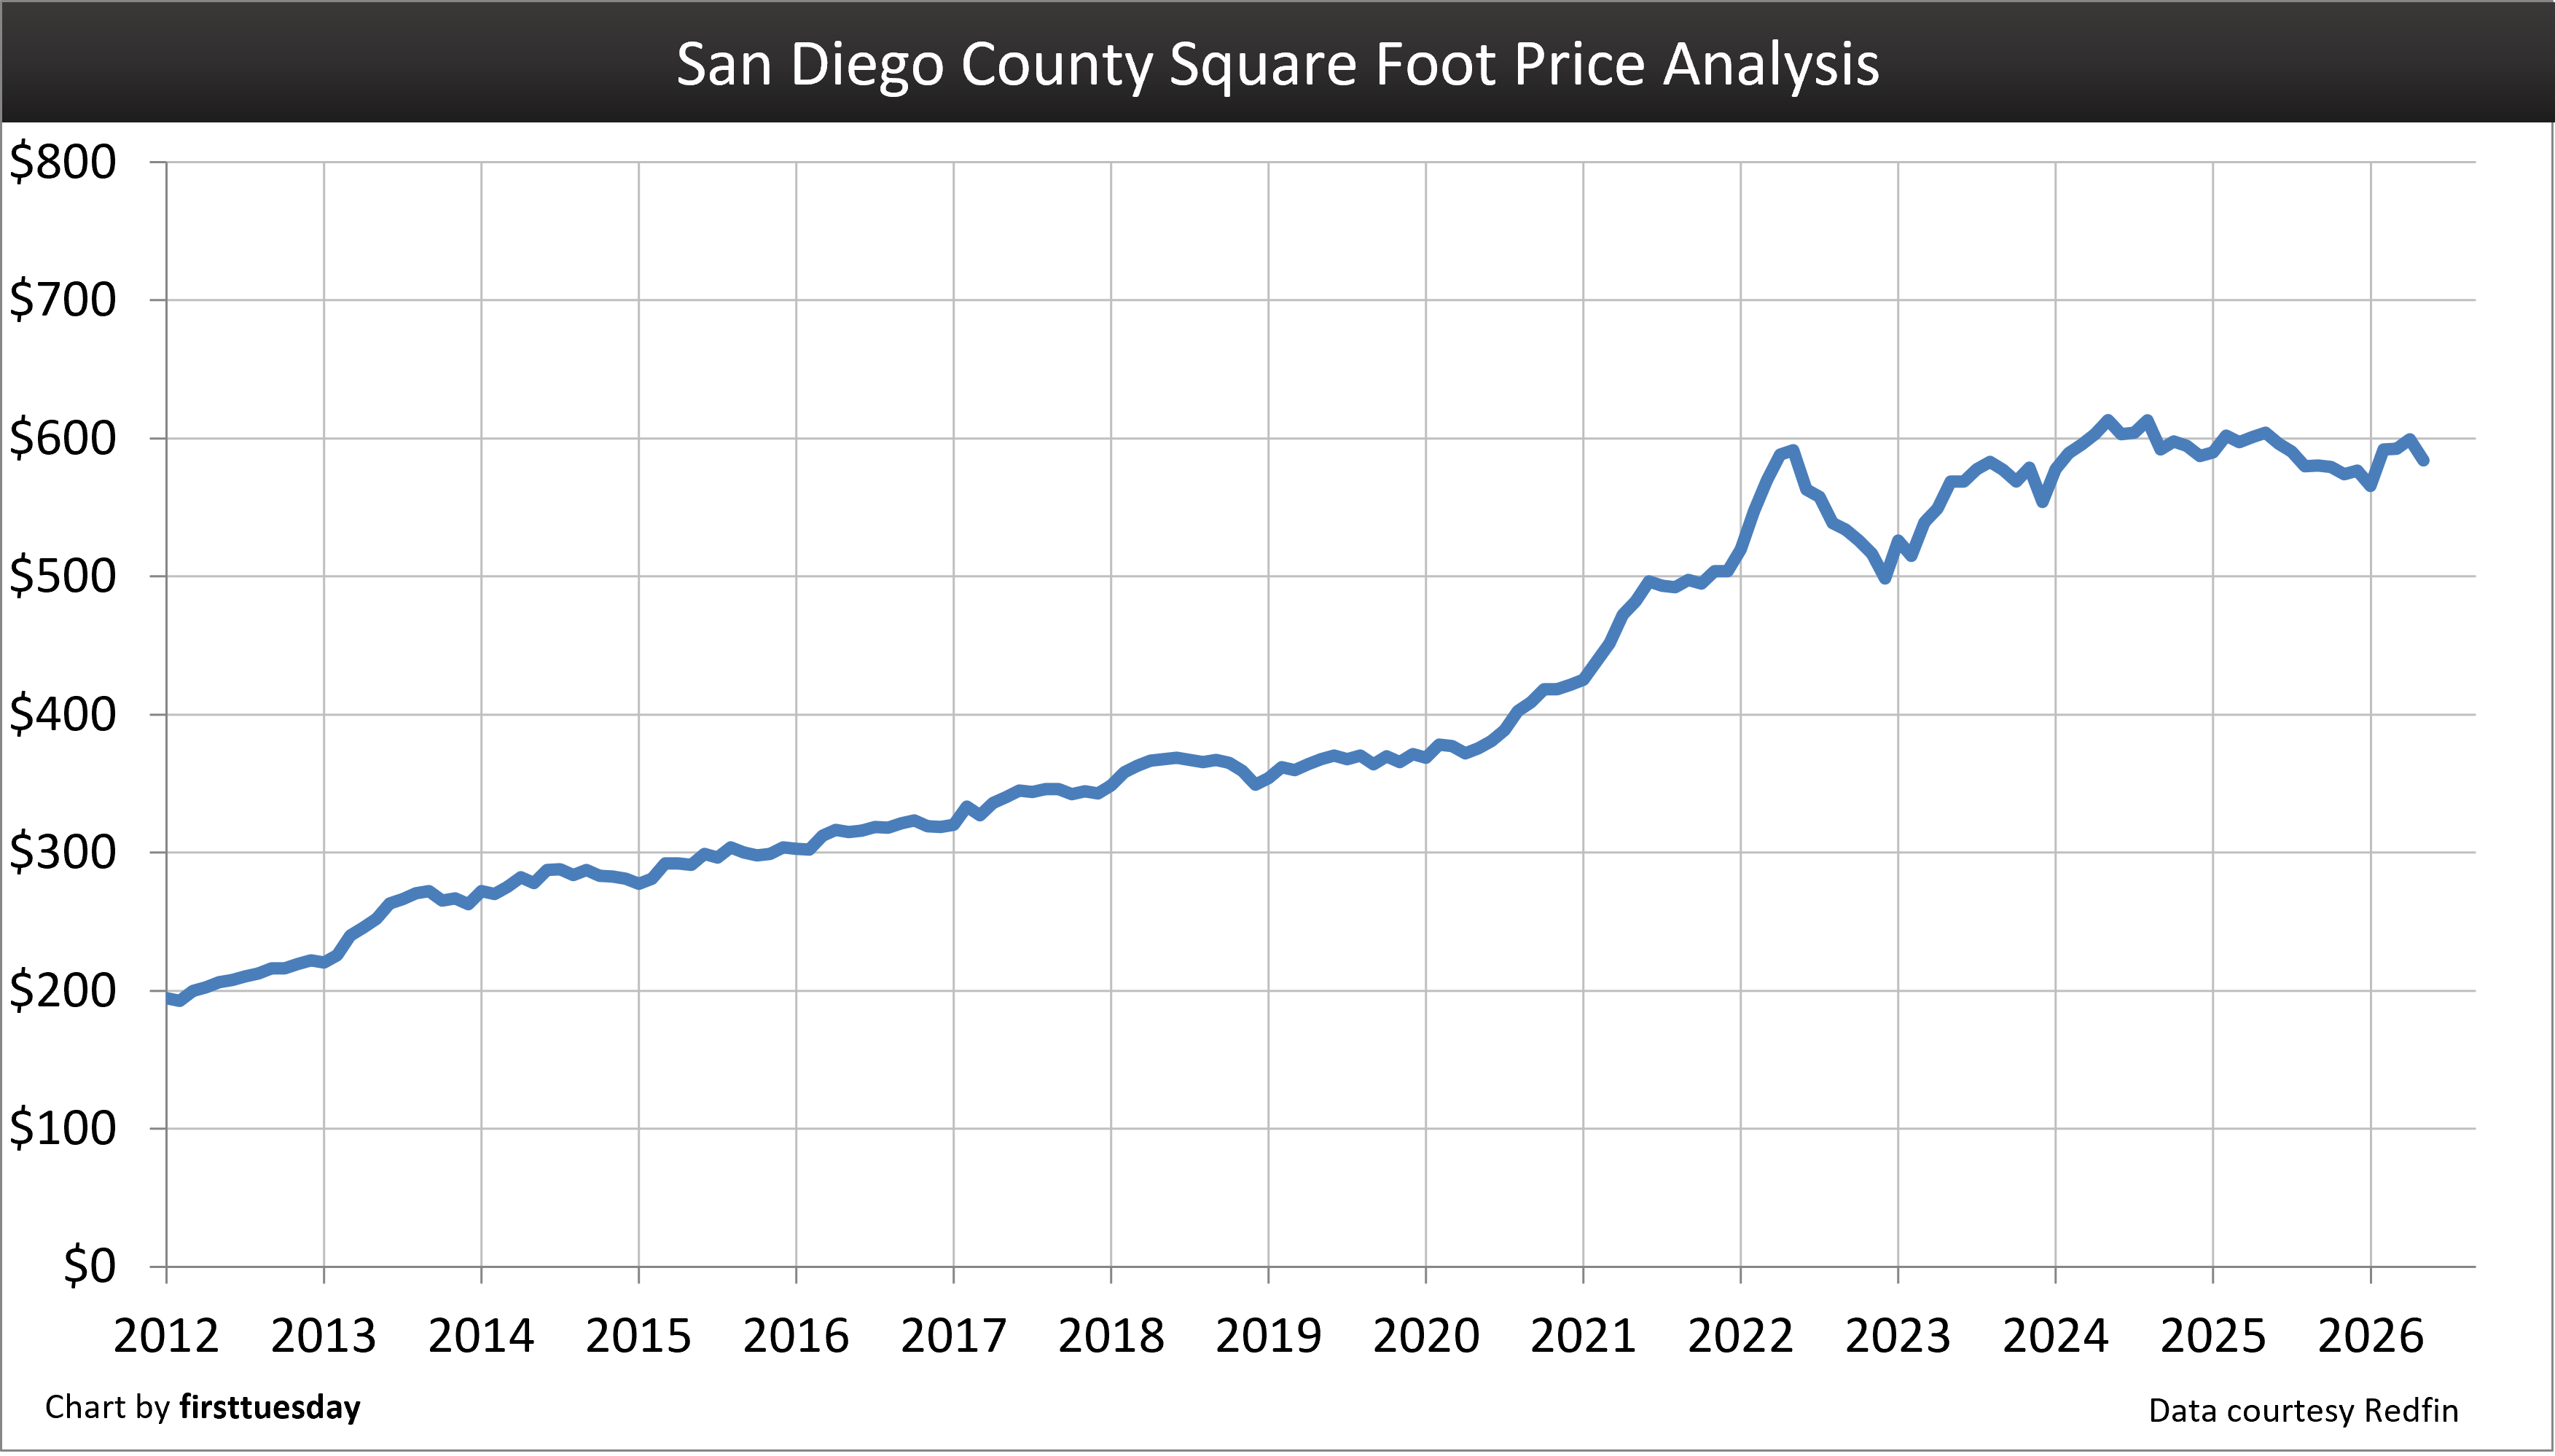 Chart update 6/24/26
| May 2026 | April 2026 | May 2025 | |
| Median Square Foot Price | $584 | $600 | $604 |
San Francisco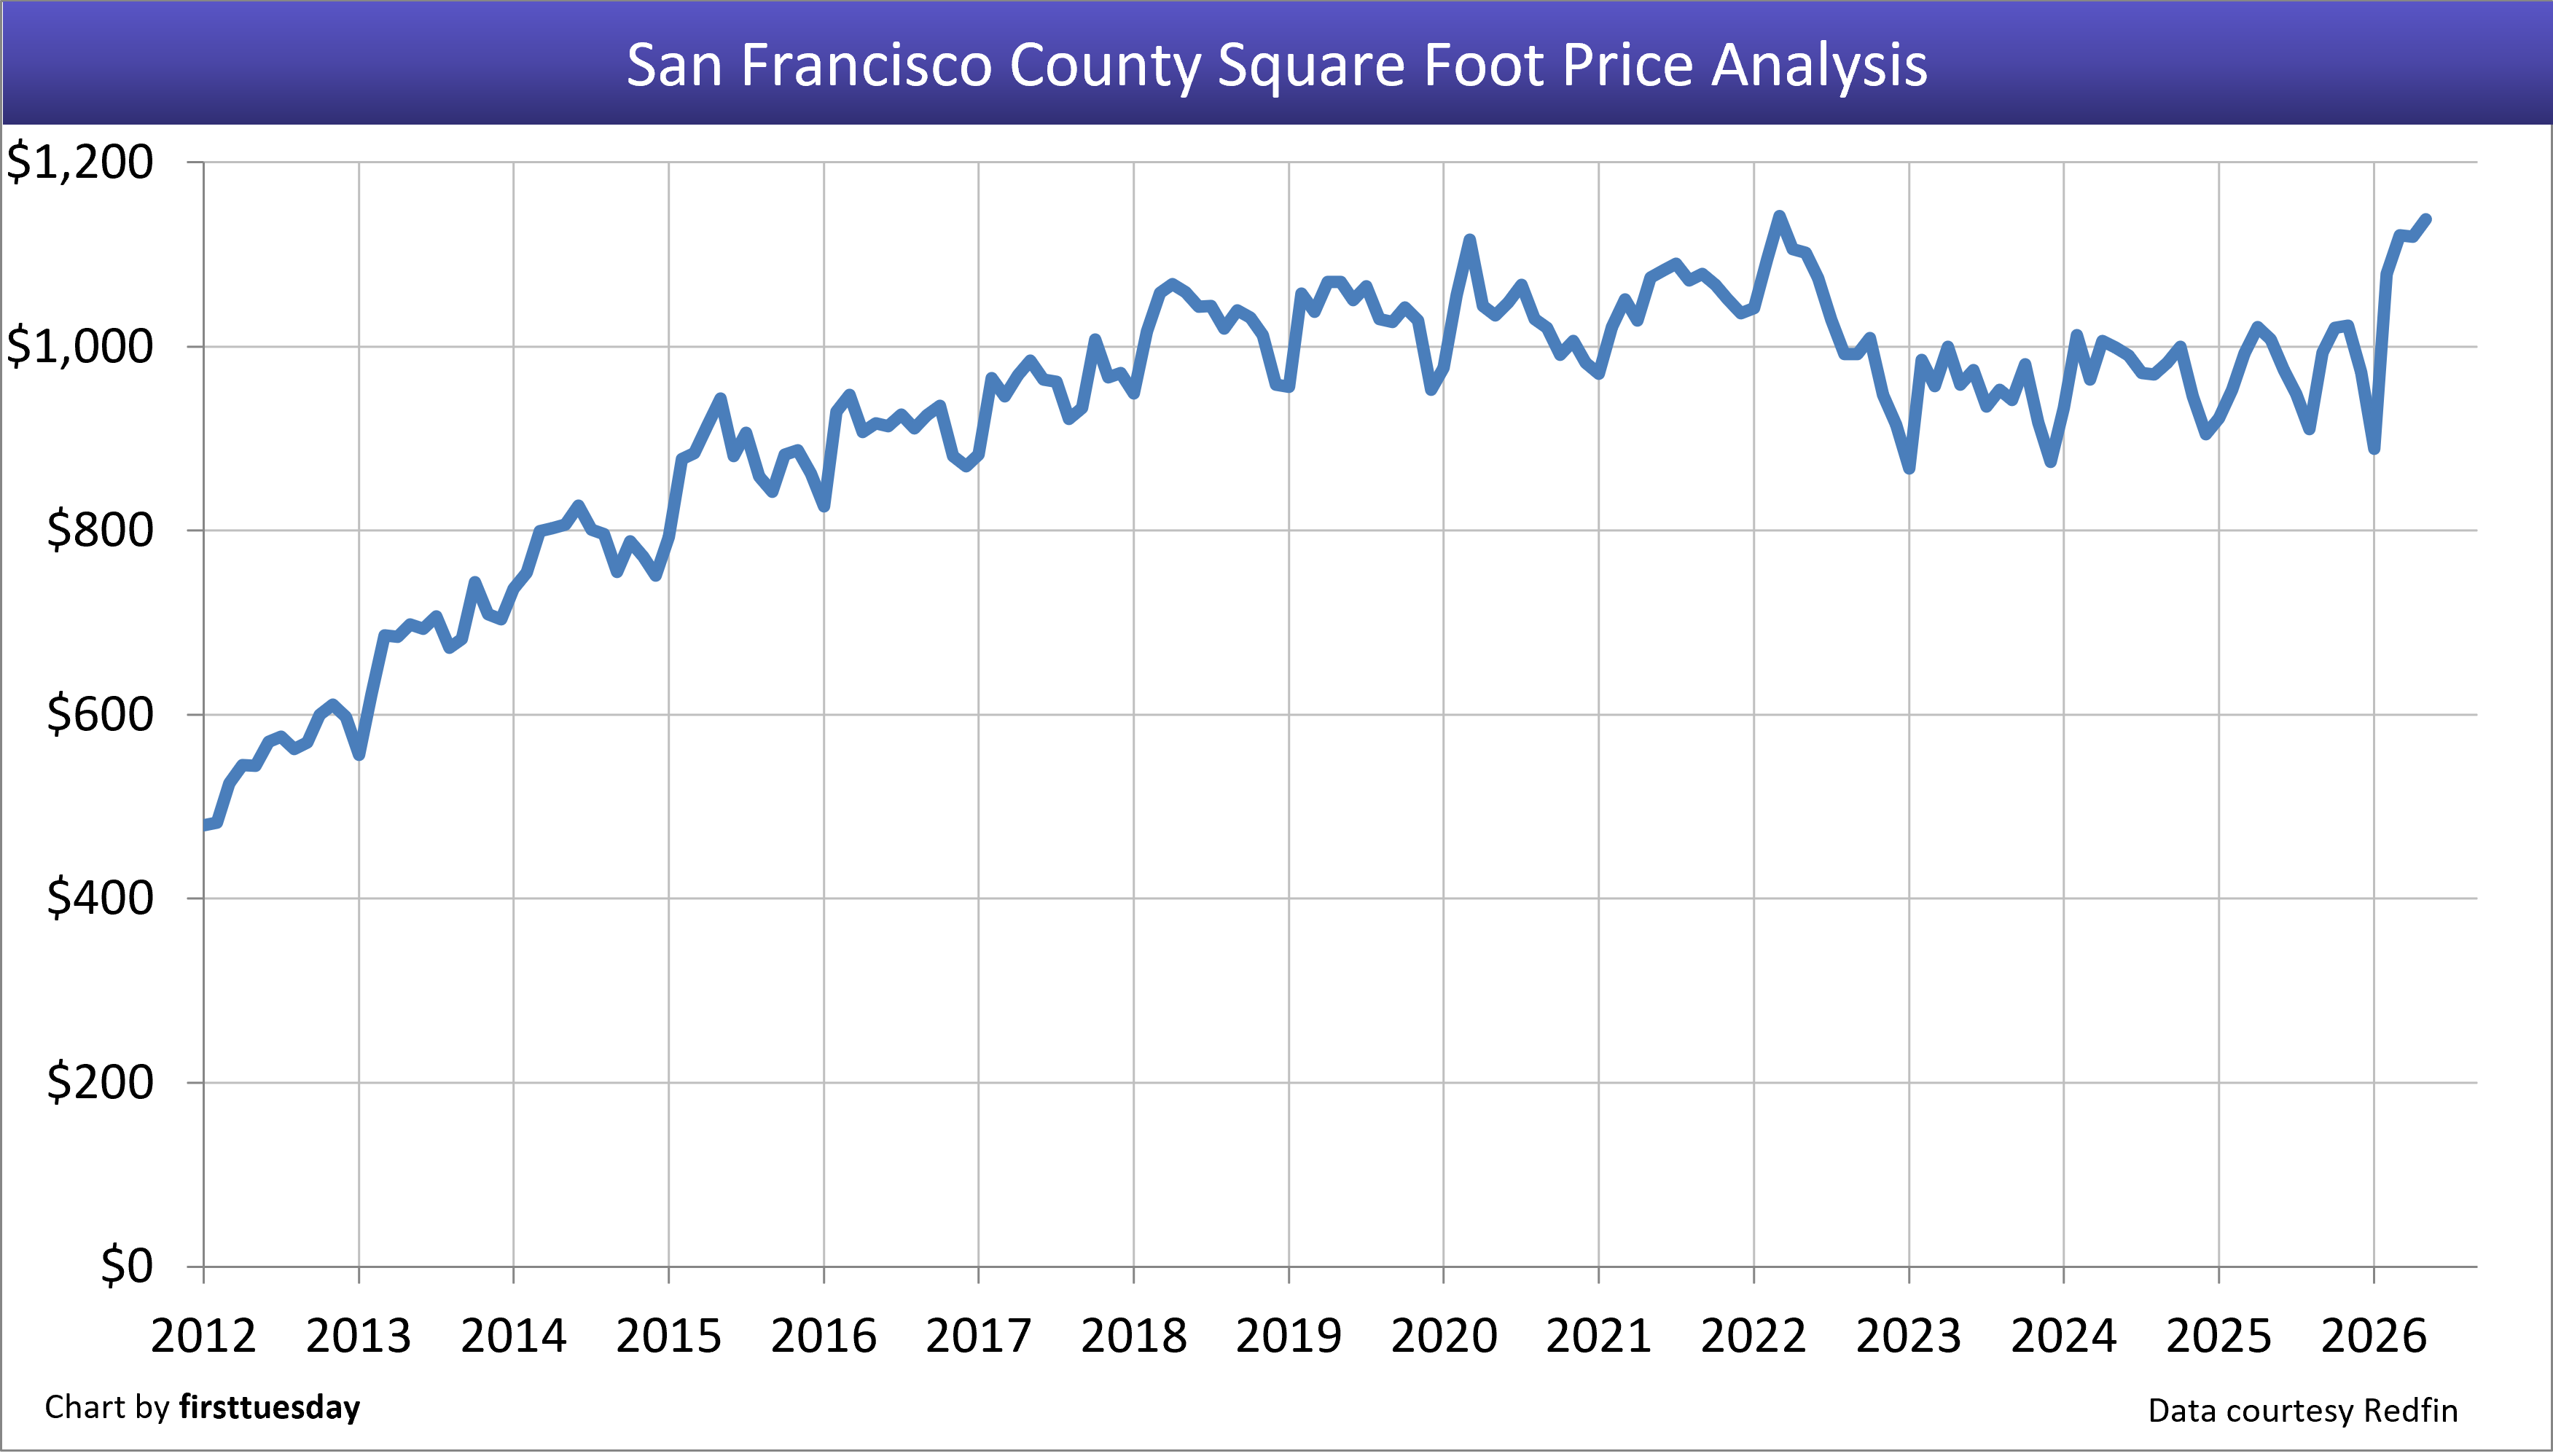 Chart update 6/24/26
| May 2026 | April 2026 | May 2025 | |
| Median Square Foot Price | $1,138 | $982 | $1,008 |
Santa Clara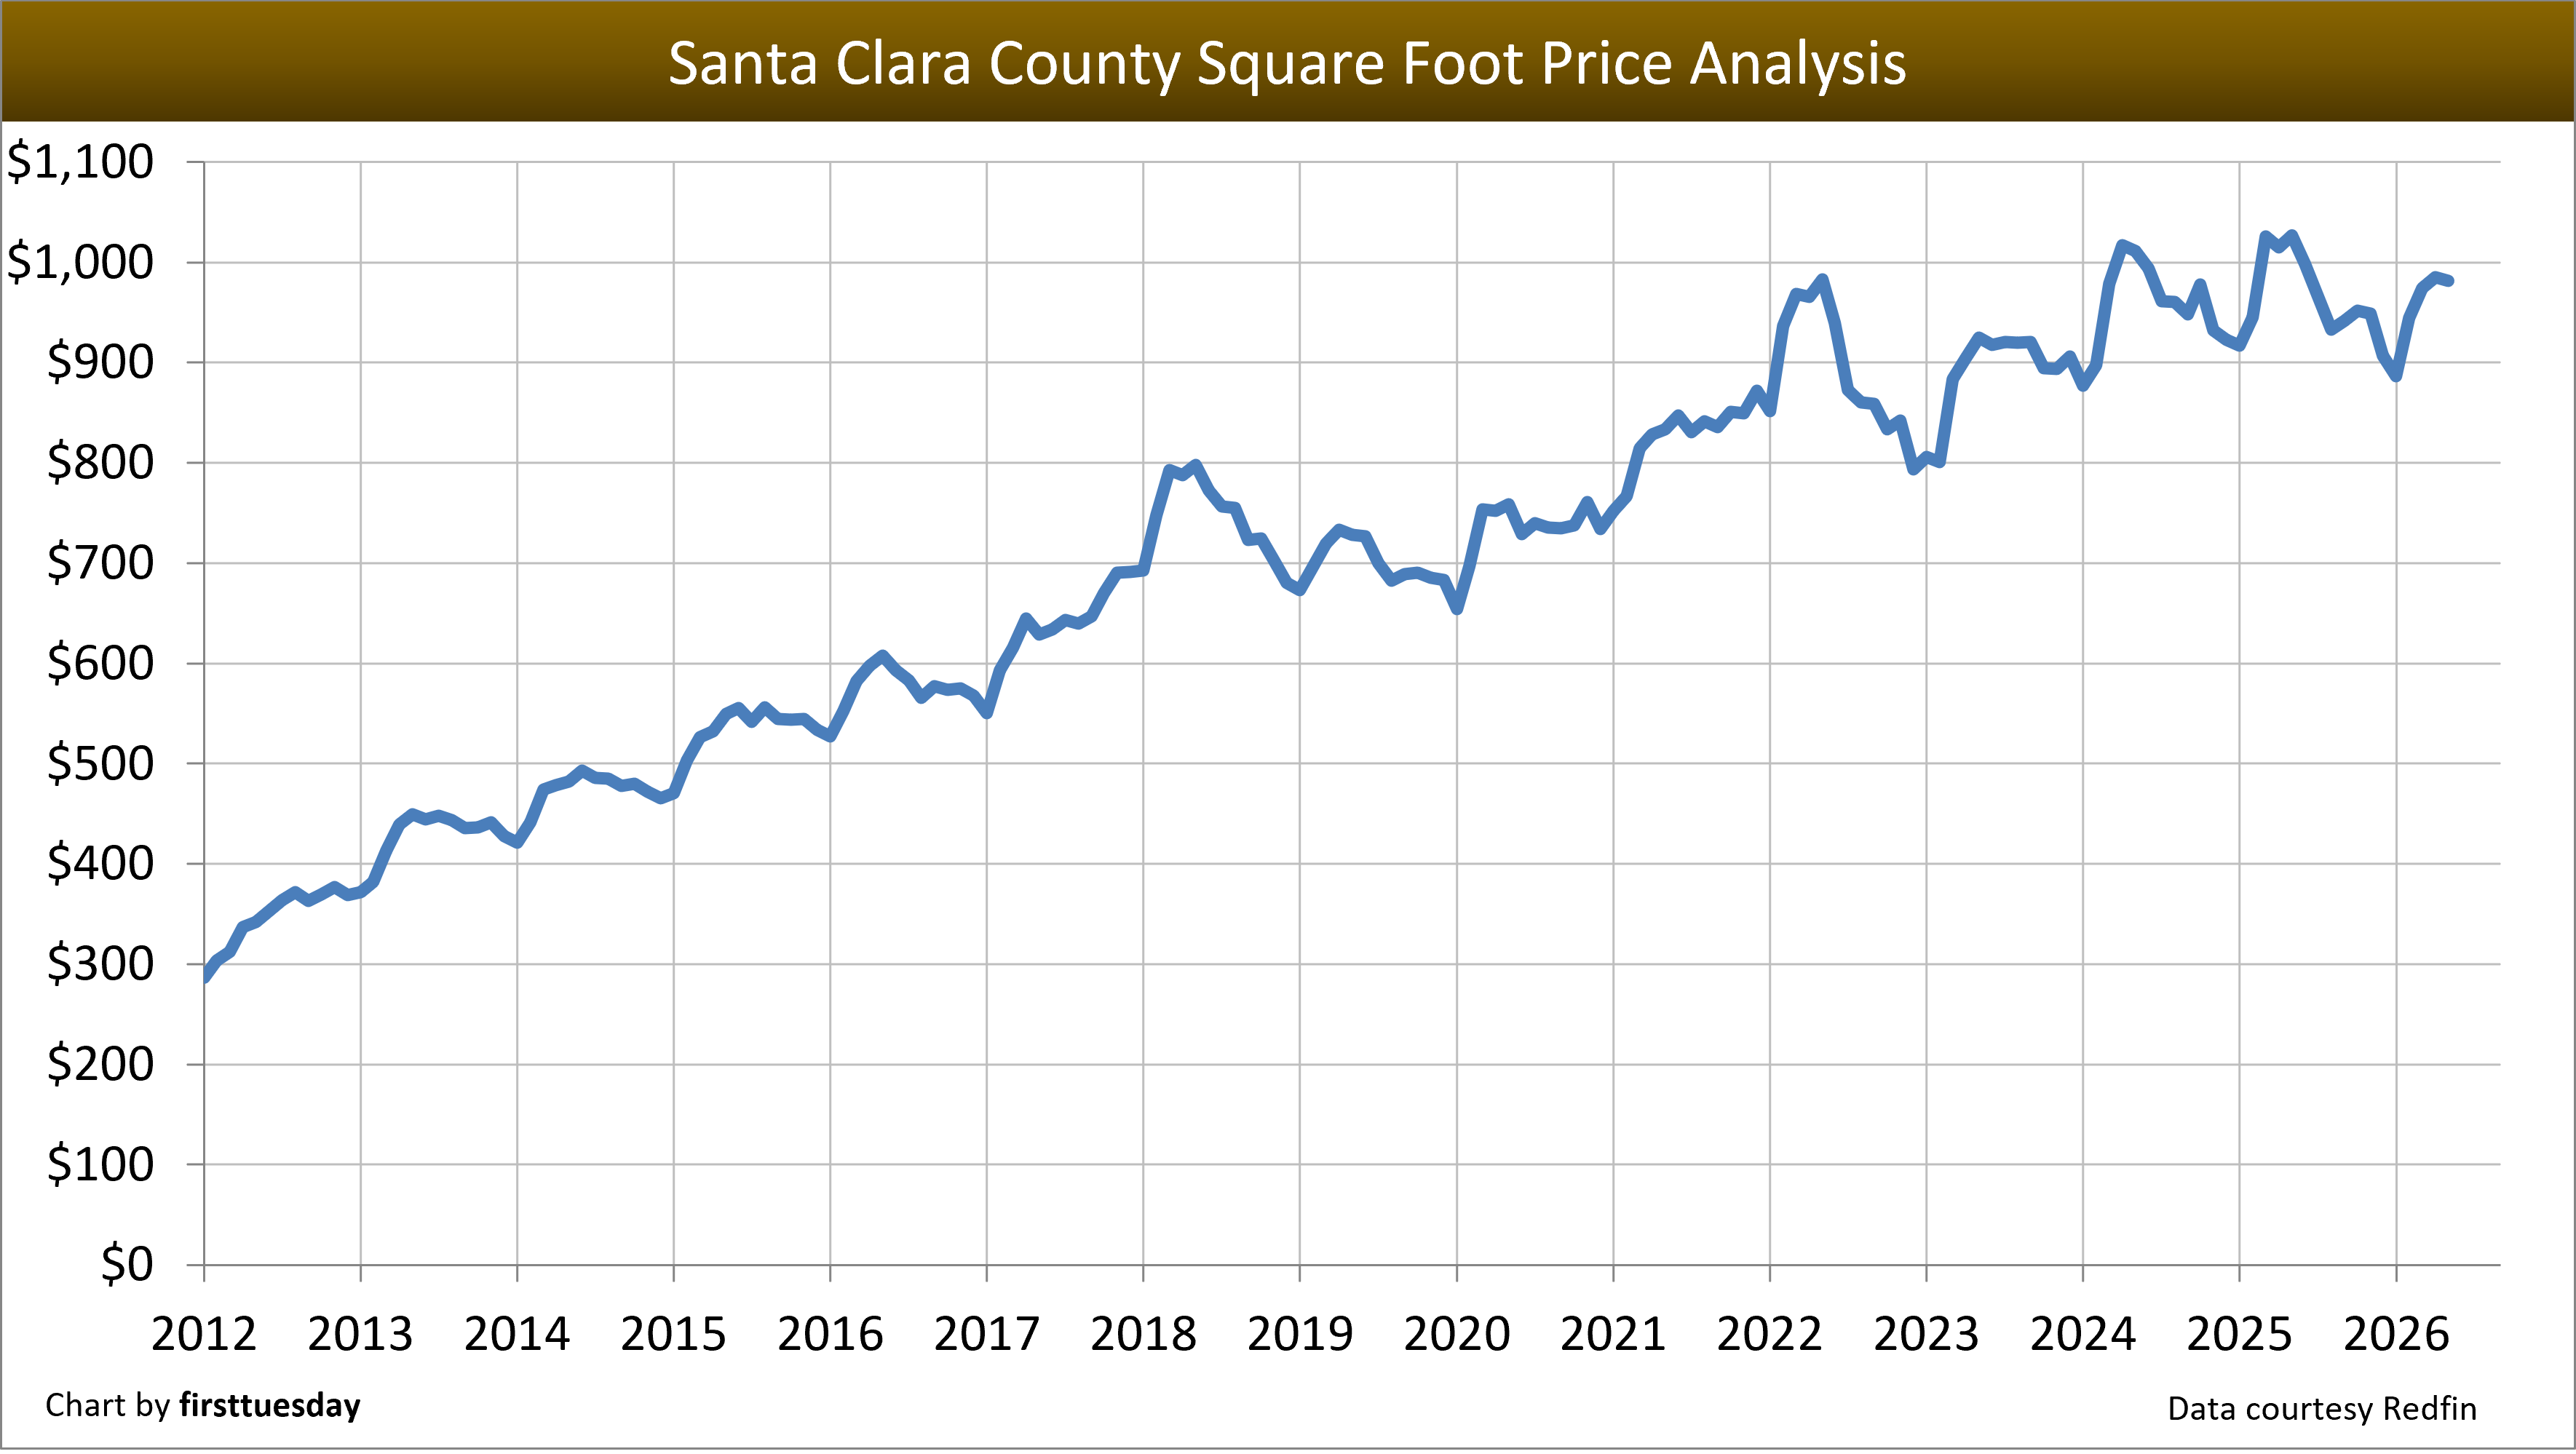 Chart update 6/24/26
| May 2026 | April 2026 | May 2025 | |
| Median Square Foot Price | $982 | $982 | $1,027 |
Data courtesy of Redfin.
These charts are updated annually.
Related article:









Would like to see the venice, ca 90291 area, specially properties around nowita place. Thanks.
PREDICTIONS OFTEN FALL FLAT
We have noticed that so many predictions about the economy and the financial arena by “experts” have fallen flat since the crisis began in 2008. The same may hold true here.
Another possibility, being raised by “fringers” is that the FED will end up owning most of the properties in the United States, thereby becoming the landlord of millions of Americans, as it begins renting them out. It sounds outlandish, but is it?
WHEELS WITHIN WHEELS
A cyclical occurrence has been boom and bust, PURPOSELY planned, PURPOSELY orchestrated, and PURPOSELY followed to completion. Let us explain. The persons at the top of the food chain in America, in cohorts with the government and FED, PURPOSELY initiate policies of easy money to coerce the common people to buy real property, KNOWING they will eventually lose it, as the top dogs PURPOSELY manipulate the very same financial policies and the economy to make sure they do.
MASSIVE TRANSFER OF REAL PROPERTY
As millions lose their homes, there then follows a MASSIVE transfer of real property FROM the common people TO the elite. As millions are then reentering the rental market, having lost their homes, the elite then RAISE the rents substantially, and they get away with it due to a short supply of rental units and a now huge demand (which they created).
BANKERS MAKE MONEY NO MATTER HOW YOU SLICE IT
The banking elite made their money on the interest charged from a loan that was created out of thin air at the moment it was made (fractional reserve banking). They then repossess the property and resell it, making money again. They really lost NOTHING, as they really gave nothing, but fabricated money for a loan. All the while this process is grinding on, the FED and the U.S. Congress by backdoor means, is feeding money into the maw of the banks, not to mention outright bailouts. In addition, the banks are receiving .25% on the money in reserves from the government.
SHAMS AND CHARADES
The government then “investigates” the criminal activities of the banks (which are legion), finds guilt here and there, and then levies “huge” (not really) fines in the billions of dollars for public show (as the public now hates the banks and loves when they are “punished”). Where does the money from the fines go? Even fines of $10 billion or more are a pittance to banks, which are handed money by Congress and the FED in much larger sums routinely, not to mention the $30 billion (with a B) they make just in fees per year.
In olden times, in many lands, this same cycle precipitated what little wealth the plebians had BACK into the hands of the patricians. So it has been, and so it is, and so it will be until the current system of inequalities is ended by a more enlightened future populace.
Meanwhile the merciless steps of the super wealthy will continue to be heard in the halls of power, treading down the common man. Historically, this can only last for so long, until finally, the jig is up, the stupefied public awakens, and it forces the elite from power—-temporarily. The elite, being the cunning campers they are, soon worm their way back into power (never having lost it completely), re-mesmerize the plebians, and the cycle begins anew.
HOPE FOR THE FUTURE
Again, as we said, this whole fetid system will finally end when a future, more enlightened populace finally evolves and prevents a recurrence of the cycle, then initiating a truly equitable and sustainable system built on high ethical and moral principles and mutual respect.
great charts, although it’d be ideal to see inflation-adjusted cost psf (the common assumption that real goods adjust for inflation turns out to be far from universally true in RE).
I find your info. valuable. Would like to see Newport beach, San Clemente, San Juan Cap.
with separate charts if you have.
thanks.