
Why this matters: Informed real estate agents and brokers know jobs ultimately determine selling prices as households only pay as much for housing as their savings, income and credit score qualify them to pay.
Employment plateaus
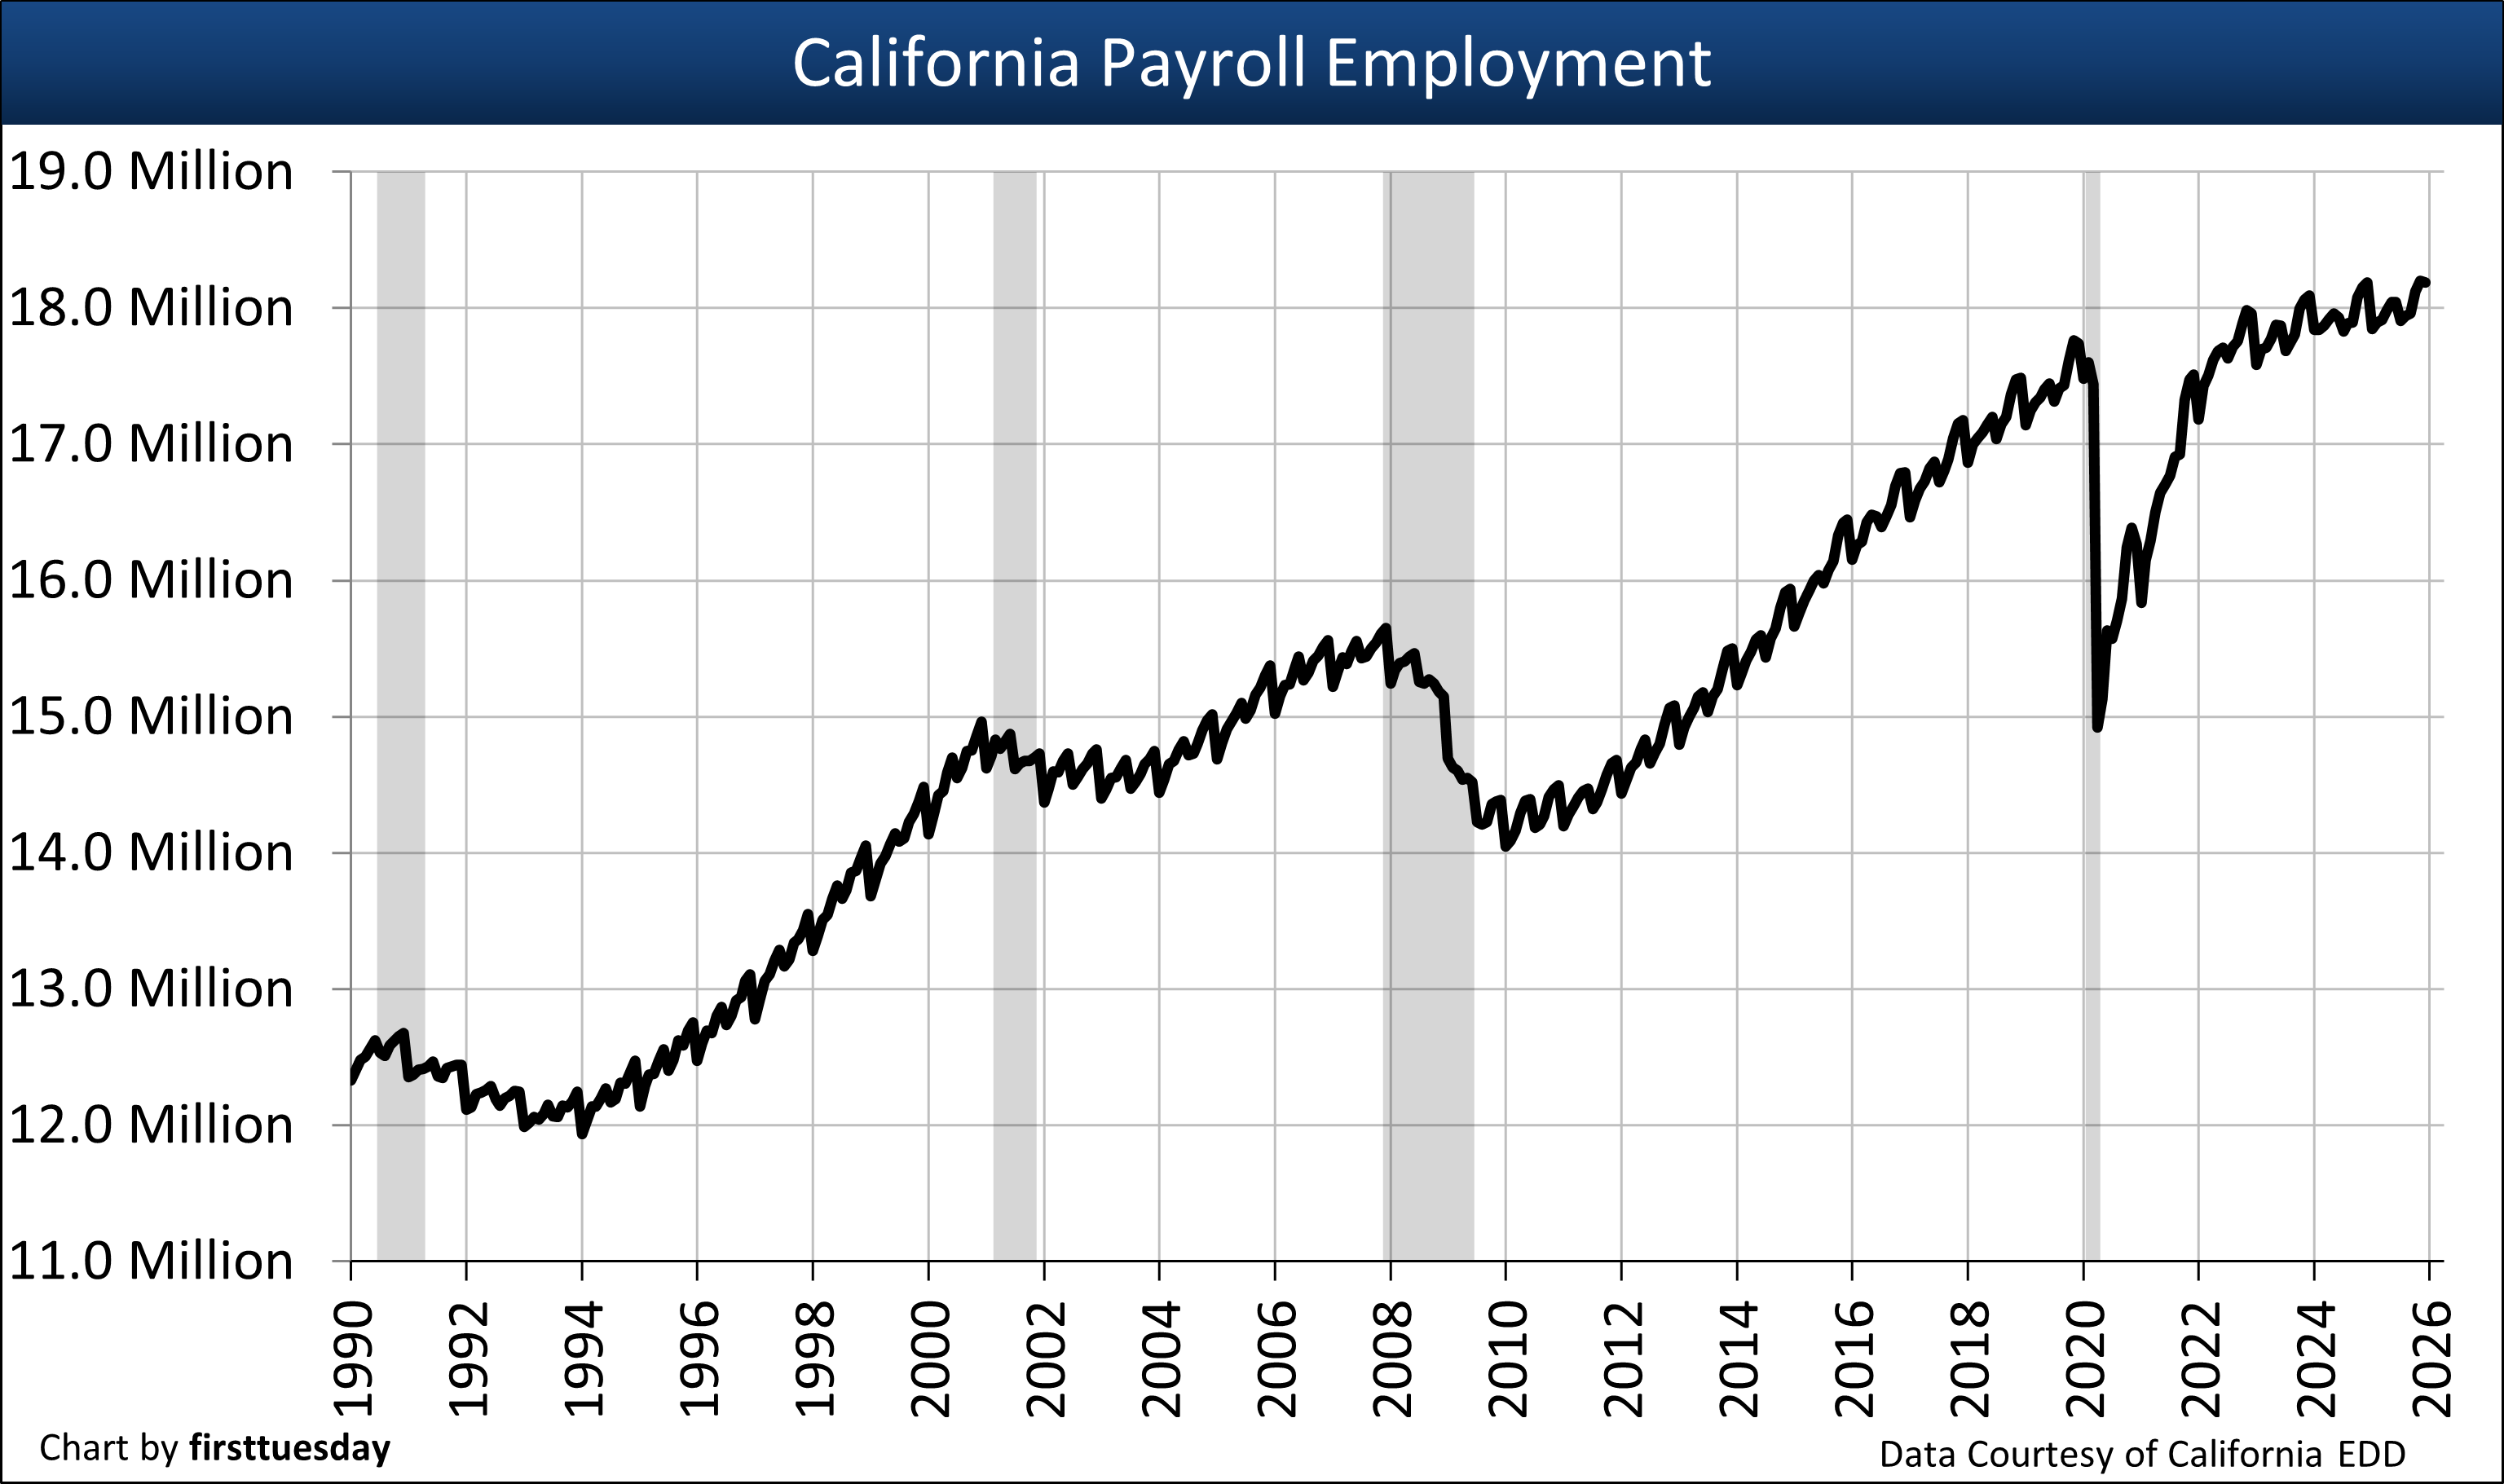
California’s jobs market surpassed its pre-pandemic 2019 peak of 17.6 million total non-farm jobs in October 2022. However, only 2.5% more Californians are employed in December 2025 than six years earlier.
The pace of our job growth began to decelerate in mid-2022. The slowdown continues with jobs stagnating to the detrimental rate of 0.0% for the 12-month period ending December 2025. Compare the current deteriorating job market to the 1.8% annual growth rate of 2019, the last normal business year. Meanwhile, the current housing-market recession began with the second half of 2022.
Fees earned by real estate agents and mortgage loan originators (MLOs) were slashed in our ongoing real estate recession. Transaction fees remained severely reduced in 2025 with no indication of an upturn until after 2026, maybe later with all the economic uncertainty in motion. Expect a couple of years of the current slow decline in FRM rates for property sales to improve now that buyers en masse have become unwilling to acquire property.
Innovative real estate licensees are choosing to pivot from a seller’s market by expanding their practice to include fee-generating transactions on the buyer-and-MLO-side of the market which are different and more productive during a recession. Many DRE licensees opted for a career change while employers are still offering the chance.
With buyer representation now mandated as a written agreement (or no fee is earned or retained by a buyer agent), tenants will more readily become buyers as they sense the results of far better treatment by the gatekeepers to ownership — real estate licensees.
Following California’s exit from the economic upheaval of the 2020 pandemic economy, another more significant business cycle recession is tightening its grip on jobs, and thus the housing markets. In sympathy, jobs will bounce in starts and stops – or stops and starts – presently in a declining trend, not to enter a recovery pattern until the undeclared real estate recession, ongoing trade wars and federal attacks on immigration are behind us. When conditions warrant, immigrants buy and own homes, contributing to the housing market in addition to California’s overall economy.
The housing market bounce-back from the current three-year old real estate recession cannot be reliably forecast until the global trade wars settle down with durable, if any, import tax rates. Further, a loss of jobs is expected through the 2026 period, maybe beyond, due to uncertain business conditions, volatile import taxes on products and materials, reduced ability to export, diminished travelers and immigrants, and other isolationist-infused 1930s-type conditions.
Chart 1
 *Data not seasonally adjusted
Chart update 2/16/26
| December 2025 | November 2025 | December 2024 | |
| Total CA Non-farm Employment | 18,187,300 | 18,200,700 | 18,186,400 |
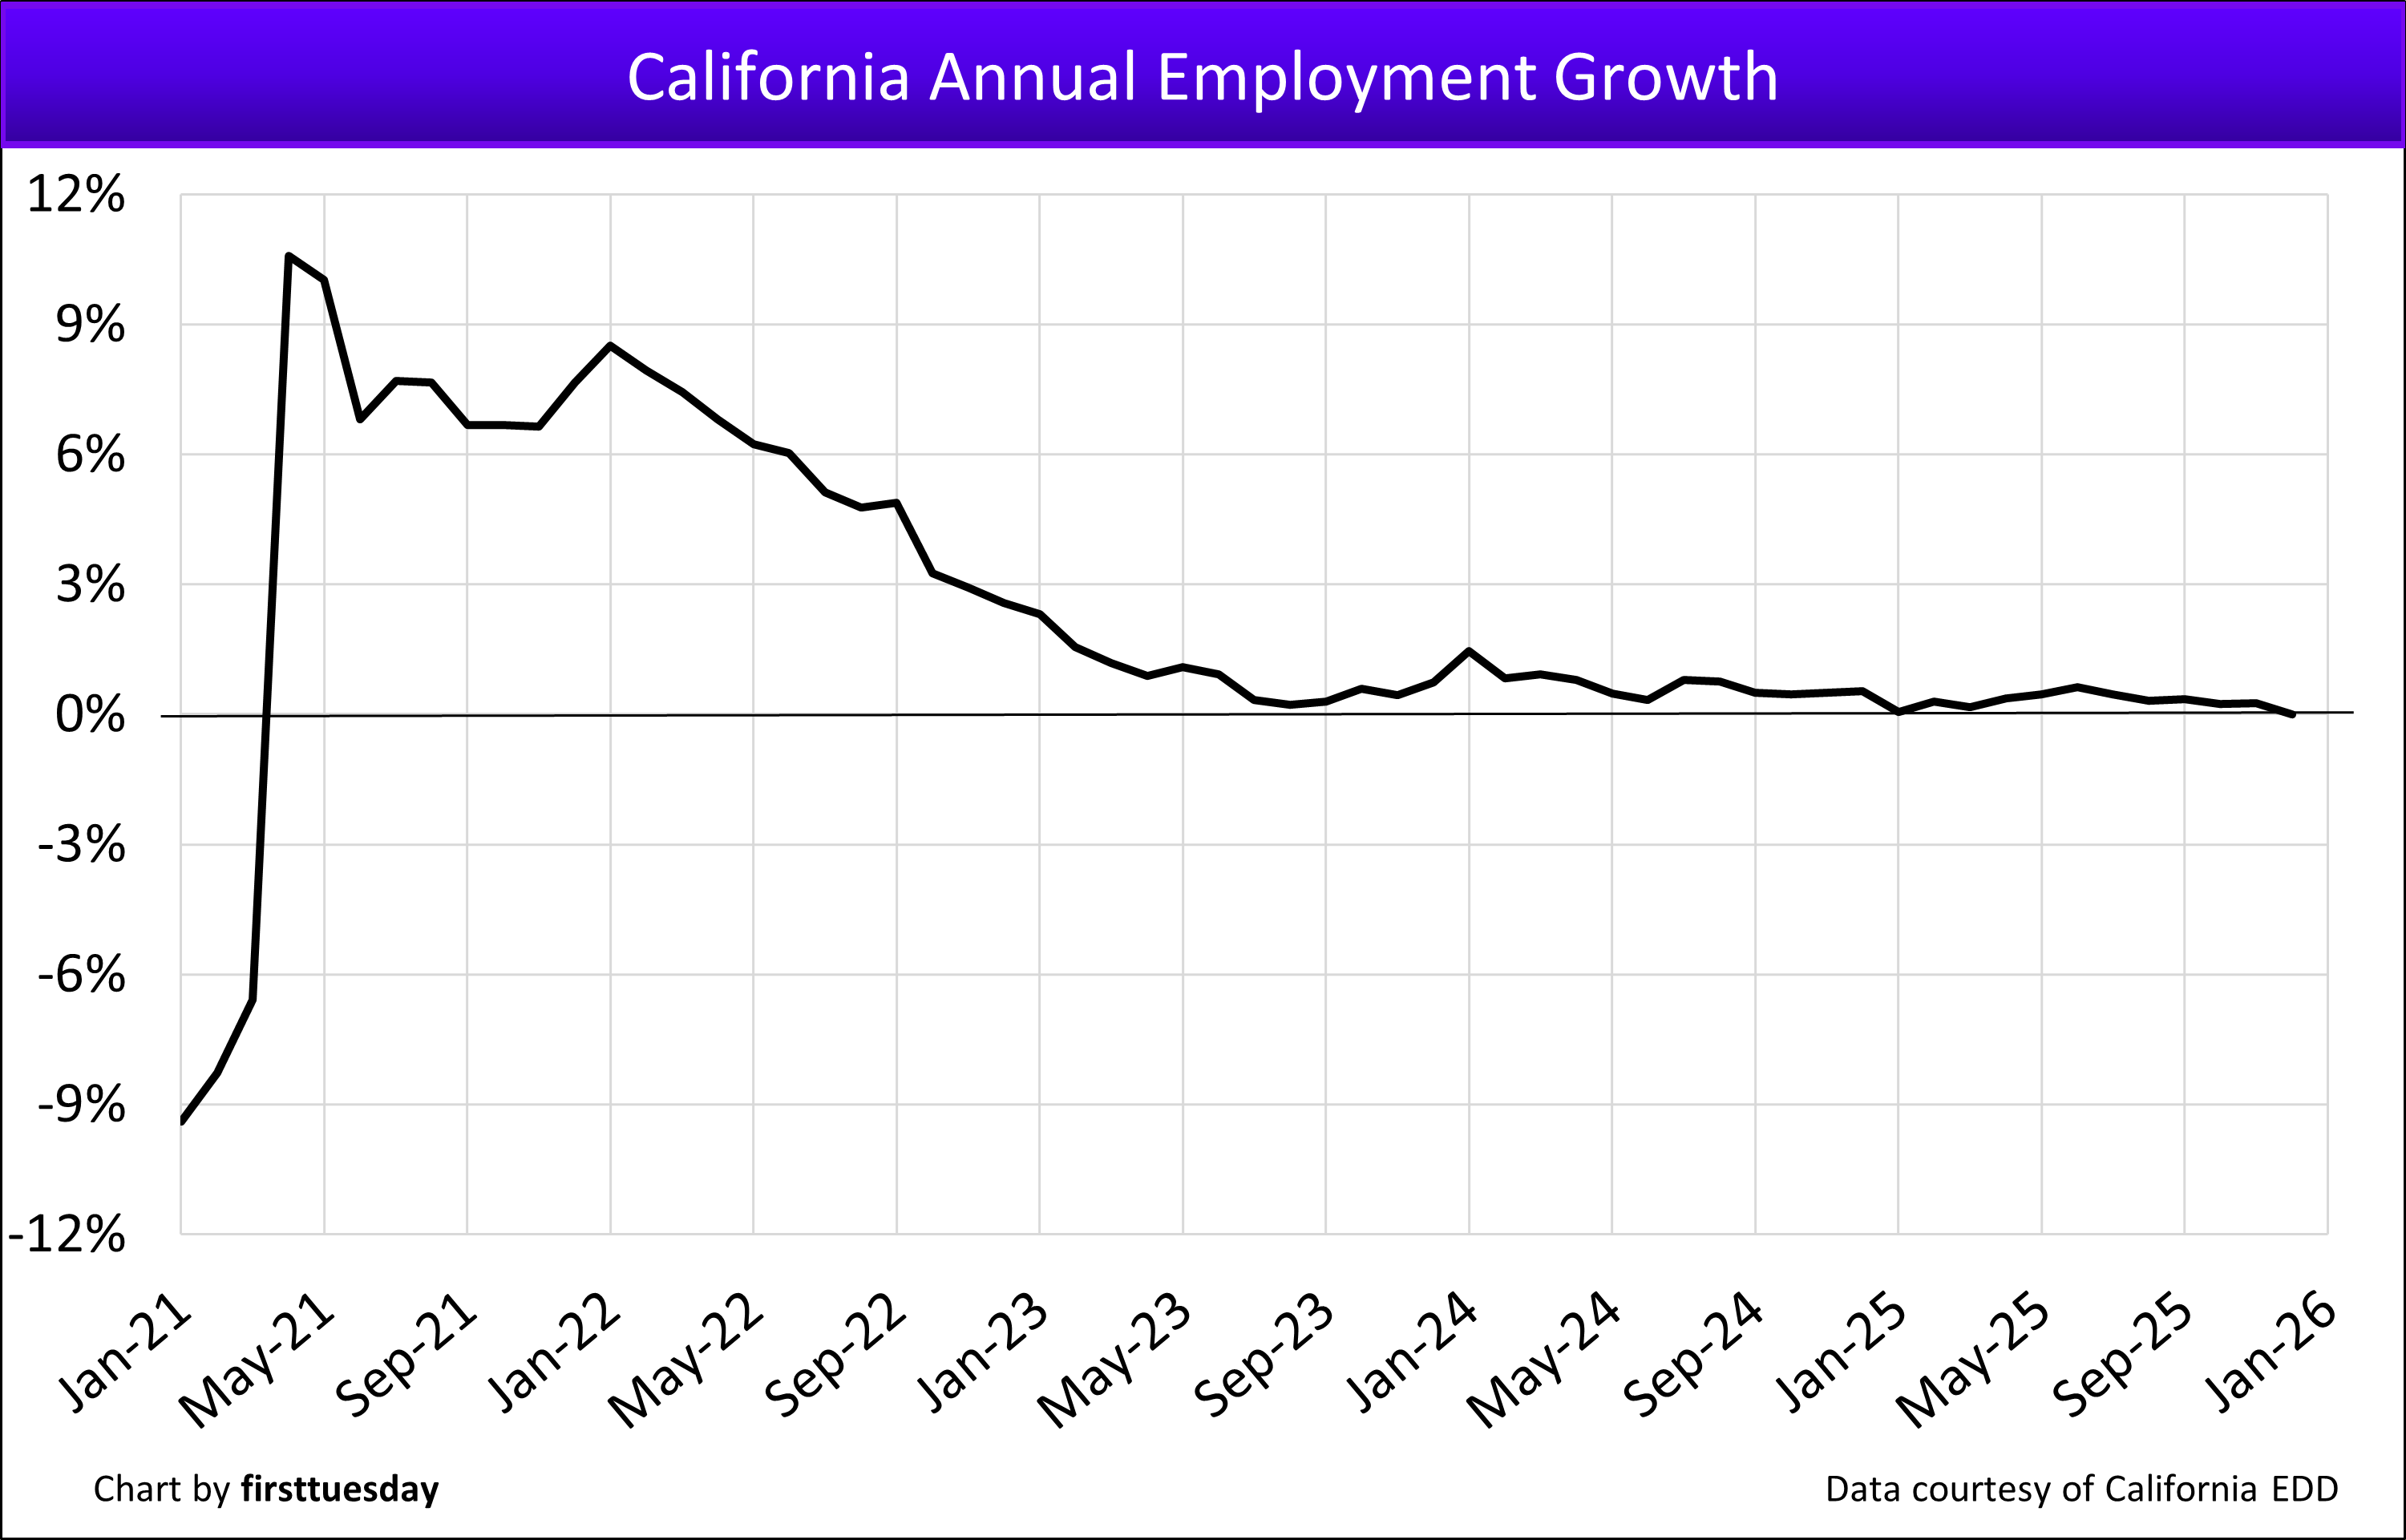 Chart update 2/16/26
| December 2025 | November 2025 | December 2024 | |
| Annual CA Employment Change | +0.00% | +0.26% | +0.53% |
Data Courtesy of the California Employment Development Department (Labor Market Information Division)
All forecasts are made by firsttuesday. Forecasts are based on current data, influential factors and market trends.
Your real estate market looks first at local employment
The chart above tracks the single most important factor when determining the future for all types of real estate transactions in California: the number of people employed. Real estate retains value solely in its ability to be occupied by individuals — living or working or both — except for dead storage space.
The chart reviews total non-farm employment numbers statewide. The gray bars indicate periods of economic recession (as tracked by the National Bureau of Economic Research).
Related article:
What is the Conference Board? A recession proclaimed by committee
Some key points to pay attention to in recent California job trends:
- Jobs recovered from 2020-2021 pandemic job losses and exceeded the prior 2019 jobs peak in October 2022.
- Jobs in California recently peaked in November 2025 at 18,200,700.
The number of jobs in California directly impacts statewide residential occupancy – for both tenants and owners. Without a paycheck, few have the ability to rent an apartment or buy a house.
The financial basis for an individual’s creditworthiness, essential for most to lease a residence or obtain mortgage funds to buy a home, are:
- a paycheck;
- self-employed earnings from an established trade or business; or
- income flow from invested wealth – not one-time profits from assets sold and gone.
When jobholders buy a home today, their financial decision to buy real estate is influenced by:
- a down payment saved or available;
- an annual gross income in a household from all sources;
- the interest rate on a 30-year FRM, not an ARM;
- installment payments on all household debt;
- home purchase timing during the “buy phase” of the business cycle;
- operating costs of owning the home; and
- distance of home from employment and family services.
Of all the factors affecting our economy, employment trends throughout California’s population have the most impact on the vigor of the real estate market, whether during:
- good economic times;
- times of financial crisis; or
- an economic recession.
Demand for all types of real estate increases with a rise in the number of local jobs, as occurs during periods of economic development or boom. Additions to the local labor force tend to drive rents and prices up on properties in the vicinity when adequate new construction starts are restricted, typically by zoning. Job growth naturally results in local construction of homes, apartments and most types of commercial structures.
On the other hand, a decline in the number of local jobs reduces the need for all types of real estate, as occurs during a recession. Likewise, reductions in local employment lead to lower rents and prices paid by tenants and buyers for the occupancy and use of real estate, with rent for housing maintaining the most stability.
Whatever the current trend in the number of individuals employed in a region is, sets the direction for the:
- volume of rentals and sales transactions generating broker fees in the local real estate market; and
- movement of rents and prices paid by users of all types of real estate in the following months.
Other jobs issues affect the level of rents and prices paid for property, such as the:
- number of employed individuals;
- number of job openings available; and
- types of existing and developing jobs in the local market.
For instance, when a community relies heavily on the construction industry – such as the Inland Empire during the Millennium Boom – a change in construction employment directly impacts the local housing market. In the Inland Empire, the employment picture became particularly grim following the 2007 downfall of the construction industry, as it also did in the 1991 recession.
To get an idea of what type of job growth your community can expect in the coming years, here is a projection by California’s Employment Development Department on the percentage of growth to take place between 2023-2033:
Mining, Quarrying, and Oil and Gas Extraction -4.0% Construction 10.7% Manufacturing -0.2% Trade, transportation and utilities 2.8% Information 13.5% Financial activities 2.6% Professional and business services 11.9% Education and health services 18.4% Leisure and Hospitality 14.6% Other services 6.6% Government 3.8%
Quantity of employed individuals
Historically, jobs in California create homeowners and tenants on an approximately 50:50 basis. Roughly half of all households own the residence they occupy and the other half rent. This ratio became badly skewed during the Millennium Boom when the California homeownership rate increased to an unsustainable 61% for our otherwise highly mobile skilled population.
Our state’s homeownership rate has declined significantly since 2006. As of Q4 2025, the homeownership rate is 55.3%, right at our state’s stable equilibrium rate of 55% owner-occupancy before the Millennium Boom distortion.
The unemployment rate has no effect on the real estate market. The unemployed and underemployed are unable to rent or buy real estate without a poverty level reverse income tax arrangement. Most people first need a full-time job to do so.
Related article:
First nonresidential, then residential sets the trend
The loss of jobs has a ripple effect rolling into all types of real estate, not just housing. As employees are shed – jobs – the need for office space, commercial space and industrial space reduces by an equal or greater amount. Subleases, reduced rents and vacancies across all segments of California’s real estate economy are the direct results of job loss.
As nonresidential vacancies increase, single family residential (SFR) vacancies likewise soon increase.
California had 14.8 million housing units — owner occupied, rented or vacant — and 17.9 million individuals employed in 2024. Roughly equivalent to five dwelling units for every six individuals employed.
Thus, California has about five-sixths as many total residential units as people on payroll. More meaningfully, 55.3% of households in California own the home they live in as of Q4 2025. Most homeowners are employed.
With every ten jobs lost without finding new employment, five to six people on average will not be able to purchase a home or retain the home they own and occupy (unless they have cash reserves). The remainder are tenants who simply are not able to pay rent and will lose their current housing. Consolidation takes place quickly for all involved to cut the costs of shelter. The reverse occurs when payroll numbers increase.
Forecasting the local job market
While readers are fed national payroll data by the media or other pundits, they need to distinguish between what generally is taking place elsewhere and what specifically is happening to California jobs. Earnings from a job in Kansas do not benefit California real estate.
What happens in a commodity economy such as Texas, has little relationship to what happens in California, a state defined by its geography, not just a continental divide.
Jobs are further localized within California’s individual counties. San Francisco was the first county to regain (and quickly exceed) all jobs lost during the Great Recession including population gains since 2007. Other counties, particularly Los Angeles and Riverside, did not recover lost jobs until 2018 and 2019.
When constructing your own local jobs forecast, the types of jobs available significantly influence the job market’s rate of growth. This information is available from California’s Employment Development Department.
Through the fog of international trade chaos and hesitant buyers, look to 2028 and beyond for the next sustainable increase in home sales volume and prices. The world trade issues will likely remain in conflict throughout 2026. Tensions over anticipated job losses lead to reduced consumer spending and lower user turnover. When jobless owners are confronted with forced sales the lack of willing buyers and high mortgage rates eventually result in reduced prices.
The next recovery period will be buyer driven when they sense a bottom in prices has been reached and are on their way up again. Also, the shifting demographic trends of retiring Baby Boomers and their Millennial and Gen Z counterparts are scheduled to become homebuyers en masse after our current job’s recession ends.
Related articles:


My concern is twofold;
1) The Covid health impact on the ability to sustain a liveable standard can potentially result in a market where both the job and the labor workforce availability is compromised. In this case, the inability to gain employment, purchase a new home, or keep an existing mortgaged home out of foreclosure would eventually generate a glut of homes, with minimal clients suitably funded to purchase them.
2) With the exponential increase in US cases, hospital capacity being exceeded where they are unable to treat patients with Covid as well as other life threatening conditions, I think we are on the verge of a minor collapse of the economic status quo we have enjoyed.
In consideration of the above, We have decided to not currently invest in any real estate until more data is available to predict the full impact of the pandemic. and hope the Covid is benevolent enough not to mutate into a strain that the vaccine is ineffective on.
What is Jargons in share market?
There are some interesting time limits in this article but I don’t know if I see all of them heart to heart. There is some validity however I’ll take maintain opinion till I look into it further. Good article , thanks and we would like extra! Added to FeedBurner as properly
It is a fact that the real estate market is extremely complex and has a whole lot of factors ( not just jobs) that cause it to move up and down.
I have observed that First Tuesday keeps posting articles about the real estate market that just don’t tell the whole picture and so are invalid and not accurate in the point they are trying to make in that article. ( which is their attempt to attribute some one factor, or another, as the prime cause of real estate market moving up or down.
Come on First Tuesday there is a whole lot more involved in the real estate market than your constant over simplifications. that
Then why do you keep reading?
To be honest, I did not read the whole article, but anyone who tells you this cycle will be so many years, or whatever else is living in the past.
I cannot believe how many times I was told this or that by qualified, or non qualified individuals. I would take many of them seriously, do my own due diligence before the internet could accumulate such details and found that over a life-time the only money you should gamble with is Personal Excess Cash and how many of us working stiffs have that and not Loaned Funds for a home or business.
Of course we all need a reasonable place to live, preferably something we have some equity in, but anything else is gambling, and in many cases we have to retain funds for the unexpected, both pleasant and un-pleasant.
It is a difficult tight rope walk and not everyone will make it to the other end.
Quite simply, I have survived under my own steam engine, having to repair it along the way, but being born with average intelligence, ambition, guts, etc. would have been so much easier if I was born into a filthy rich family, or am I testing fate the next time around.
Do not let the “fundamental” factors affect your investments!!!
Just do market timing! Aka buy at the bottom and sell at the top!
Same cycle since WW2! 7-12 years up and 7-12 years down!
Each peak is double the past peak & each bottom is double the past bottom!
AKA I sold 198 properties from 2000-2007! Gross profit each 1167% IRR net net net 27.12%/month for all 198 escrows! PS: 4 semesters of calculus helped me understand & take advantage of the markets.
What you’re referring to is the classic 14 year RE cycle (6% annual appreciation) which would have peaked in 2007, bottomed out in 2012-2014, and will most likely peak again in 2020, 2021 respectively.
Not sure why you’d have to take 4 sems of Calc to figure out this basic axiom.
Not all counties are included in statewide income chart
I like first tuesday for their testing, I can send in my test & know it’s going to be handled correctly. I ‘am ready for my broker test, but I need some money to pay for the books & test! so i think i’m going to try reebrokers, but I do wish to hear from you on the business? I have so many questions about the pay-out of my commission, is it mailed, or placed in my account? what about escrow? who is the broker? or Brokers?