
Why this matters: Readily available data helps real estate licensees build their practice, better advise their clients and provide clients with reasons for making decisions. Today’s deeply-rooted uncertainty throughout the real estate market for all factors contributing to property value is only resolved by data about the behavior of members of our consuming public.
Already-high interest rates stay high
The rate on an average 30-year fixed rate mortgage (FRM) dipped lower to 6.77% in the week ending June 27, 2025. The average 15-year FRM receded to 5.89%. For those able to switch, the 15-yr FRM is one-eighth less expensive than the 30-yr FRM — though principal is more quickly amortized in larger monthly payments.
Watch for FRM rates to generally work their way lower in 2025 as the Fed completes its job to fully stabilize consumer inflation (and job growth). The Fed task for setting short-term interest rates is complicated by residual disruption from the pandemic and current government administrated trade and migratory labor distortions. The latter issues are beginning to ripple through the wholesale end of the economy and manifest at the consumer end by increased personal savings and less spending.
Whatever FRM rate movement we get in 2025-2026, expect a long-term upward trend in mortgage rates to follow, a trend which began in 2013 by the onset of a half-cycle with some 30 years of rising rates on all borrowing.
That said, current government interference with the economy is spilling over into real estate, adversely affecting mortgage rates, costs of construction and the occupant turnover rate. Collectively, these real estate pricing conditions are producing an industry-wide reduction of fee related transactions in 2025. Bond investors may well have cause to drive 10-year T-Notes either further up or down, as recently observed, as uncertainty about the future causes property sales and leasing activity to slow further.
An increase in income tax revenues — or Federal Reserve bond buying — is now needed to offset government demand for cash, without which long-term rates will generally increase (and in turn mortgage rates). Further, privatizing quasi-government mortgage agencies will increase a lender’s risk of loss (socialized by government mortgage guarantees) while enhancing lender profit sharing which also causes mortgage rates to stay high. Remember the rule: All financial deregulation goes up in flames. Our last reminder was 2005.
Buyers increasingly stay away, for now
In the long term, property prices as we experience today are adversely affected by higher FRM and ARM rates, and more generally for income property by increased capitalization rates since 2013. Property pricing is primarily supported by the amount a buyer can borrow to fund a purchase and further tempered by rent the property can generate.
Thus, annual increases in FRM rates, as experienced since 2013, force sellers to eventually drop prices or exit the for-sale market when for-sale inventories rise. An exception is the annual spring bounce, which has weakened annually beginning mid-2022. The eventual decline in job numbers without immigration will force a further drop in property pricing.
As for homebuyers dependent on purchase-money mortgage funding, they either:
- reduce their standard of living or adjust their investment goals and acquire property in a lower price tier, or,
- wait for the drop in property prices until pricing matches reduced buyer purchasing power due to high mortgage rates, the more likely situation now that the consuming public has turned cautious.
Buyers increasingly sense current economic conditions are incompatible with the double whammy of purchasing an over-priced property with mortgage funding at high FRM rates. The result is buyers increasingly heading for the sidelines — ready and able, but not willing to buy or borrow. The 2021 fear of missing out (FOMO) has fully exhausted its psychic run.
However, low-down-payment buyers and their agents who are patient and stay involved will discover financial and market conditions for property acquisition greatly improved, likely by 2028.
In the meanwhile, watch for a recession window period of for-sale inventory growth, price cuts by sellers forced to unload property, slightly lower mortgage rates to fund acquisitions, and greater buyer reluctance until a bottom level in property pricing is well established.

Fundamentally, FRM rates are tied to the 10-year Treasury note market, as are capitalization (cap) rates for setting income property prices. The 30-year FRM rate moves in tandem with the 10-year Treasury note rate, plus the lender’s risk premium of between 1.5% and 3.0%, based on a perceived risk of loss on default. Historically, the risk premium spread between the 10-year T-Note rate and the 30-year FRM rate in normal times is 1.5%. The spread is far greater for property investor cap rates.
However, the 10-year T-Note sunk to 4.27% on June 27, 2025 tracking a decline in rationale investment opportunities. Now enlarging, the spread between the 10-year T-Note and 30-year FRM rate is 2.50%, above the historical risk premium spread of 1.5%. Today’s mortgage lenders are in no hurry to reduce their risk of loss premium in an effort to increase mortgage originations to maintain profitable levels of operations.

The average monthly rate on adjustable rate mortgages (ARMs) is less steady, contracting to 6.08% on June 27, 2025 after briefly spiking to 6.88% in December 2024 following a summerlong trough.
The interest rate on the ARM is higher than the 15-year FRM and 69 percentage points lower than the 30-year FRM rate. The 30-year ARM-to-FRM spread gives a homebuyer or owner a bump in the amount they can borrow by taking out an ARM. The downside is the significant forward risks of loss-by-foreclosure inherent in ARMs. Of course, an ARM is the mortgage available to finance high-tier housing and commercial property.
The following was updated June 27, 2025.
Click the link to go directly to a chart, or browse the charts by scrolling below.
1. 30-year fixed rate mortgage (FRM) rate, weekly— Chart update 6/27/2025
2. 30-year FRM rate, monthly — Chart update 6/6/2025
3. 15-year FRM rate — Chart update 6/27/2025
4. 5/1 adjustable rate mortgage (ARM) rate, monthly — Chart update 6/20/2025
5. 10-year Treasury note rate — Chart update 6/27/2025
6. Combined FRM and 10-year Treasury note rates — Chart update 6/6/2025
7. 91-day Treasury bill rate — Chart update 6/27/2025
8. 3-month Treasury bill — Chart update 6/6/2025
9. 6-month Treasury bill — Chart update 6/6/2025
10. Treasury Securities average yield (CMT) — Chart update 6/6/2025
11. 12-month Treasury average — Chart update 6/6/2025
12. Secured Overnight Financing Rate (SOFR) — Chart update 6/27/2025
13. Applicable federal rates — Chart update 5/2/2025
 | ||
| Chart update 6/27/25 | ||
Current | Month ago 5/29/25 6.83% | Year ago 6/28/24 6.86% |
The average 30-year FRM rate in California is provided by the St. Louis Federal Reserve Bank.
| ||
 | ||
| Chart update 6/6/25 | ||
May 2025 Average 6.8% | April 2025 Average 6.73% | May 2024 Average 7.06% |
 | ||
| Chart update 6/27/25 | ||
Current 6/26/25 5.89% | Month ago 5/29/25 6.03% | Year ago 6/28/24 6.16% |
The average 15-year FRM rate in California is provided by the St. Louis Federal Reserve Bank.
| ||
 | ||
| Chart update 6/6/25 | ||
May 2025 6.20% | April 2025 6.07% | May 2024 7.34% |
The 5/1 average adjustable rate mortgage (ARM) rate shows the average rate for the first five years after origination. After the initial five-year period, the ARM rate is adjusted annually based on an index figure, such as a certain Treasury Bill rate (which reflects Federal Reserve rate movements) or the Secure Overnight Financing Rate (SOFR). The average ARM rate is provided by Freddie Mac’s survey of the U.S. | ||
 | ||
| Chart update 6/27/25 | ||
Current 6/27/25 4.27% | Month ago 5/30/25 4.41% | Year ago 6/28/24 4.35% |
This rate is a leading indicator of the direction of future Freddie Mac rates. The 10-year rate historically runs closer to 4% during a stable money market. The rate is influenced by worldwide demand for the dollar and anticipated future domestic inflation. | ||
 | ||
| Chart update 6/6/25 | ||
Avg 15-year May 2025 5.95% | Avg 30-year May 2025 6.82% | Avg 10-year T-Note May 2025 4.41% |
The average 15- and 30-year conventional commitment rates are the rates at which a lender commits to lend mortgage money in the United States-West/California for the duration of the life of each respective mortgage as reported by Freddie Mac. The green line reflects the 10-year Treasury Note Average, a leading indicator of the direction of future Freddie Mac rates. It is composed of the level of worldwide demand for the dollar and anticipated future domestic inflation.
| ||
 | ||
| Chart update 6/27/25 | ||
Current 6/27/25 4.30% | Month Ago 5/30/25 4.36% | Year Ago 6/28/24 5.38% |
This rate determines the minimum interest rate the seller must use in a delayed §1031 transaction and report when not receiving interest on §1031 monies held by a facilitator/accommodator. This rate also sets the amount of the ordinary income the facilitator/accommodator must report. | ||
 | ||
| Chart update 6/6/25 | ||
May 2025 4.25% | April 2025 4.21% | May 2024 5.25% |
The 3-Month Treasury Bill rate is heavily influenced by the Federal Reserve through the Fed Funds Rate as the base price of borrowing money in the short-term. It is used in determining the 3-month:10-year yield spread used to predict the likelihood of a recession one year forward. The posted rate is the monthly average for the listed month. Rates are released with a 1-2 month reporting delay.
| ||
 | ||
| Chart update 6/6/25 | ||
May 2025 4.13% | April 2025 4.05% | May 2024 5.17% |
The six-month T-Bill rate is one of several indices used by lenders to periodically adjust the adjustable rate mortgage (ARM) rate. The adjusted rate equals the indexed rate (at the time of adjustment or an average of several prior rates) plus the lender’s profit margin. The posted rate is the monthly average for the listed month. Rates are released with a 1-2 month reporting delay. | ||
 | ||
| Chart update 6/6/25 | ||
May 2025 4.09% | April 2025 3.95% | May 2024 5.16% |
This index is one of several indexes used by lenders as stated in their ARM note to periodically adjust the note’s interest rate. The ARM interest rate equals T-Bill yield, plus the lender’s profit margin. The index is an average of T-Bill yields with maturities adjusted to one year. | ||
 | ||
| Chart update 6/6/25 | ||
Current May 2025 4.31% | Month ago April 2025 4.45% | Year ago May 2024 5.17% |
This index is one of several indices used by lenders as stated in their ARM note to periodically adjust the note’s interest rate. This figure is an average of the one-year T-Bill rates for the past 12 months. The ARM interest rate equals the 12-Month Treasury Average yield plus the lender’s profit margin. There is a one-to-two month lag in data reporting for the 12-Month Treasury Average. | ||
 | ||
| Chart update 6/27/25 | ||
Current 6/26/25 4.40% | Month ago 5/29/25 4.33% | Year ago 6/28/24 5.34% |
This index is one of several indices used by lenders as stated in their ARM note to periodically adjust the note’s interest rate. It replaced the LIBOR in 2021, which was found to be manipulated in the years leading up to the 2008 recession and financial crisis. The ARM interest rate equals the SOFR rate plus the lender’s profit margin. The rate is based on overnight borrowing in the U.S. Treasury repo market. The SOFR is produced in a transparent manner and is based on observable transactions, rather than models, and, unlike the LIBOR, is not dependent on bank estimates. | ||
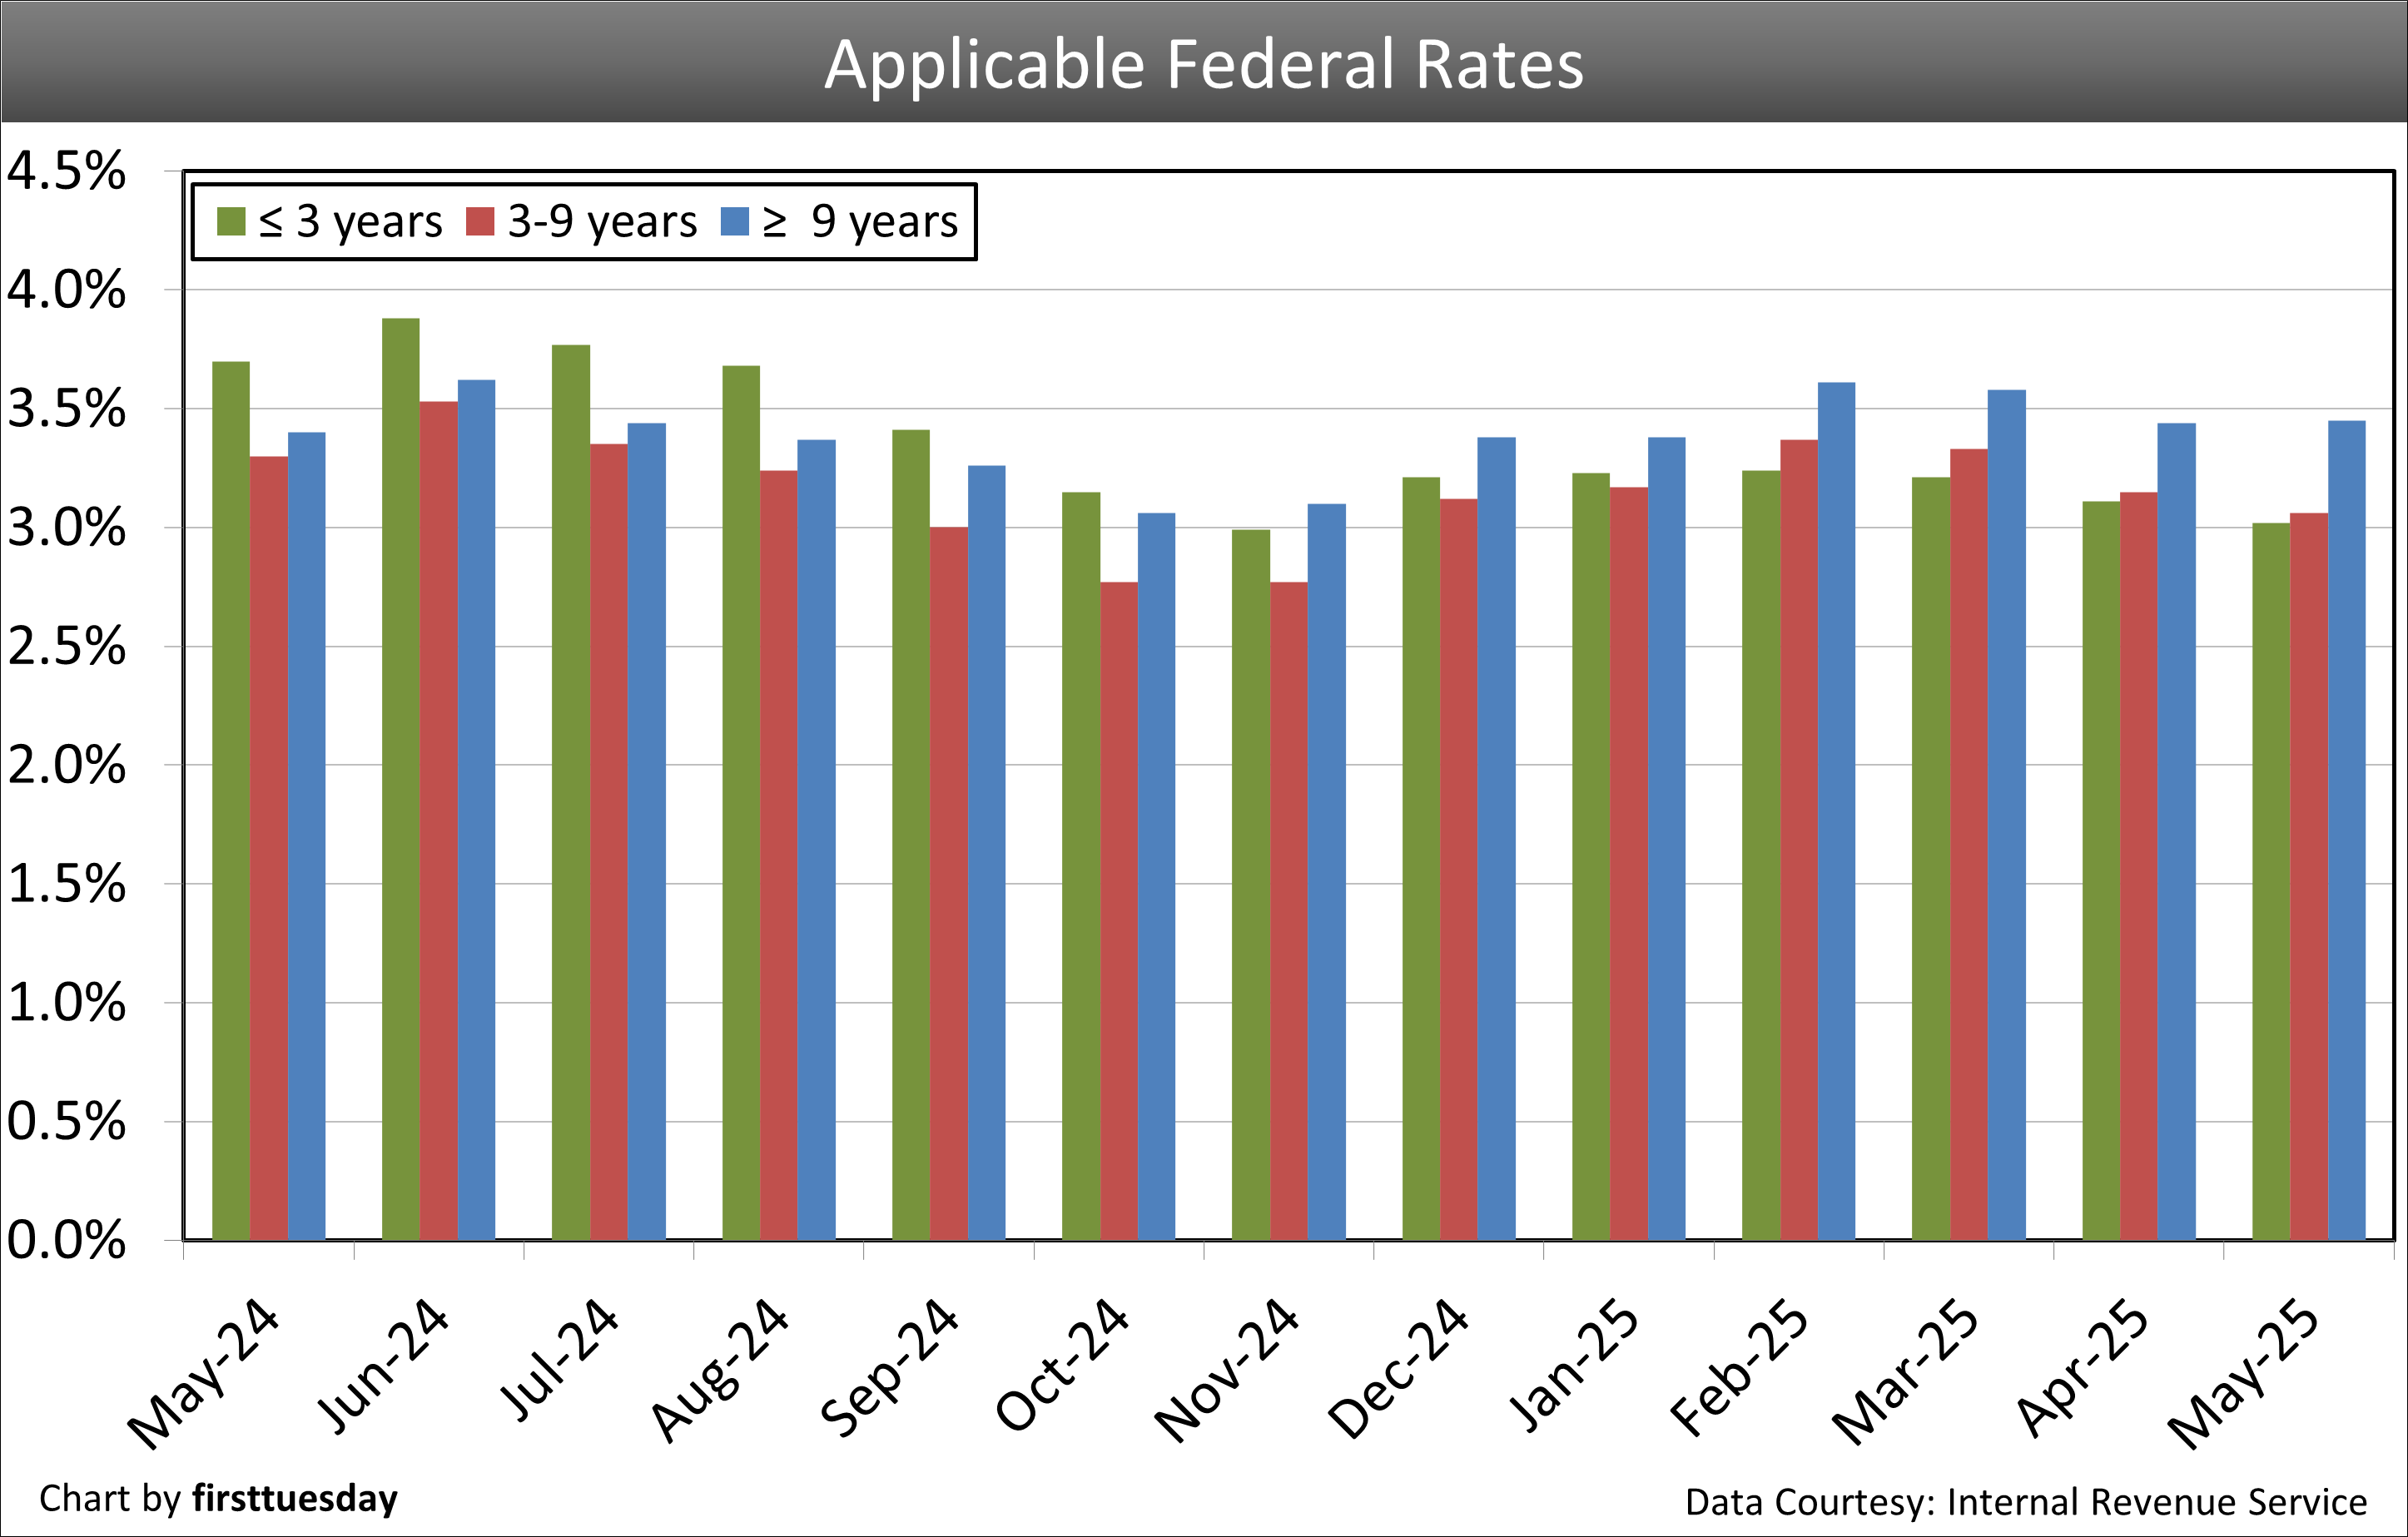 | ||
| Chart update 5/2/25 | ||
Short (3 years or less) May 2025 3.02% | Medium (3 to 9 years) May 2025 3.06% | Long (9+ years) May 2025 3.45% |
These rates determine minimum interest yield reportable on carryback financing. The applicable federal rate (AFR) category is determined by the carryback due date. Rates are for monthly payments, reported for the coming month.
| ||


Lots of charts and graphs with little meaning beyond that rates are and have been historically low . They provide Zero proof that a recession is imminent. Even the time frame is incorrect for predictive analysis. News Flash: CA is not the canary in the coal mine for the US Economy. Your problems there are unique to CA and how it has been mismanaged for decades.
Interest rates will remain relatively low for MANY years to come. The United States has such a large amount of debt that a significant increase in interest rates would leave the US government unable to make the payments on our debt. Defaulting on the deficit is not an option. Therefore rates will remain low.
Jeff Gundlach (the new bond king) says otherwise. IMO we will see 6% rates on 30yr mortgages in the next few years. The national economy is spiking now since money is still cheap to borrow but rates ARE going up so it makes sense to do some things now with cheaper money. Overbuilding due to speculation is a constant theme in our economy and recessions do happen. IMO mid 2019 will be the start of our next recession and the question is how shallow or severe it will be. To soon to tell due to to many factors, trade war, election results, foreign entities buying USA debt (or not).
Thank you. I love this article. Complex issues presented with clarity..
This is an awesome site with great information…
KISS – Keep it Simple & Stupid. Before, I sell almost everything: pots & pans, Insurance: property & Casualty; life & disability. All kinds of licenses; broker & agent licenses, even dog’s & cat’s license, I let them expired. Are we trying to be expert on extraneous matters of limited application; or to concentrate on practical & substantive issues of social engineering, better understanding, & dedicated service to clients? Let computer-brain-knowledge be ready for, far & between instant use, when needed. But, emphasis should be on KISS. After all, we are only salesmen; although, treated as professionals.
Very useful and concise information. It really tells the story very well.
I’ll have to admit the information overload is a factor in understanding, however it is good to know that First Tuesday continues to track these indices. Each chart references a brief explanation of its meaning. With continued support like this, outside of the Lending Industry interpretations, I’m starting to catch-on. First Tuesday,
you rock!