

Why this matters: With buyers watching on the sidelines for real estate prices and mortgage rates to drop, the balance between static home pricing, inflation (COLA) and real adjustments in income has tipped in favor of the buyer. How potential homebuyers — as clients — feel about the future economic outlook determines their willingness to jump into homeownership as a long-term store of wealth.
Per capita income outruns the daily cost of living
Home prices in 2025 are flat. Specifically, they are almost 0.5% higher in low-tier sales than a year earlier, as of December 2025. This leveling off in California’s largest metro areas shows buyers are willing to outwait sellers’ reluctance to give up yesterday’s high price expectations. Meanwhile, the income of buyers is rising faster than our high inflation rate.
The chart below shows the average per capita income in California alongside the rate of consumer inflation.
Chart 1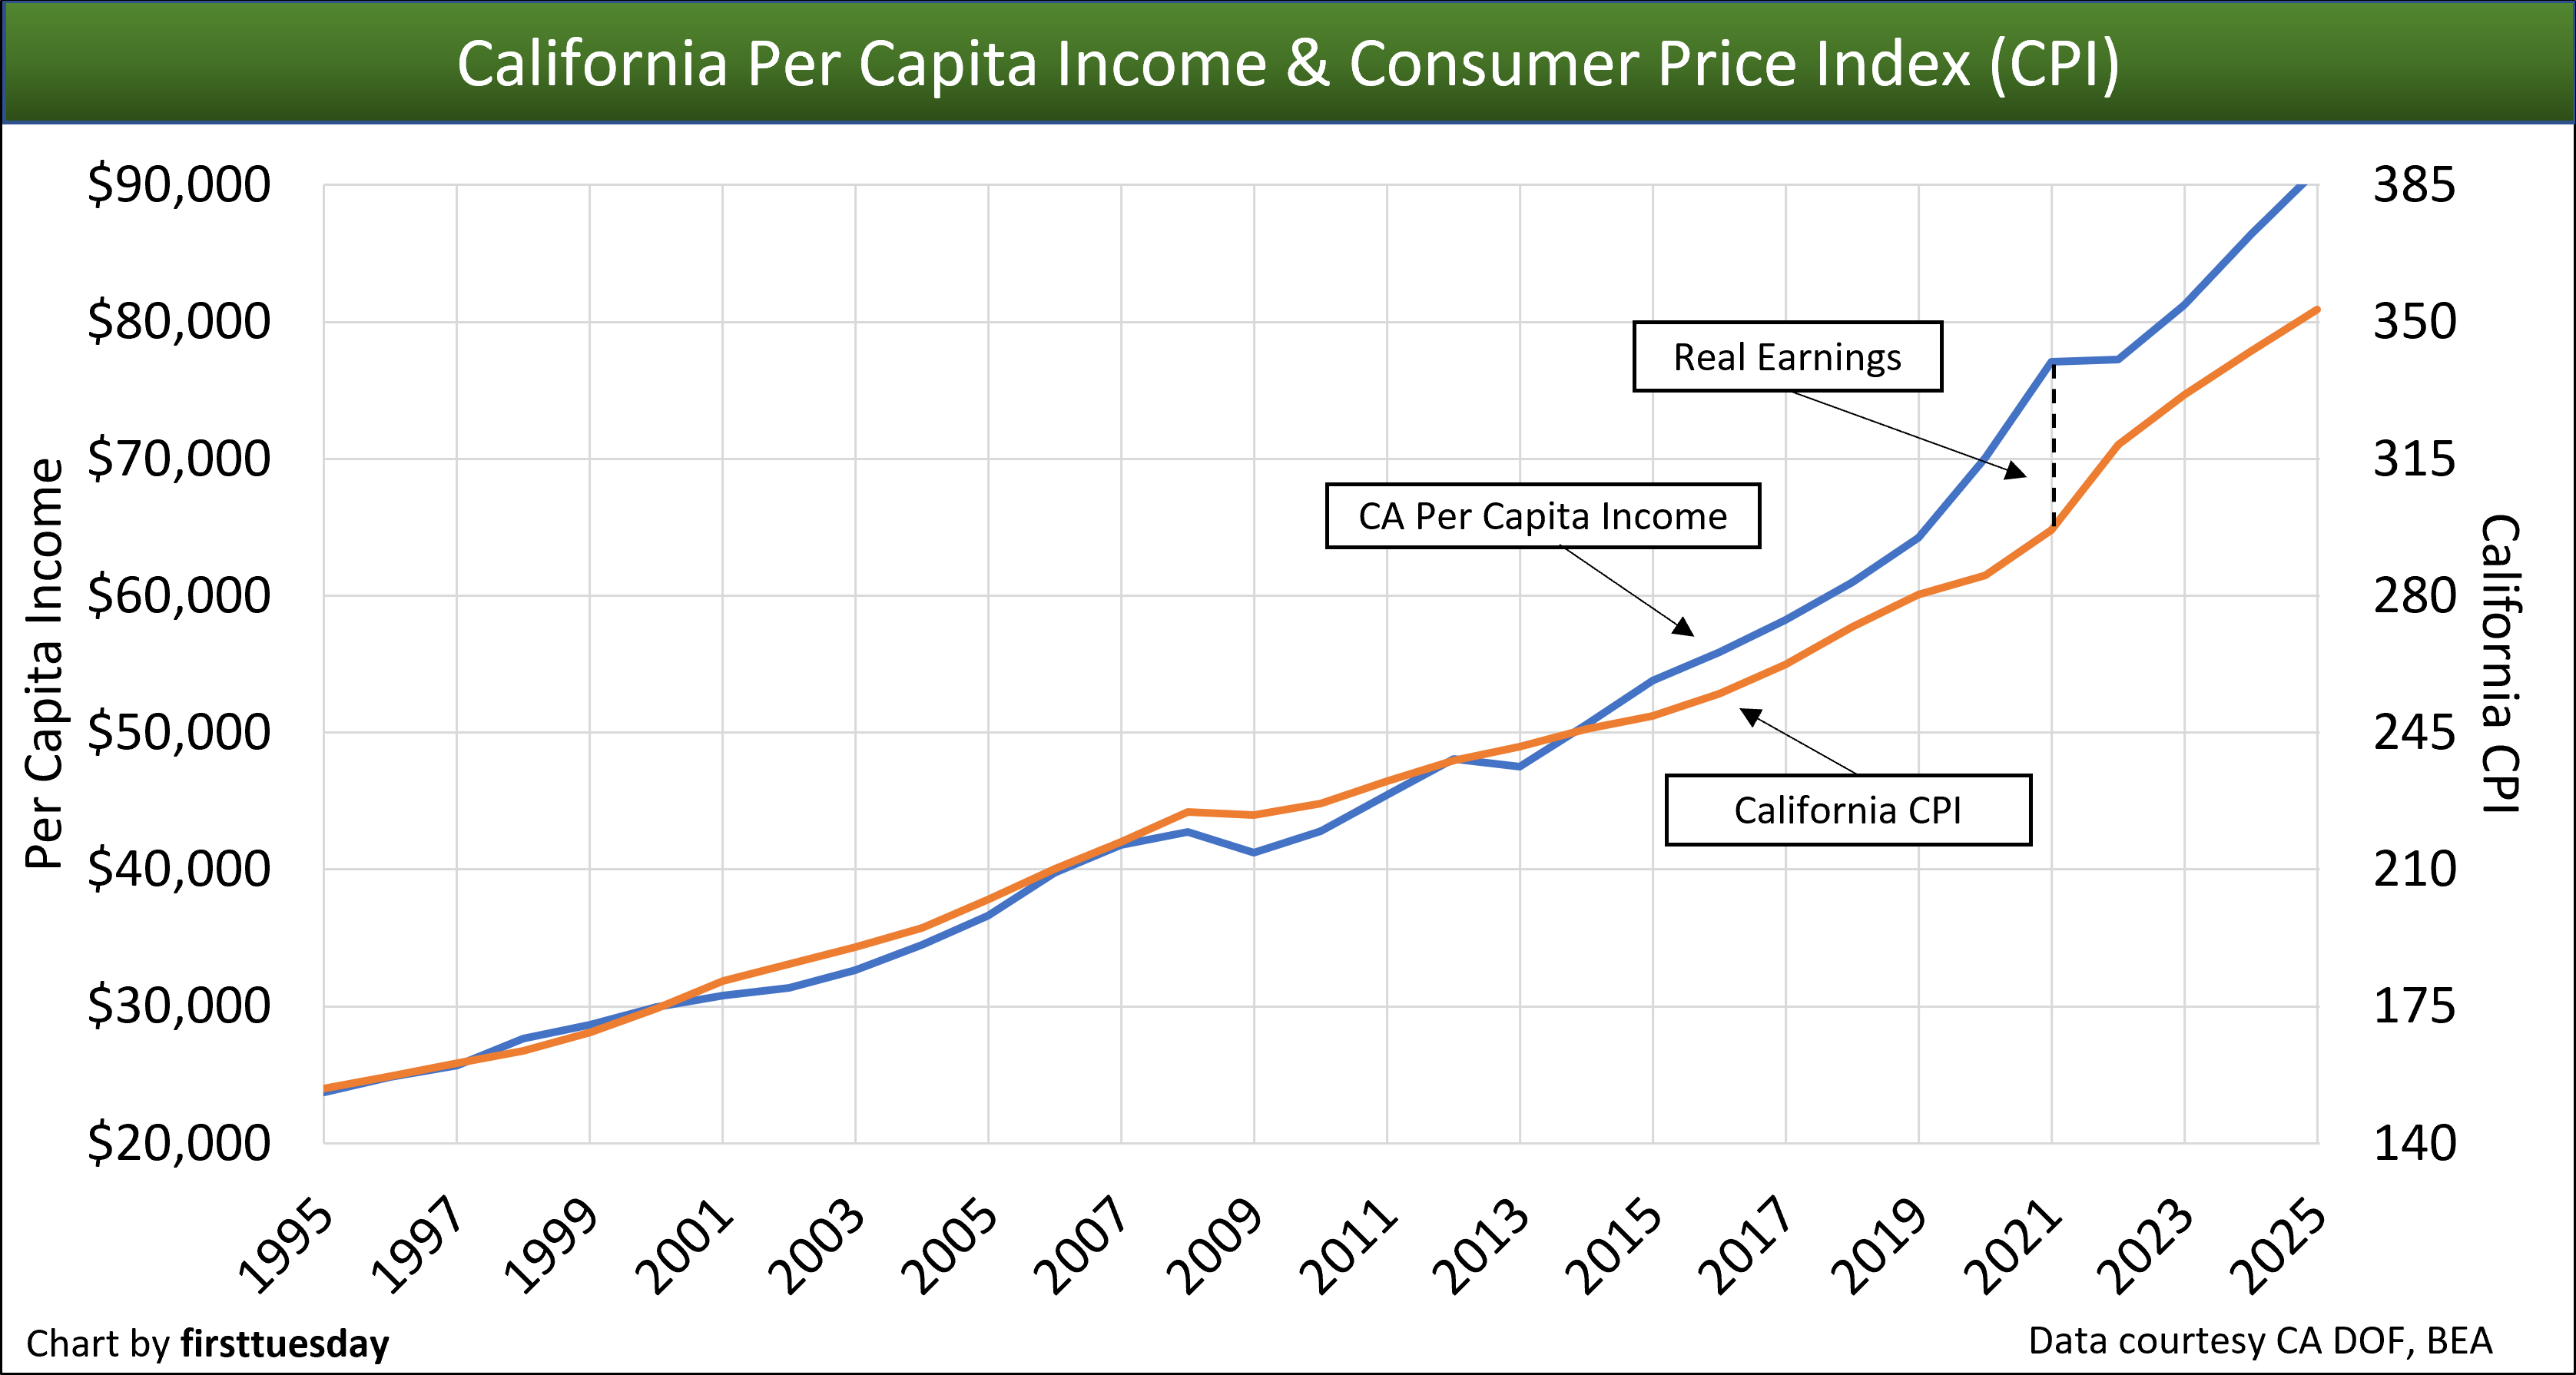
Chart update 9/8/26
| 2025 | 2024 | 2023 | |
| CA Per Capita Income | $91,100 | $86,400 | $81,200 |
| CA Consumer Price Index (CPI) | 353.21 | 342.51 | 331.31 |
Editor’s note — CPI is California’s weighted average.
As seen in the chart, per capita income and the Consumer Price Index (CPI) increased at a similar rate through the 90’s and 2000’s until 2014. Income on its own looks like it has doubled in the past twenty years, though it hasn’t gone very far at all. Most of the increase in income was spent paying for basic necessities at increased prices — inflation’s annual bite of the dollar earned.
Overall, the changes show very good news. As the space between the two lines increases, income begins to grow and purchasing power exceeds what inflation devalues. Average incomes have seen an increasingly steeper rise over the rate of inflation during the years since 2014 rather than merely matching the rate of inflation as in prior years.
Here’s how California income has changed, after accounting for CPI.
Real incomes (as opposed to nominal incomes which are not adjusted for inflation) rose fairly quickly from 1995 to 2000, increasing 11%. But between 2000 and 2010 (double the amount of time) real income only increased 10% when adjusting for inflation while nominal incomes jumped from $29,900 a year to $42,800 a year. The dollar figure on the paycheck went up 70%, but the real buying power only shows a modest 10% growth.
However, incomes since 2015 rose measurably faster than the rate of inflation. In the ten years from 2015 to 2024, real incomes rose 17%.
Comparing the pre-pandemic year of 2019 to 2025, the pace of increasing buying power continued with real income growing a bit faster at 13% over the six years. Adjusted for inflation the average 2019 income-earner in California went from earning $80,900 (in 2025 dollars) to earning $91,100 in 2025.
Now, let’s compare this real income growth to the change in home prices over the same period. Real home prices adjusted for consumer inflation have risen much faster. Real prices in low tier homes were almost 110% higher at the end of 2025 than they were at the beginning of 2015. Disastrously, real earnings used to pay rent or mortgage payments were only 19% higher over the same period.
To further demonstrate that home prices are so far beyond the reach of most potential buyer-occupants, consider the fact that it took California over six years to regain all jobs lost due to the 2008 recession. The faster recovery from the far greater 2020-2021 pandemic job losses took only until October 2022. The different results were the product of fiscal and monetary policies of their time.
But with jobs numbers in California peaking in November 2025, coasting down throughout 2026, continued job losses are expected due to uncertain business conditions, trade and military wars, and federal attacks on necessary immigration.
Looking forward
In California, educational attainment continues to increase — a good sign for higher average incomes exceeding the rate of inflation going forward.
With the buyer’s market moving into full view, the growth in for-sale inventory continues to pressure sellers to reduce their asking price and accept the change in the outlook since the pandemic-era buying spree.
Buyers who wait to enter the market until they see a trough emerge in real estate prices or start to rise again, will find their buying power reaches even further to include more amenities.
Still, while home prices are unlikely to plunge back to pre-Millennium Boom levels or watch average wages rise substantially before 2030, high- and mid-tier priced properties will be largely overlooked since most homebuyers’ focus will turn to any available low-tier priced housing. Families can only buy homes they qualified to afford (particularly with the 2010 re-regulation of lenders by mortgage origination rules).
It is worth observing that property prices peaked in early 2022 and have remained flat in nominal dollar amounts for the past 30 months while wages increased beyond the annual rate of 4% inflation.
Thus, as property values have not recently increased and are most certainly going to remain flat to down for the balance of this decade, buyers are fast gaining purchase power with wage increases while home prices have not moved upward.












There was a book published over 60 years ago:” How to Lie With Statistics” Darrell Huff. It called attention to how graphs can be made misleading by the scales used. The last two graphs are a perfect example.
The slope of both graphs for the last 8 years seems similar, but when you look to the scale to the left one has over a 400% range and one graph less than 100%
The two graphs should have been combined for a true picture.