
Why this matters: Real estate professionals need to understand the principles of market forecasting and know how to use available data to guide their practice and advise clients on transactions during different phases of the business cycle — especially when global influences create uncertainty in California’s real estate market.
Know how your market evolves
The yield spread is a tool you use to form an opinion forecasting the likelihood of a recession one year forward. The yield spread is a figure representing the percentage point difference between interest rates in two bond market tiers:
- short-term interest rate controlled by the Federal Reserve (the Fed); and
- long-term interest rate on the 10-year Treasury note, determined by bond market participants worldwide.
The yield spread figure ran negative in most of 2024, indicating a coming recession likely in 2026. However, the trade wars of early 2025 caused investor attitude about investment opportunities to change course, reflected in the volatility of the 10-year T-Note rate. The mortgage rate for an FRM is set on the 10-year T-Note plus a risk premium margin of between 1.5% and 3%.
The yield spread figure became zero before gradually increasing, averaging +0.64 in January 2026.
2024’s profoundly negative yield spread was near its lowest level since 1981, when the Fed was waging its last acute battle against inflation and the economy was tilting into a deep recession.
Today’s slightly positive yield spread under 1.0 is the result of:
- buoyed expectations as lower-than-expected tariffs rippled through to consumer pricing;
- the current static position of short-term interest rates directly influenced by the Fed for fear of rising consumer inflation and excessive job growth; and
- fluctuating long-term rates heading lower as bond market investors see fewer safe alternative investment opportunities.
The Fed will continue the slow decrease in 3-month rates, while keeping an eye on the effect deceases have on consumer inflation. Only when the Fed senses inflation is again under long-term control will they lower their rate, a likely 2026 event, to match economic conditions of a one-off jump in consumer price inflation passing through from the government’s trade wars.
Meanwhile, property markets are nearly 45 months into their own recession due to:
- a decade plus of increasing FRM rates since 2013 (except for the “one-off” pandemic stimulus);
- a strangled MLS inventory for lack of SFR owner turnover and construction; and
- the unrelenting cooling of the property market after mid-2022.
Updated February 5, 2026.
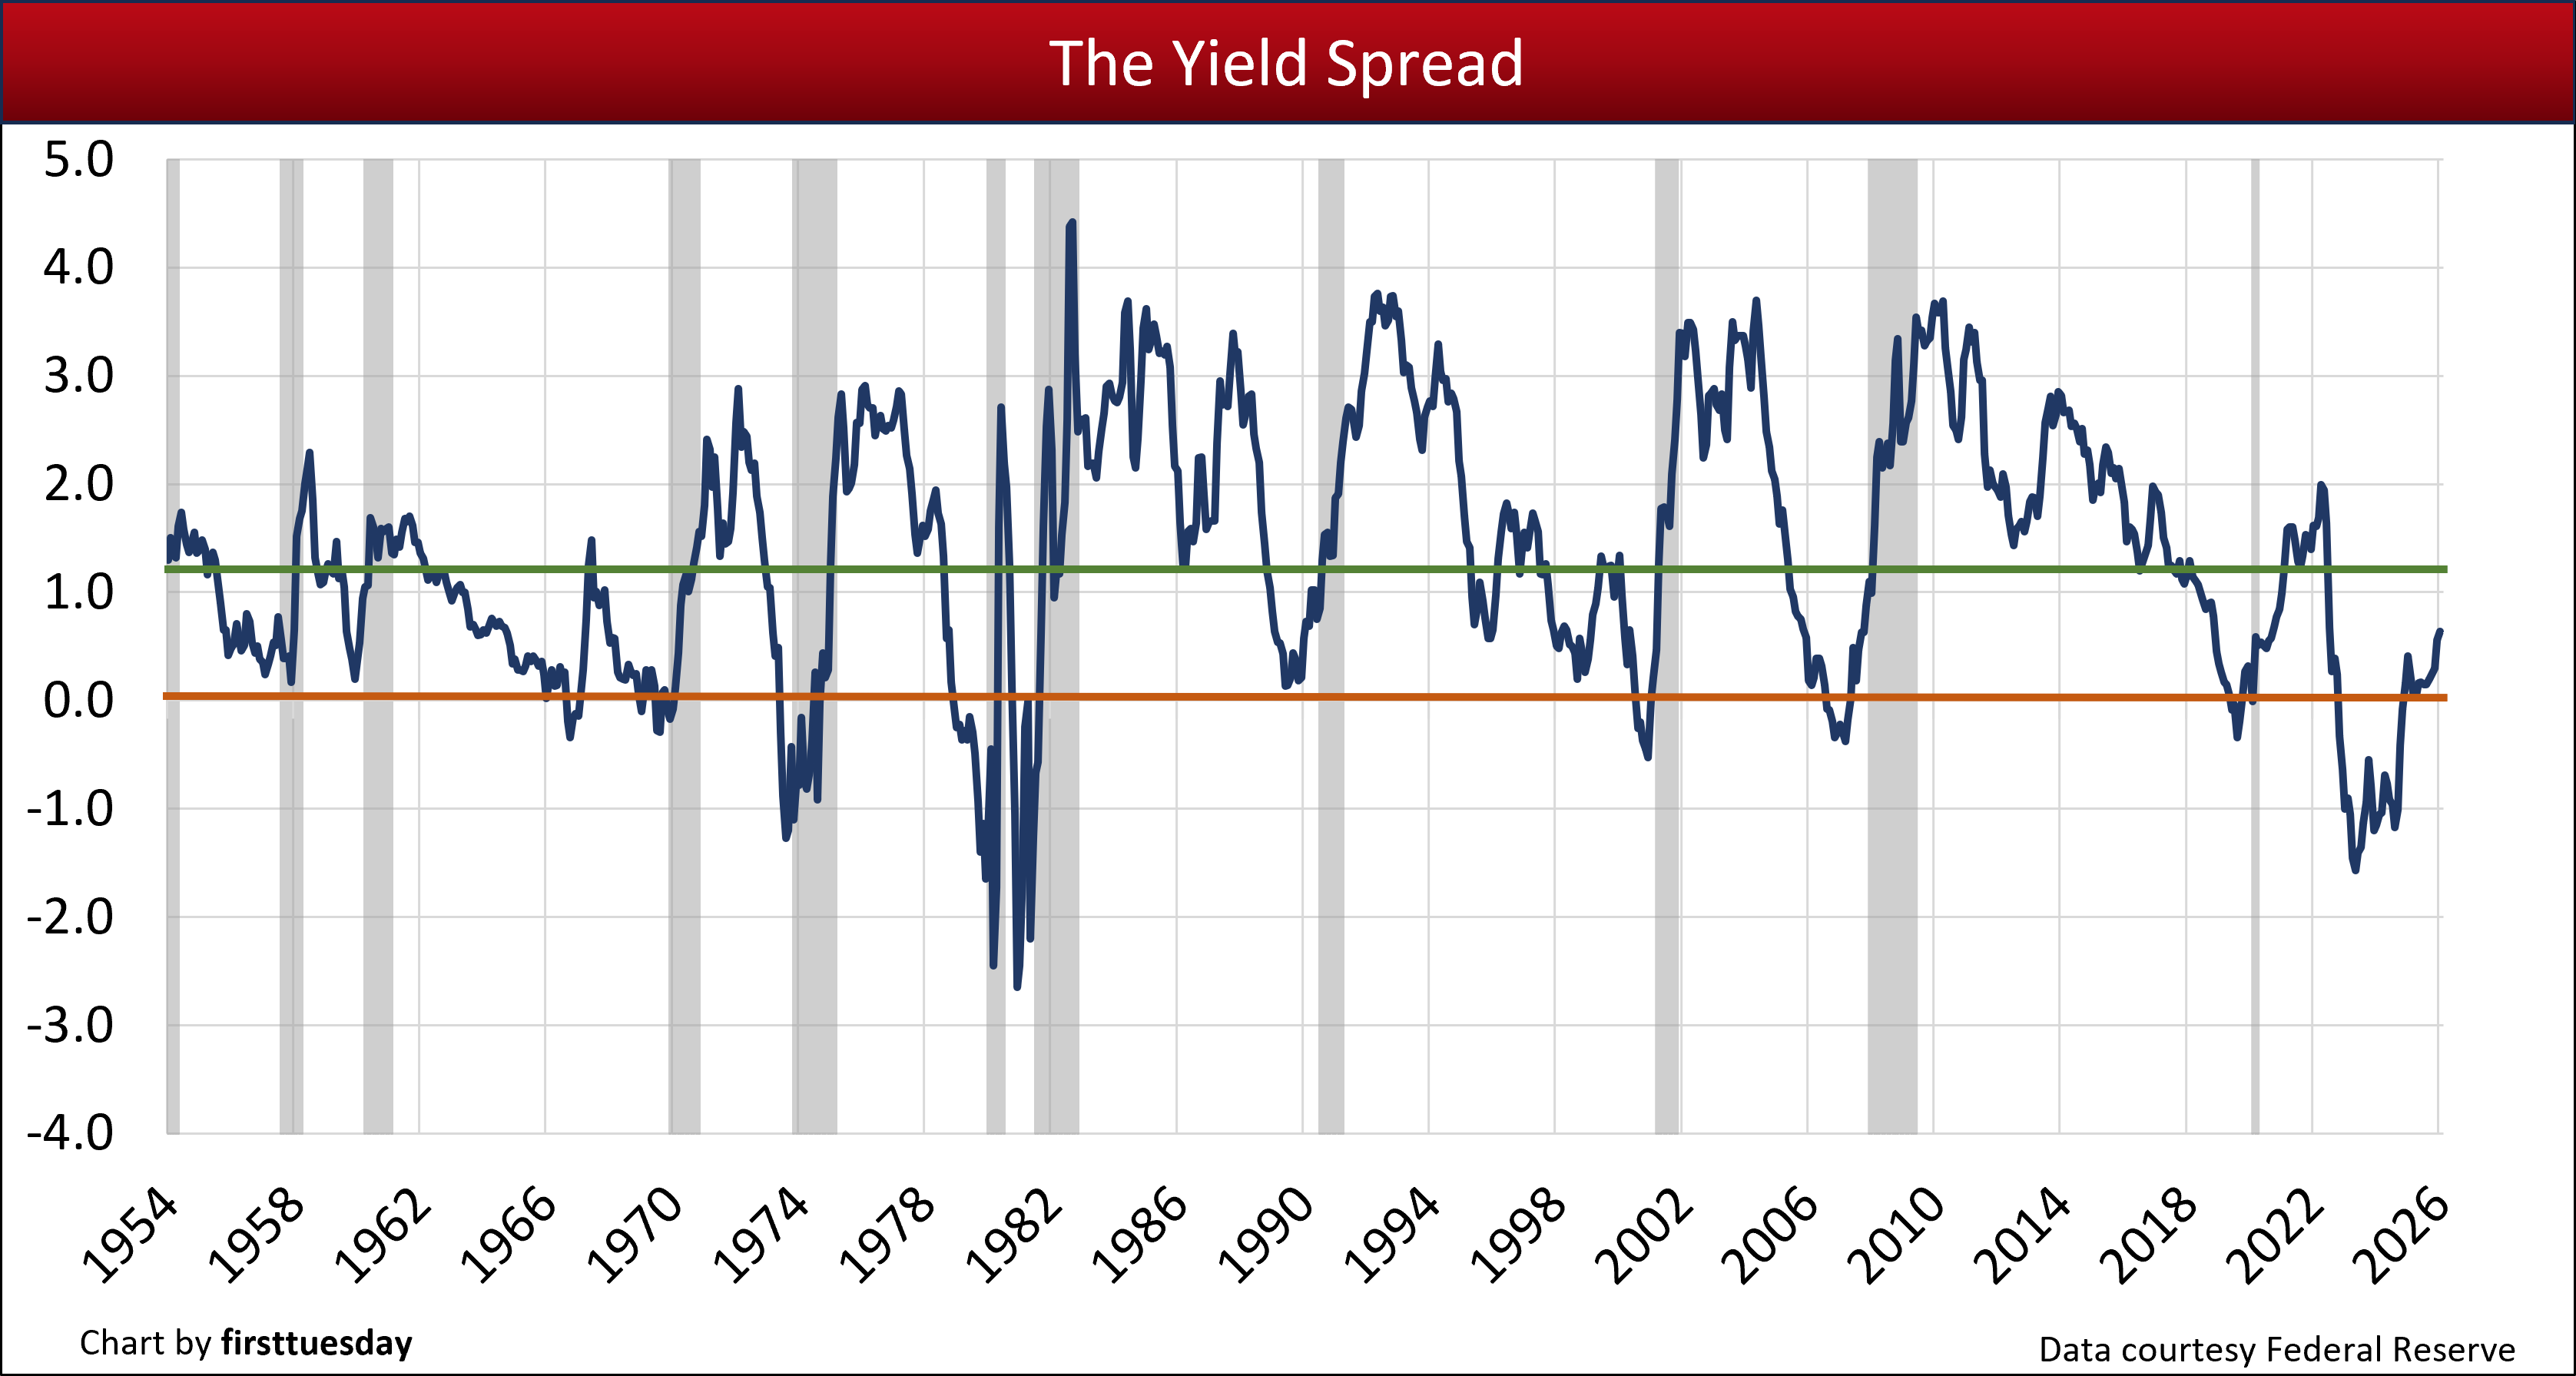
Chart update 2/5/26
| January 2025 | December 2025 | January 2025 | |
| Yield Spread | +0.64 | +0.56 | +0.41 |
Reading the chart and current trends
In the above chart:
- The blue line tracks the yield spread from January 1954 through today.
- The yield spread dips below zero when the short-term rate rises above the long-term rate. This is the inversion point.
- +1.21 is the point at which the probability of recession begins, as calculated by Fed economists. Yield spreads smaller than 1.21% predict successively greater probabilities of recessions one year forward.
The last time the yield spread was negative was in mid-2019, signaling the coming 2020 recession which was declared in February 2020. However, in March 2020, the covid pandemic crashed the economy, leaving income from jobs and business decimated. Massive stimulus and general economic disruption rippled for three years up to 2024 before mostly disappearing.
Each time since 1960 when the yield spread went negative we were in a recession approximately 12 months later.
Going through 2025 we did not get the recession the yield curve indicated for this year, but something else.
It is likely we will soon see a rapid decline in jobs as business that held off passing the tariff taxes onto their customers now increase prices of goods sold domestically. Thus, incomes and standards of living, as well as a jump in the level of insolvency of households and businesses, are affected when job numbers decline.
Confidence about what the year will bring
To you stalwart members of the real estate profession, a gift: the ability to forecast the probability of future recessions and rebounds, one year forward. This famed and reliable crystal ball is the yield curve spread, also simply called the yield spread.
Don’t let the name yield spread put you off. It is not related to the deceptive yield spread premium (YSP) kickback mortgage lenders paid in times before the MLOs.
The yield spread reflects economic conditions as interpreted by Fed economists and bond market investors.
The spread figure is generated, on the one hand, by the Fed using its short-term rate to combat unacceptable inflation in consumer prices and wages; and on the other, by the collective wisdom of global investors who set the 10-year Treasury Note rate based on long-term inflation expectations—two diametrically opposed economic perspectives.
To use the yield spread, all the layperson has to do is locate the current yield spread figure and apply their understanding about what the figure relays about the future.
That knowledge is provided to you in this article.
Again, the yield spread figure is the difference between two key interest rates:
- 3-month Treasury bill rate (or short-term rate) set by the Federal Reserve (the Fed) activity; and
- 10-year Treasury note (T-Note) rate (or long-term rate) set by bond market investor outlook.
Related chart:
The short-term market rate
The initial piece of information needed to calculate the yield spread is the interest rate on the 3-month Treasury bill. This interest rate is influenced exclusively by the Fed as the base price of short-term borrowing. It is the Fed’s primary tool for keeping the U.S. economy balanced.
The Fed has direct control over this short-term rate through its Federal Funds Rate. The Fed can:
- lower interest rates and stimulate economic growth to stave off deflation and economic stagnation; or
- raise interest rates and slow economic growth to fight inflation and excess demands for labor.
Collectively, the Fed’s use of short-term interest rates and other infusions and withdrawals of dollars to control the economy is known as monetary policy.
Related article:
The long-term market rate
To make a profit on their long-term investments, bond market investors generally consider how the Fed’s current monetary policy will impact the future performance of markets. These millions of world-wide individual and institutional investors forecast future economic conditions which translate via the 10-year T-Note bond markets into a ready gauge for determining future market conditions (and mortgage rates), the wisdom of the crowd call out.
These 10-year T-Note investor considerations encompass two discrete elements:
- desired fixed rate of return on the investment before adjustments for risks, called the real rate of earnings;
- perceived future rate of inflation, called the inflation risk premium; and
- collectively, the rates are built into the 10-year T-Note rate.
Interplay between the treasury rates = the yield spread
Calculating the yield spread is simply a matter of subtracting the 3-month T-Bill rate from the 10-year T-Note rate. Never the other way around.
Generally, a low or declining yield spread indicates a less vigorous economy one year forward, the outlook of the crowd. A declining yield spread is a result of bond market investors seeing less future growth resulting from the Fed’s short-term rate activity and other economic interruptions or stimulus – the global economy’s relationship to ours.
On the flip side of an economic cycle, a higher or rising yield spread indicates a more vigorous future economy. While good for bond market investors with their money parked, whose actions are full-speed-ahead into investment opportunities for profit, a too-high yield spread (and its resulting boom) suggests the danger for increased consumer inflation. When the spread is unacceptably high, the Fed acts to curtail the growth of future jobs and stabilize consumer prices by raising short-term rates — which reduces the spread.
An over-correction has the potential to send the yield spread into low or negative levels. When the yield spread goes negative for a period of around four months, called an inversion, a recession follows 12 months later. Most recessions are Fed instituted to correct for economic distortions. Periods of pandemics and wars (think trade wars in 2025) are recessionary periods by themselves and chaotic in behavior.
A yield spread inversion is the result of the:
- bond market envisioning a future downturn in the economy; and/or
- Fed raising short-term interest rates to correct consumer inflation or loosen money market conditions.
Sometimes even a near-inversion is enough to signal a recession.
That crossover moment in the yield spread gives the real estate broker and agent another signal to adjust their business conduct. At the crossover into a negative yield spread, agents can expect a reduced volume in sales (which have likely already slipped), lending and leasing one year forward.
Then, in a further 12 months, a drop in prices, mortgage rates and rents is experienced. This 12-month delay after sales volume turns downward is the result called the sticky price phenomenon, brought about by money illusions held by sellers and landlords.
Related chart:
Real estate’s stake
Going forward, more and more brokers and agents need to understand the workings of the yield spread as a gauge of the economy’s direction for the coming 12 months. Only then, with this insight, will industry-wide frenzies to over-build, over-price and over-acquire property of all types be tempered.
Brokers and agents who track the yield spread glean the foresight needed to shift their advice given to clients and personal spending before the changes in the market actually occur. In doing so they will seek out recession-proof niches of real estate (such as services needed for real estate owned (REO) sales, MLO endorsement for originations, an escrow department, notary service, or property management) in which to weather the storm.
Related chart:
Buyer Purchasing Power Index (BPPI) hints at rising as home price adjustment sets in


Great input for Real Estate Professionals. It’s self soothing that this information tailors nicely to their needs. The reality is that RE Professionals need to sell properties and their best interest is not their clients. Many RE professionals would be more than willing to drive their clients off the ledge for a $6000 commission. Housing is growing at a rate greater then basic economic fundamentals. Subprime mortgages were blamed for 2008, Today issues though different will get the ball rolling in another RE crash.
Housing has been increasing because:
-Oversees Investors CHINA
-Millennials moving out of their parents house
-Low interest rates
-Strong economy and low unemployment
-Housing starts low.
BUT:
-China is pulling back from US Housing according to the (WSJ)
http://www.wsj.com/articles/chinese-pull-back-from-u-s-property-investments-1448649226
-Millennials have too much student debt, and no down payment, let alone a full time job (FORTUNE)
http://fortune.com/2014/07/08/millennials-home-ownership-renting/
-Mortgage applications plunge after rate hike (CNBC)
http://www.cnbc.com/2016/01/06/mortgage-applications-fall-27-after-earlier-rate-hike-rush.html
-China slowing economy is pulling down the US economy (BOSTON GLOBE)
https://www.bostonglobe.com/news/politics/2016/01/07/will-stock-crash-china-take-down-economy/mmMmUEED8a6BH5EsCzi3wJ/story.html
-Housing Demand and Housing Starts are surging today, Housing Demand and Starts surged from 2003-2006 then crashed (BROOKINGS / NY TIMES)
http://www.brookings.edu/~/media/Projects/BPEA/Fall-2003/2003b_bpea_caseshiller.PDF
http://www.nytimes.com/2015/07/26/upshot/the-housing-market-still-isnt-rational.html
The only difference is Subprime Mortgages and Mortgage backed Securities. Homes are being bought with PMI and 3% down, and speculation will allow them to refinance out of the PMI, only if values continue. But even today, HELOC’s are starting to reset for people who bought and held during the Bubble 1 and this is added debt to an already stretched family who held onto their home, 56% are potentially resetting with higher, fully amortizing monthly payment.
http://www.housingwire.com/articles/33535-trouble-ahead-tidal-wave-of-heloc-resets-about-to-hit
Would like to find out if E & O Insurance is required by law on Real Estate transactions.
Broker and Agent can take risk independently ??
I don’t think E&O insurance is a legal requirement. It certainly is a practical one. Many of the larger companies “self insure”, meaning they collect money from their agents and then pool that money for defense, settlement and judgements. Small brokerages must purchase insurance to protect their company from legal challenges. However, if a brokerage has no assets to defend, they may choose to go naked with regards to E&O.
I am new to this arena, so I had to look up the term Yield Spread. For anyone that is interested, I found a good definition here https://realestatemetro.com/real-estate-terms/yield-spread
Dear Ben,
You can find the bond rate data at the Federal Reserve Bank of St. Louis’ website. The 10-year Treasury data is found here , and the 3-month Treasury Bill can be viewed here.
Regards,
ft Editorial Staff
Where can i find this bond rate data since 1954?
Thanks,
Ben
These are not recessions since 1998 they are bank made financial crises
http://www.pbs.org/wgbh/pages/frontline/warning/interviews/born.html#2
It pays to shop around for a mortgage refinance. Mortgage rates have gone down like anything. My brother in law just got a 30-year fixed loan at 3.76% He told me search online for “123 Mortgage Refinance” for the lowest rate.
If predicting and investing was only so easy as a chart!! Anyway, there is something interesting in the graph. It’s heteroscedastic, with something happening in the boundary period of 1980-1982, perhaps the decoupling of the oil standard, I dunno, but post-82 it looks like a different world. Don’t look at the wiggly lines, look at the number and frequency of the intersections with the upper and lower control limits. I’d be interested in why more orange line interections pre-82. Looks like fewer intersections with the green line after 82 as well, greater variance (well, after 70 anyway), and higher median spread. It would be nice to see data further back.
While Tom and Geo are right about being able to predict a downturn, if your in the business or you listen carefully to people who know the business well, most other people are either too swept up in the greed or don’t they pay attention to what’s going on around them.
Anyway, the chart certainly seems to “presage” what happened. However, the chart shows a back to back recessions of 1980-82. being worse that the current recession, which everybody has been calling the Great Recession. Is there something wrong or is it just the measure you choose?
For example, I’ve read that during the Great Depression (David Kennedy’s book “American in the Great Depression) unemployment was between 15-25% for most of the 10 years. During the 1973 period, during the oil embargo, it rose above 10%. How quickley we forget the past..
Tom is exactly on point. The current market was so obvious, it was all about greed.
Geo. J. Donaldson Jr.
Real Estate Broker
As a long time real estate broker, since 1974, I can say recessions are easily forecast by on the street personal experiences. This last one was so obvious.. we had three years or more of the lax oversight, the liar loans and influx of new agents poorly trained and not supervised.
Any real estate broker who missed this should be working for the SEC. In the 80’s we had similar loans where we often said “if they can fog up a mirror, we can get them a loan”
Yields can also create the situation where the loan broker ignores his client while making more money. It was and is fraud. I quit as I no longer could stomach the stench from so many greedy agents and brokers who just chase the buck and heck* with the professionalism.
Great article on “Using Yield spread to forecast……….Unfortunately the links to previous articles, i.e.”Rate Page”, etc. would not open, I got an error message. If possible I would like to be able to read these references.
I am interested in following this index, how do I find daily quotes, on line, for both the 10 year and the 3 month?
Do I just need the Ticker Symbol? If so I would appreciate the Ticker Symbols for both the 10 year and the 3 month.
Thanks,
Gary Hancock