
Why this matters: Uncertainty comes from a unique balancing act done by the Fed to rein in consumer inflation which when reduced leads to a decline in mortgage rates. Thus, Fed activity affects decisions by clients in need of mortgage funding. Uncertainties suppress homeowner and tenant turnover needed for sales transactions while rising consumer costs, hiring freezes and insufficient housing starts push buyers to the sidelines.
Federal funds and the cautious steps forward
The Federal Reserve (the Fed) uses a variety of financial devices to meet their congressionally-set goals of full employment and stable economic growth. One such device is their benchmark rate, the Federal Funds rate, more commonly called the overnight rate.
The Fed sets a range in overnight rates which apply to lending and borrowing between banks, including the Federal Reserve lending, which is 3.5% to 3.75% as of April 2026. The forward outlook foreshadows an increase in consumer inflation, not a decline, which likely indicates higher rates on all types of borrowing for consumer and asset acquisitions in 2026.
The Fed rate is set to induce or restrain levels of short-term borrowing in the banking system for funds private banks lend to customers.
During periods of business recession such as in early 2020, the Fed drops the Federal Funds rate to encourage more borrowing by banks and in turn by bank customers. Thus, more capital investment and consumer spending takes place, and, in time, more jobs and real estate transactions.
During times of economic excess — boom times — the Fed raises their benchmark rate to inhibit lending and borrowing activity, tempering the growth in wages, consumer spending and capital investment.
Chart updated May 7, 2026. 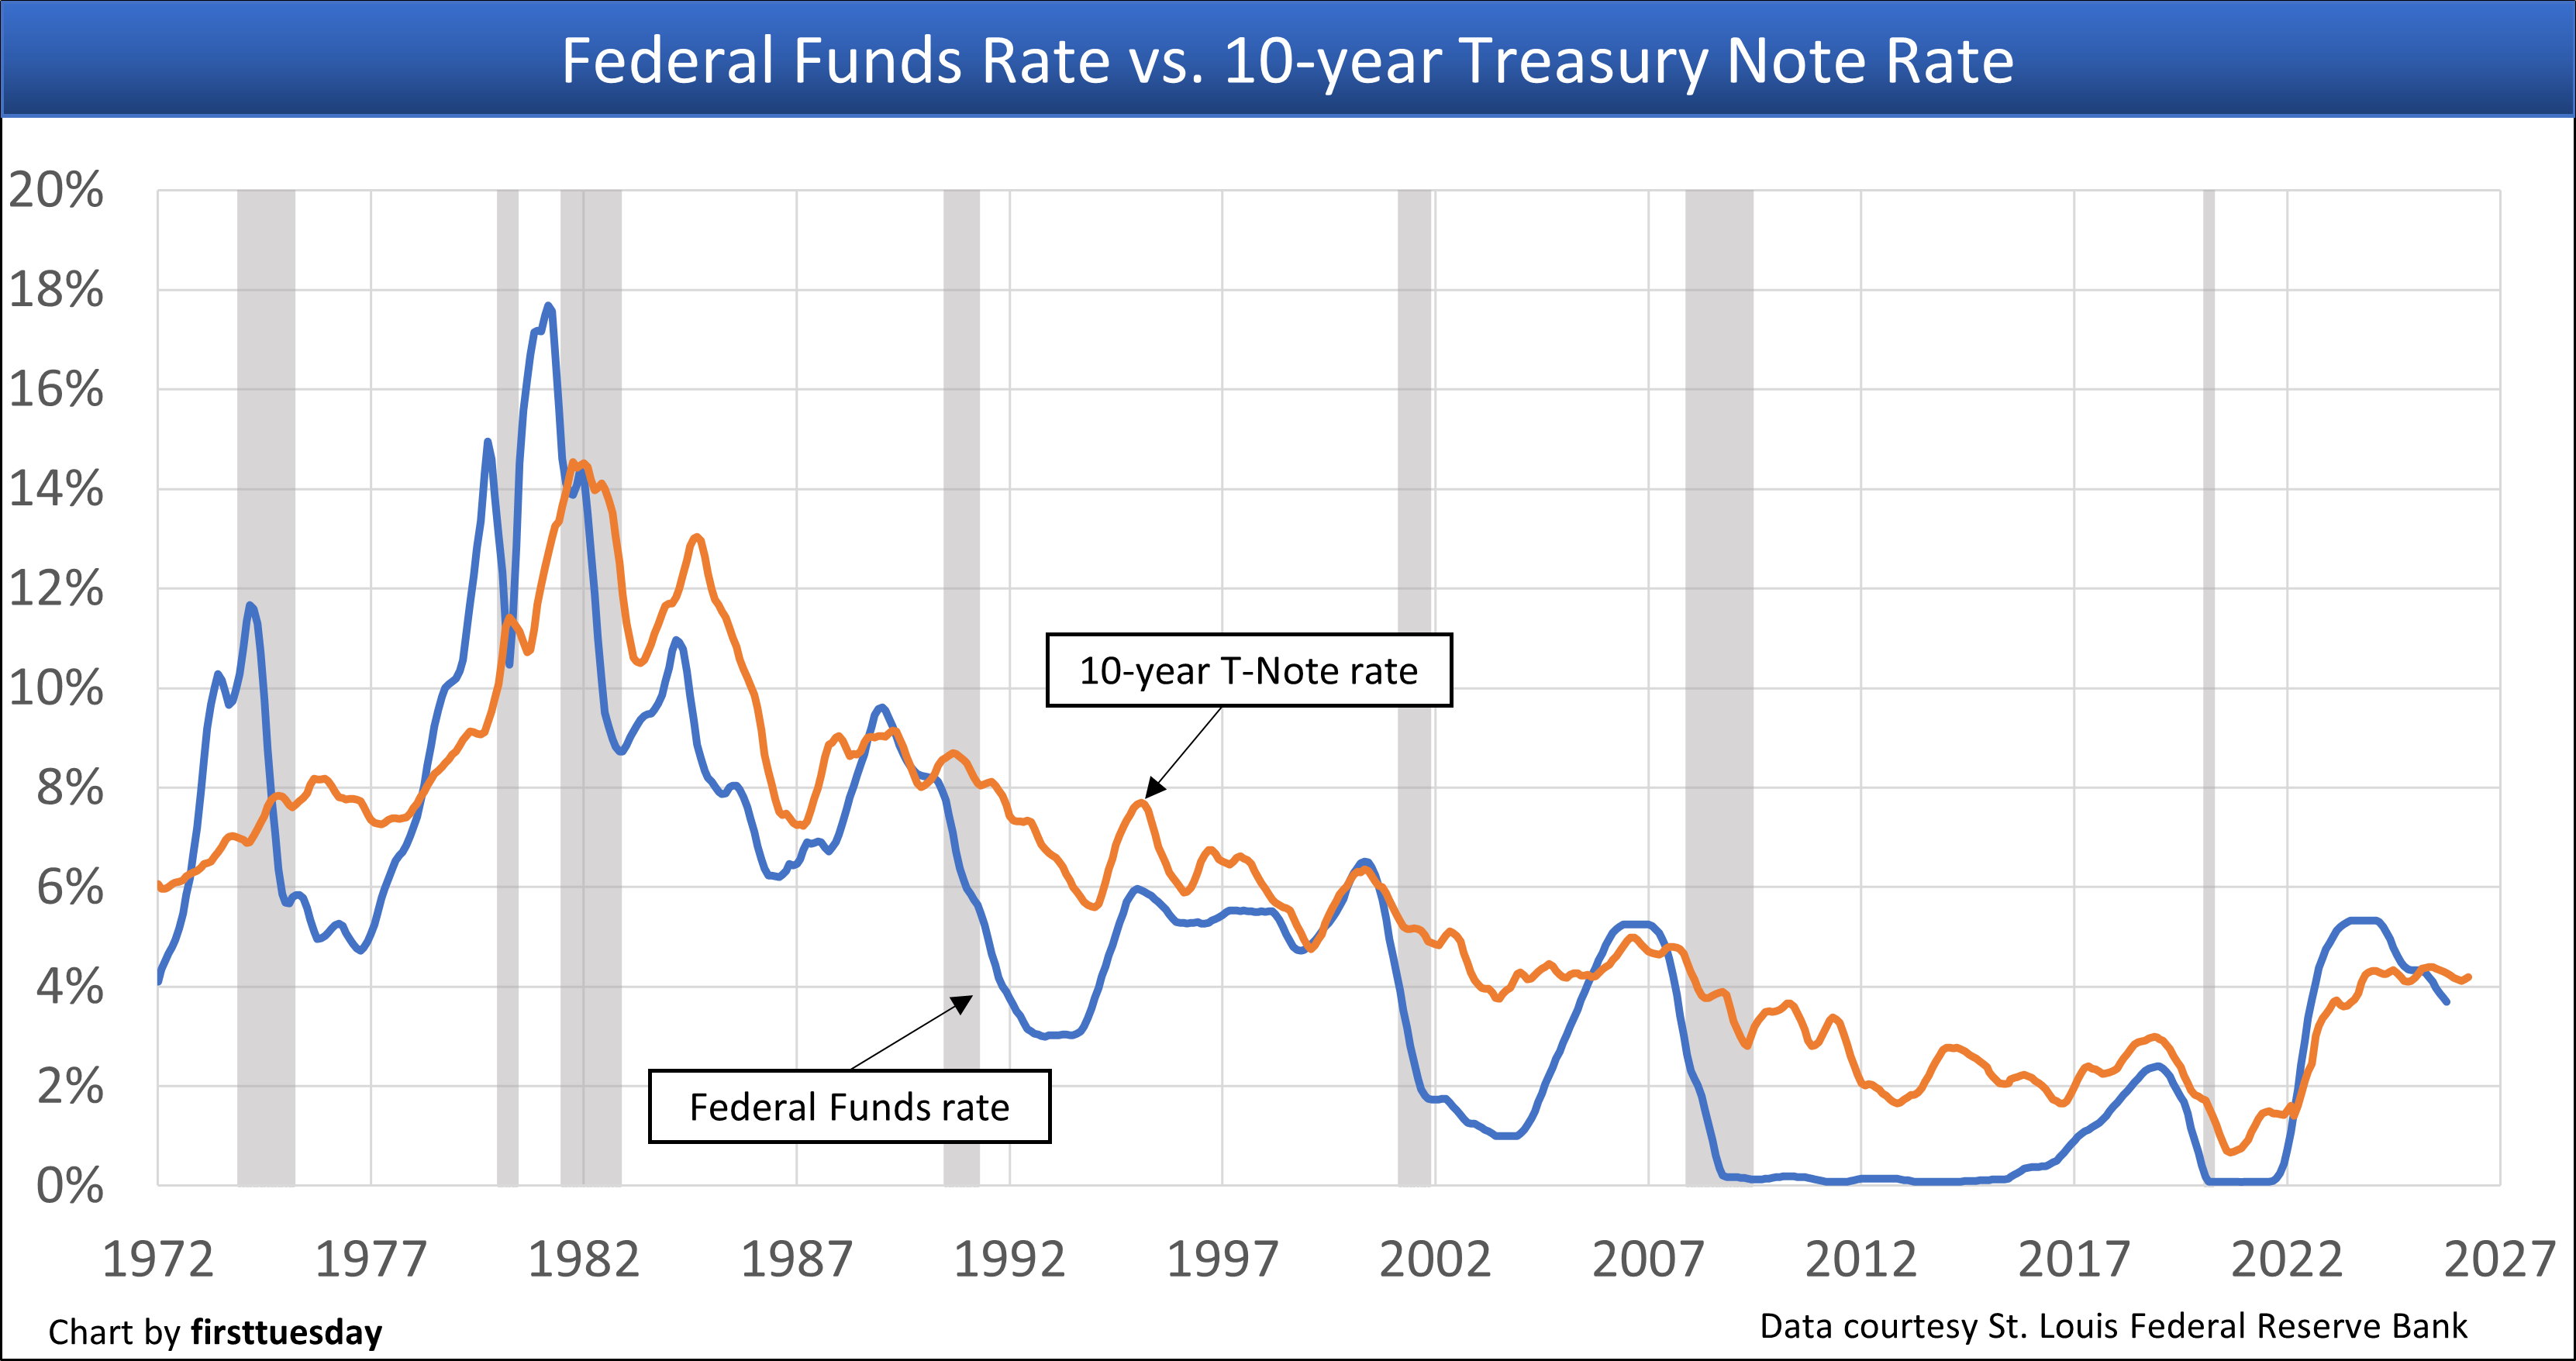
Chart update 5/6/26
April 2026 | March 2026 | April 2025 | |
| Effective Federal Funds rate | 3.64% | 3.64% | 4.33% |
| 10-yr T-Note rate | 4.30% | 4.31% | 4.26% |
The Fed’s monetary policy at work
The Federal Reserve’s (the Fed’s) goals are to maintain through their influence:
- stable consumer pricing, not asset pricing;
- maximum employment without unacceptable consumer inflation, voicing no concern for asset inflation; and
- moderate long-term interest rates for borrowing capital.
The Fed’s main concern is to keep wages and consumer inflation from overheating the economy by using a monetary device to control private banking operations called the Federal Funds rate. This is the rate charged on overnight funds lent between banks and to banks by the Fed. Based on the Fed’s rate plus a spread for losses and profit margin, private banks lend funds to businesses and consumers to provide short-term financing for their purchase of goods and services.
When the Federal Funds rate, also known as the short-term rate, increases, the cost of borrowing by banks increases and is passed on to consumers who, in turn, see their borrowing and thus spending reduced. When the Federal Funds rate is lowered, banks are motivated to borrow as consumers are willing to borrow at the lower rate permitted by the lowered Federal funds rate. As a result of Federal Funds rate activity, banks tend to lend with greater or lesser frequency to businesses and individuals based on the resulting lower or higher Federal Funds rate.
Long-term interest rates move up or down based on the perception of bond market investors about the level of success the Fed achieves fighting inflation — or preventing deflation — in wages and consumer goods and services.
When the Fed’s inflation fight becomes aggressive, producing an inversion of the yield curve as the short-term rate exceeds long-term rates, investors perceive a recessionary period is ahead with fewer investment opportunities. In response, investors pile into notes and bonds to park their funds in a safe haven, which causes long-term rates to decline.
As seen in the chart above, recessions (marked by the gray bars on the chart) coincide with decreases in the Fed Funds rate. Specifically, when the economy is about to enter a recessionary period, the Fed decreases their benchmark rate, making funds cheaper to borrow for banks and, in turn, consumers. This injects stability into a slowing economy and lessens the depth of a recession downturn.
As the economy enters the recovery phase of a business cycle, the Fed gradually increases the Federal Funds rate to allow for growth in employment without a growth in consumer inflation. This rate increase is the Fed’s method for putting a lid on the boiling pot of an over-heated economy — evidenced by rapidly increasing consumer inflation and asset inflation.
When the pot boils over with economic excess, the recession that follows is long and hard — as most recently experienced during the Great Recession of 2008. That recession and following recovery were the longest such events since the Great Depression. It was the consequence of the wild, untamed decades deregulating financial market activities culminating in the Millennium Boom, insufficient fiscal stimulus for a fast correction in 2009, and 2010 congressional re-regulation of financial markets.

The link between Federal Funds, T-Notes and FRM rates
A glance at the rate comparison chart above suggests to the casual observer that the Federal Funds rate and 10-year Treasury note rate might somehow be linked. But what is the connection? And what connection to ARM or FRM rates exist?
The first property owners affected by Fed rate movement are those whose properties are encumbered by ARMs. Each movement in the Fed’s short-term rate directly triggers a two-step mechanism to alter the note rate on an adjustable rate mortgage (ARM).
As a first step, any movement in the Fed’s short-term rate alters figures in short-term rate indices. ARM note rate adjustments are tied to the figures in one of these indices. As a second step, the property owner’s ARM note rate adjusts an amount equal to the movement in the index figures, limited to range-of-change restrictions in the ARM note.
These owners see their monthly payments increase or decrease after the Fed rate moves. The only limitations on ARM rate changes are ARM note provisions setting the time period for an adjustment, and ceiling and floor rate ranges for each adjustment over the life of the ARM.
Rates for fixed rate mortgages (FRMs) are indirectly and belatedly affected by the Fed rate’s short-term rate activity. For a connection to the Fed rate, an FRM analysis is necessary.
The FRM rate is set at origination, fixed for the life of the FRM, and tied to the 10-year Treasury note (10-year T-Note), not the Federal Funds rate. The 30-year FRM note rate in normal economic times was set prior to 2013 roughly at a 1.5% spread above the 10-year T-Note rate. This rate spread for consumer-purpose mortgages has varied up to 3% since 2013 and is under 2.0% in the beginning of 2026.
This mortgage rate spread is classified as a risk premium received by the mortgage holder for anticipated:
- losses on a default by the property owner, a risk not present in the 10-year T-Note; and
- devaluation of the mortgage principal balance as long-term rates trend higher.
10-year T-Notes are purchased by bond market investors looking for a long-term safe place to park their money at a rate of earnings which anticipates the effect of future Fed activity to control long-term inflation levels.
In times of protracted uncertainty for private investment opportunities, investors from around the world pour excess funds into 10-year T-Notes — as occurred in the first half of 2020 at the outset of the global 2020 Covid recession. This surge in demand for bond investments increases the price of the 10-year T-Notes while decreasing the rate of yield — the interest rate earned on T-Notes. In turn, the 30-year FRM rate declines for new originations.
Now comes the interesting part. When a recovery period gets underway, the Fed initially raises their Fed Fund rate to commence a routine monetary (money supply) adjustment to fine-tune the national economy. In doing so, the Fed heads off what the Fed anticipates as future excesses in consumer inflation and wage increases due to growth in the national economy. This monetary activity instantly attracts the attention of 10-year T-Note investors.
Soon, investors in the 10-year T-Note pull their funds and re-direct the money into investment opportunities which will profit from a growing economy as anticipated by the Fed. As a direct result of these T-Note withdrawals, the 10-year T-Note rate rises as the U.S. economy heads into an expansion.
Since the FRM rate is set based on the 10-year T-Note rate, FRM rates on origination directly rise and fall with the path taken by 10-year T-Note rate. Conclusion: The Fed fights inflation and bond investors hunt for investment opportunities at the same time in an expanding economy until:
- the Fed ramps up the Fed Fund rate to aggressively fight perceived excessive future consumer inflation; and
- investors quickly return their money to the safe haven of 10-year T-Notes.
Thus, long-term T-Note rates drop and, in turn, drive down the rate on origination of FRMs. Buyers borrow more with their same income, which attracts sellers, and real estate prices start to rise.
Related article:


Why does the Fed prioritize controlling inflation, and how can that decision affect people planning to buy a home?