

Why this matters: Available local economic data serves to inform brokers and agents, enabling them to better serve their clients. Santa Clara County now faces low turnover of homeownership and tenant occupancies until prices adjust to a buildup in inventory for sale and rising mortgage rates.
A recovery falters and fails in every business cycle
While Santa Clara County typically benefits from a robust jobs market and a healthy level of residential construction, these post-pandemic years have seen economic progress — and home sales — constrict throughout the region.
In 2020, the economic response to the global pandemic alongside the underlying business recession caused job losses to ripple across the state. To counter these losses, mortgage rates were artificially dropped to historic lows which, along with a society-wide FOMO stressing homebuyers to act irrationally and critically low for-sale inventory, pushed home prices into super-bubble territory.
In 2022, pandemic stimulus efforts ended and mortgage interest rates doubled, slashing buyer purchasing power. In turn, buyers and sellers retreated due to their financial inability to buy or relocate. Stimulus-driven property prices had collided with high mortgage rates to greatly reduce sales volume, leasing transactions and mortgage originations.
The result is today’s ongoing real estate trough. Anemic home sales volume and the failure of real property values to keep up with inflation causes further reluctance from buyers and sellers.
Look for a recovery to consistently gain momentum around 2030. In the meantime, recession-proofing your practice will ensure the continuing success of your real estate career during the ongoing slump in fee transactions.
Updated June 26, 2026.
Home sales volume stays low
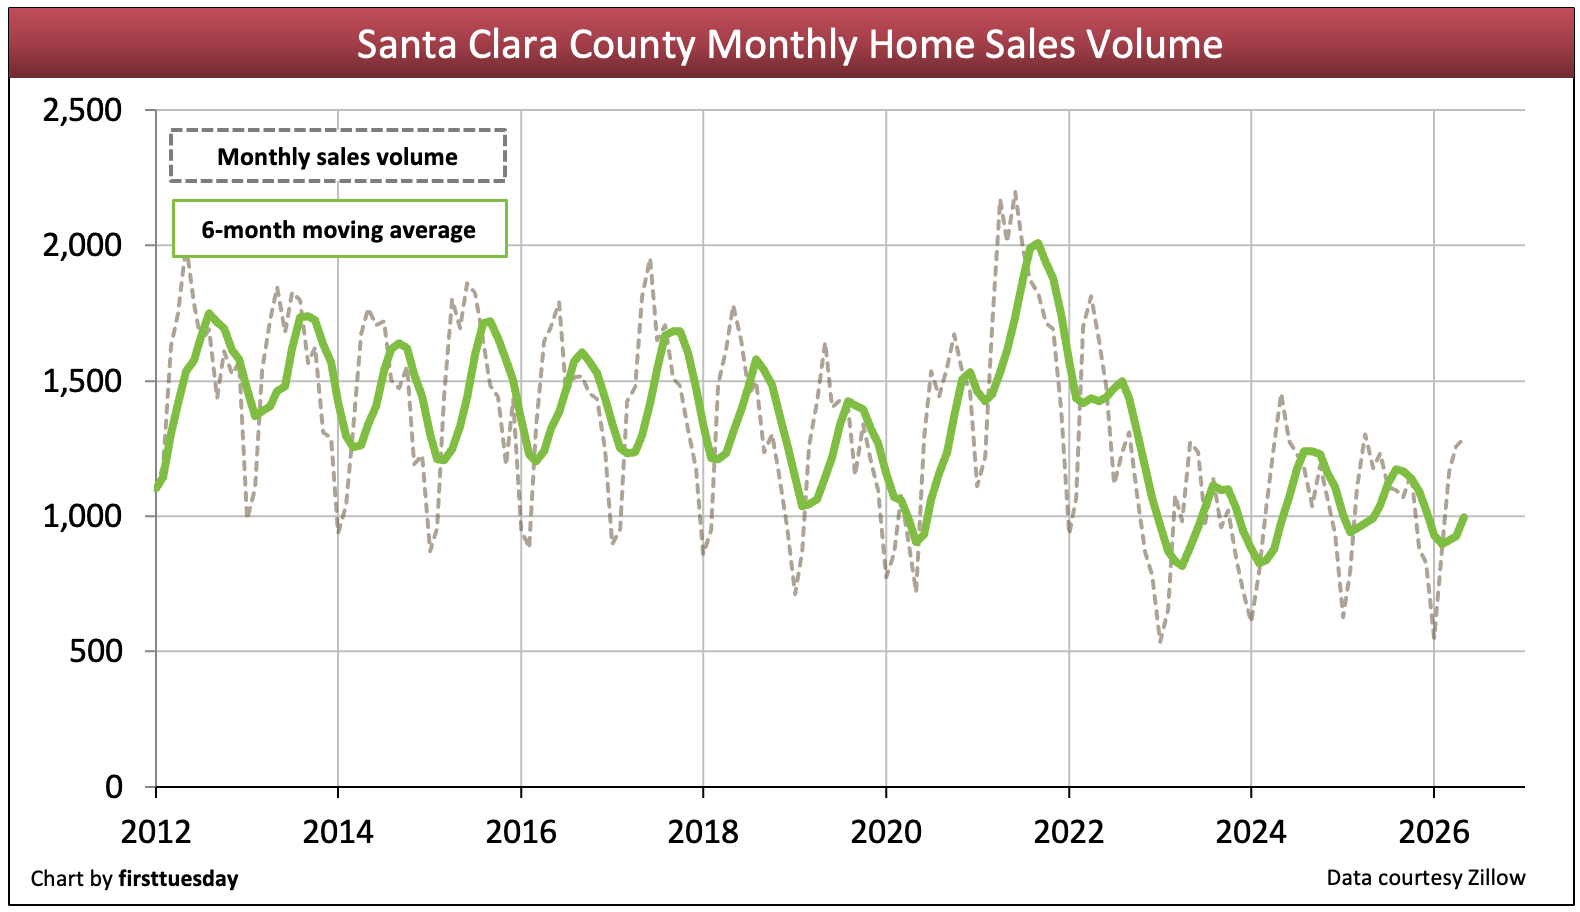
Chart update 06/26/26
| 2025 | 2024 | Annual change | |
| Santa Clara County home sales volume | 11,600 | 12,300 | -6% |
During 2025, closed home sales totaled 11,600, a 6% decrease from 2024, continuing a downturn in fee-generating real estate transactions. The trend can be more easily seen in the 2-year running average shown on the chart above in green. In alignment with Santa Clara, no other major metropolitan area in the state has had an upturn in sales volume since mid-2022.
As of May 2026, year-to-date (YTD) sales volume is a slight 3% above the same period for 2025.
For the year 2026, expect sales volume to remain roughly the same as 2025 sales volume. Buyer caution, not an inability to buy, keeps buyers from willingly making a purchase offer. The unwillingness to buy in 2026 is fed by the lack of clarity about job opportunities, the global trade wars and the federal war on California’s huge immigrant population. California has reasons for its position as the fourth largest economy in the world.
Expect sales volume and prices to continue to decline as the now three-year-old trough in real estate activity continues, likely into 2028. Logically and historically, homebuyers tend to sit out a declining real estate market until they become certain prices have turned around.
Related article:
Inventory recovery from financially destructive low levels
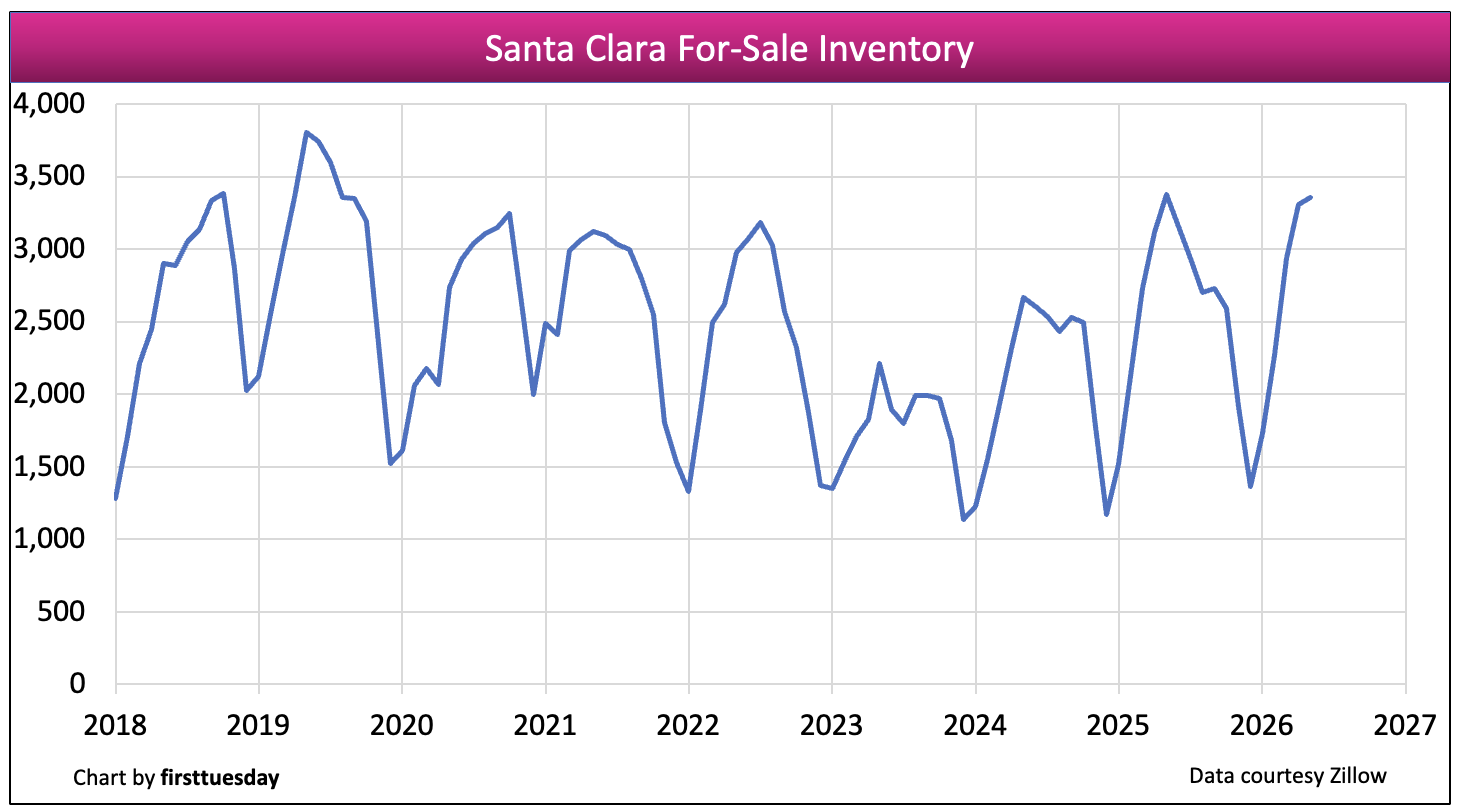
Chart update 06/26/26
| May 2026 | May 2025 | Annual change | |
| Santa Clara County for-sale inventory | 3,400 | 3,400 | -1% |
As of May 2026, for-sale inventory in Santa Clara averages a slight 1% below one year earlier, essentially level. The inventories of property for sale and for lease continue to rise from the historic steep decline during the pandemic years.
The buildup in for-sale inventory is a symptom of owner and buyer contrary behavior in 2026. The public’s attitude and expectations about real estate are driven by trending real estate market conditions, federal management rippling through the population and the general economy of jobs and business. The economic picture today has buyers holding off on purchases and sellers holding onto visions of old pricing.
Looking forward, expect for-sale and for-lease inventory to continue to climb in 2026 and 2027. As for SFR 30-year FRM rates, they rose sharply in 2024-2025, slashing buyer purchasing power coming out of the pandemic period. Pricing of property for sale has not responded to the effect of mortgage rates – and inventory growth – but began to level out in 2025. High mortgage rates make it nigh on impossible for mortgage-funded homebuyers (and sellers seeking to purchase replacement property) to justify ownership over renting for another 18 to 30 months when prices will be lower.
Today’s evolving buyer market with a fast-growing for-sale inventory needs to, and will, experience increasingly significant price declines before sellers attract buyers. A market of declining prices is a context which causes homebuyers to simply wait out the price decline – until prices trough and show a clear recovery trend. We have some two plus years to go.
Turnover of owners and tenants keeps dropping
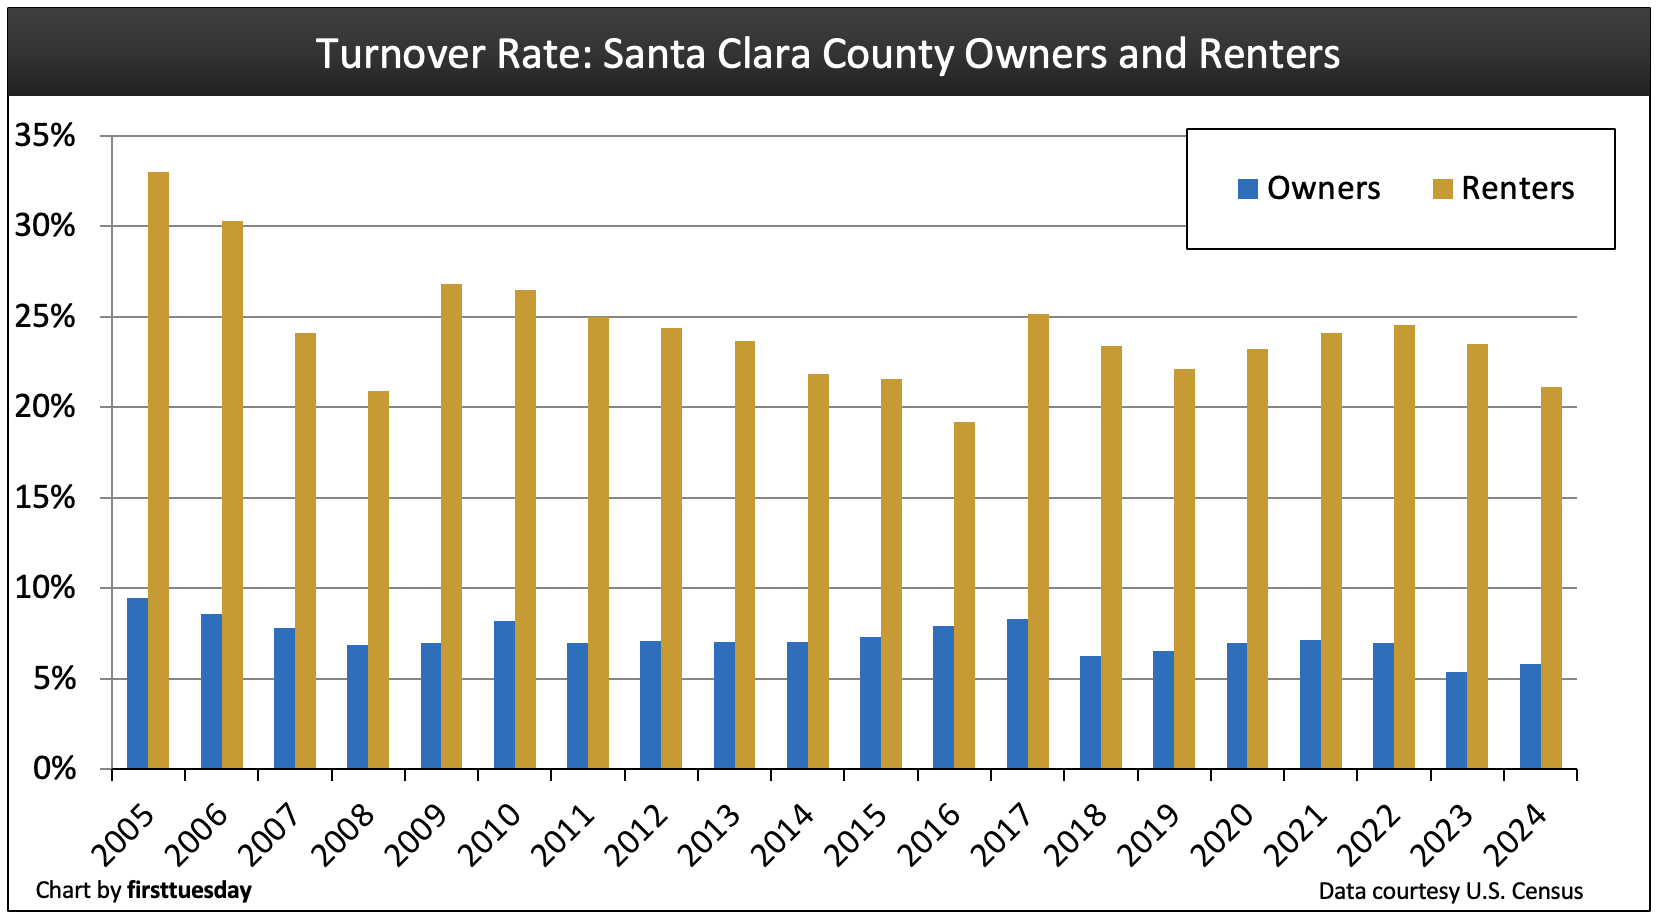
Chart update 12/05/25
| 2024 | 2023 | 2022 | |
| Santa Clara County homeowner turnover rate | 5.9% | 5.4% | 7.0% |
Santa Clara County renter turnover rate | 21.1% | 23.5% | 24.6% |
It’s no surprise Santa Clara County’s homeowner turnover rate remains near its lowest rate in decades, given the county’s extreme price range in property prices. Few owners are willing to sell and relocate to a home with more amenities, and tenants get the math that with any down payment less than 30% the mortgage payment is more than rent for comparable housing.
Owner-occupant turnover — the percentage of homeowners who moved within the last year — rose slightly in 2024 to 5.9% from 5.4% a year earlier. The tenant turnover slipped to 21.1% in 2024 from 23.5% in 2023.
Expect the frequency of turnover to decrease for around 18 to 30 months.
With the ongoing real estate recession, homeownership will continue its long-term downward trend as homebuyers simply back off ownership until prices begin an upward turn. In the meanwhile, expect tenant turnover to decline as tenants tend to remain in rentals when homeownership is more expensive than rent.
Turnover rates will tick upward as employment begins a consistent recovery and home prices rise out of their current trough in the Santa Clara area to become competitive with other IT centers throughout the nation, likely sometime after 2027.
Homeownership remains exhausted by high price pressure
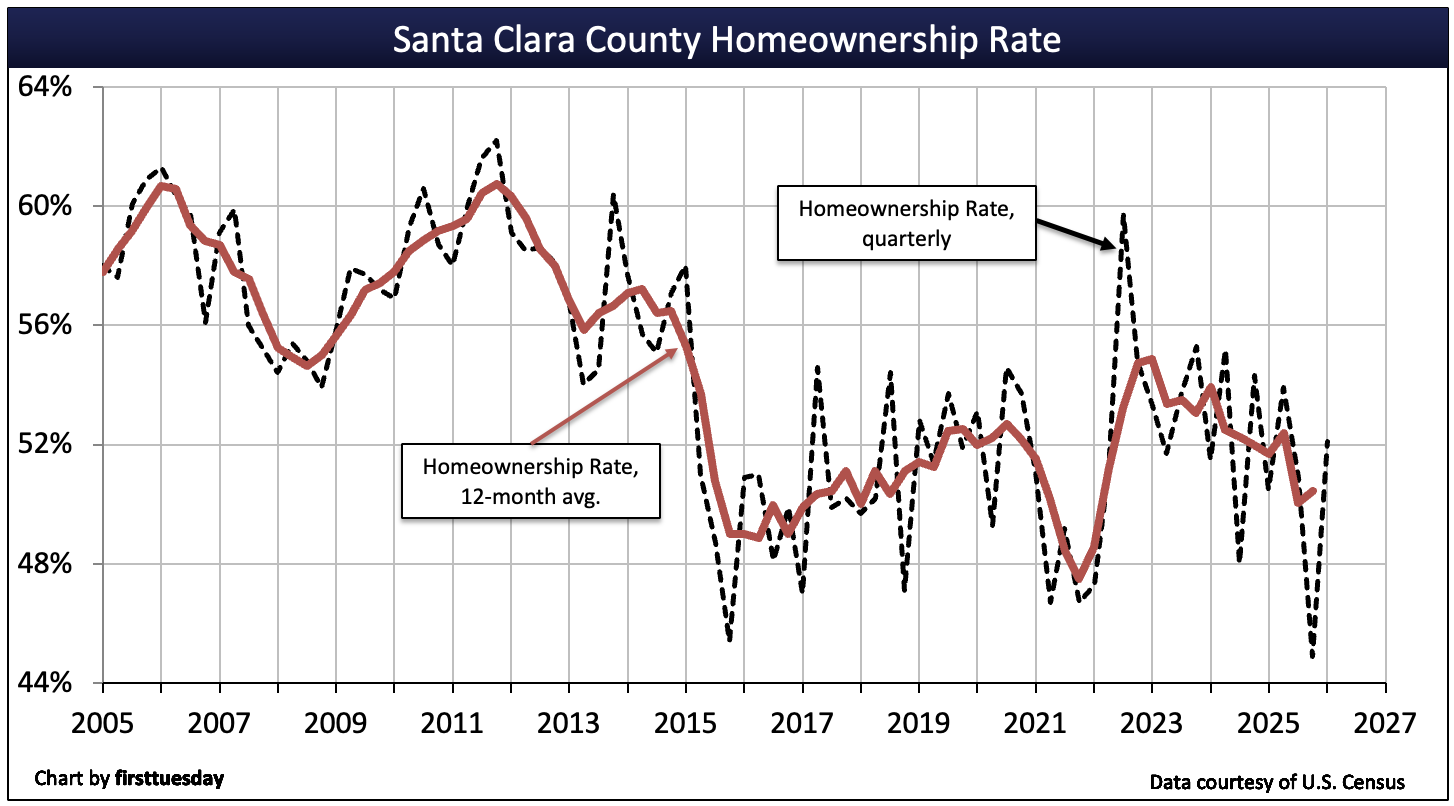
Chart update 06/26/26
| Q1 2026 | Q4 2025 | Q1 2025 | |
| Santa Clara County homeownership | 52.1% | 44.9% | 50.5% |
The dashed trendline above shows a five-year average, accentuating the results of a buyer retreat from ownership in the high 50% range prior to 2015, bottoming in the low 50% range by 2020 and continuing today following the pandemic economic disturbance.
Santa Clara County homeownership peaked at 61.3% in 2006, and in Q1 2026 is just over 52%. Santa Clara’s homeownership rate regularly averages below the statewide average, which is 55.7% as of Q1 2026.
Santa Clara County’s long-term homeownership rate initially trended downward after 2005 due to massive home foreclosures in the Great Recession period surrounding 2008. The following years into 2015 experienced both investor and user demand for SFRs which combined to dramatically increase property prices. That demand enlarged by a piling in of investors and the post-2012 upturn in mortgage rates (following 30 years of constantly declining mortgage rates) which combined to push households to rent, not own, persists today.
The rest of the state also experienced a swift decline in homeownership since foreclosures in the 2008 recession cut deeply into the homeownership psyche.
Regional multi-family construction sinks to new low
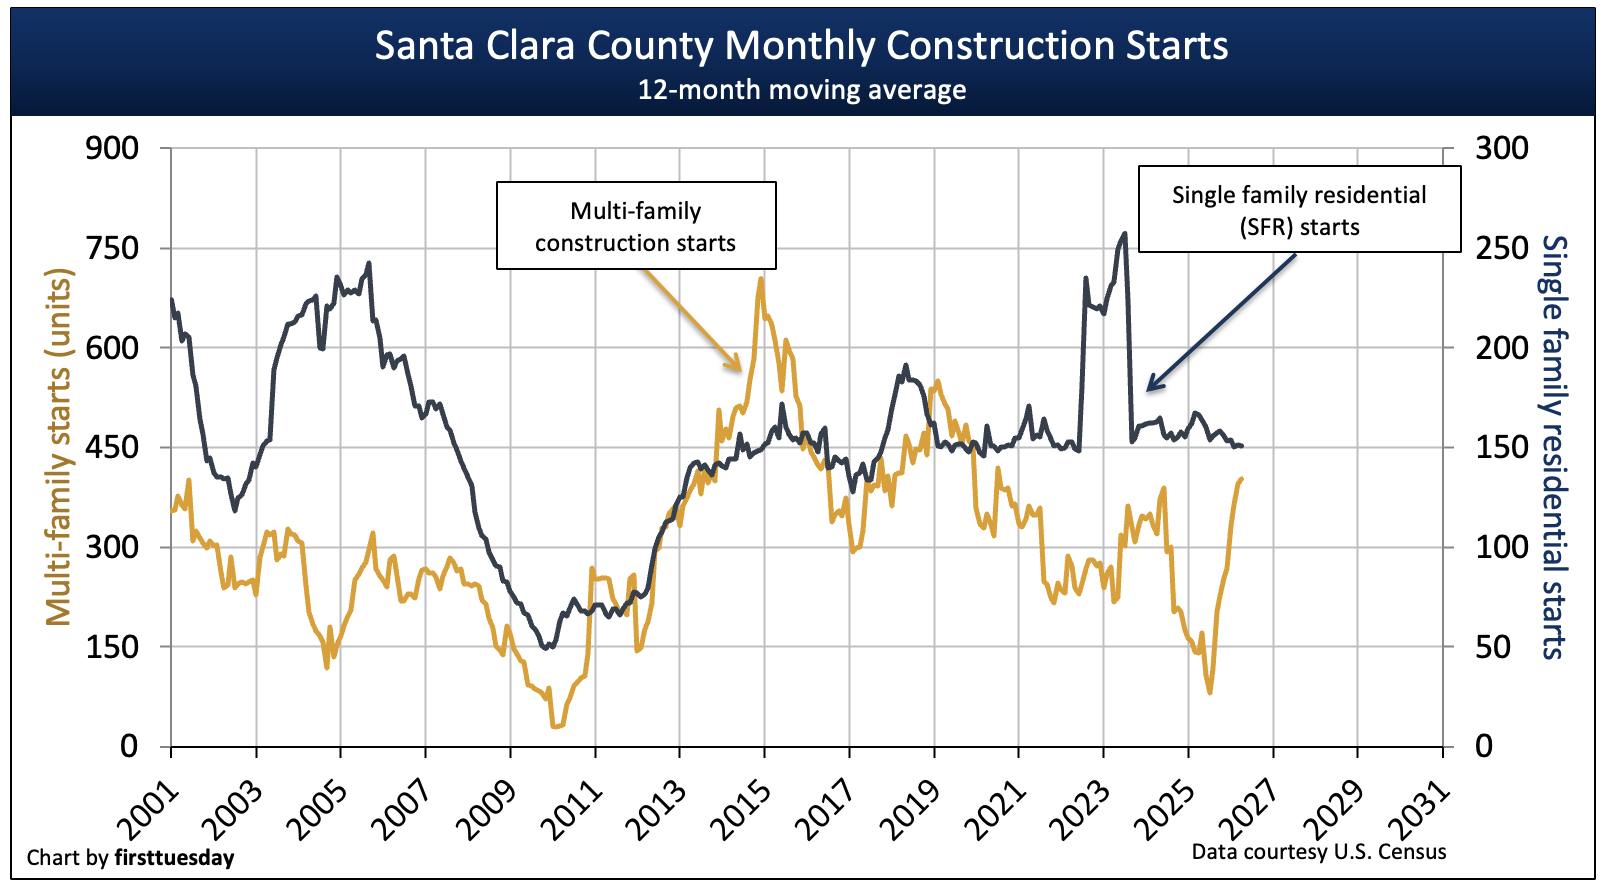
Chart update 06/26/26
| 2025 | 2024 | Annual change | |
| Santa Clara County single family residential (SFR) starts | 1,900 | 1,900 | -1% |
Santa Clara County multi-family starts | 4,000 | 2,100 | +90% |
2025 residential construction starts for single family residential (SFR) in Santa Clara County were flat in 2025 over the prior year, following two years of volatile swings. Multi-family starts nearly doubled in 2025 due to a handful of large projects. However, the ratio of multi-family starts and SFR starts is roughly the same as the homeownership and rental ratio.
New residential construction has become more costly in 2025, reducing builder profit margins further, just as the price of existing homes has started to decline. Expect builders to put off new starts until the chaos of unpredictable government trade war taxes and the deprivation of migratory labor ends.
Offsetting the added costs and downward home pricing is recent California legislation rezoning most SFR parcels as two- or four-unit residential parcels. The sole objective is to foster more feasible infill construction by compounding the use of existing infrastructure.
Santa Clara jobs went flat to down after the 2021 job recovery
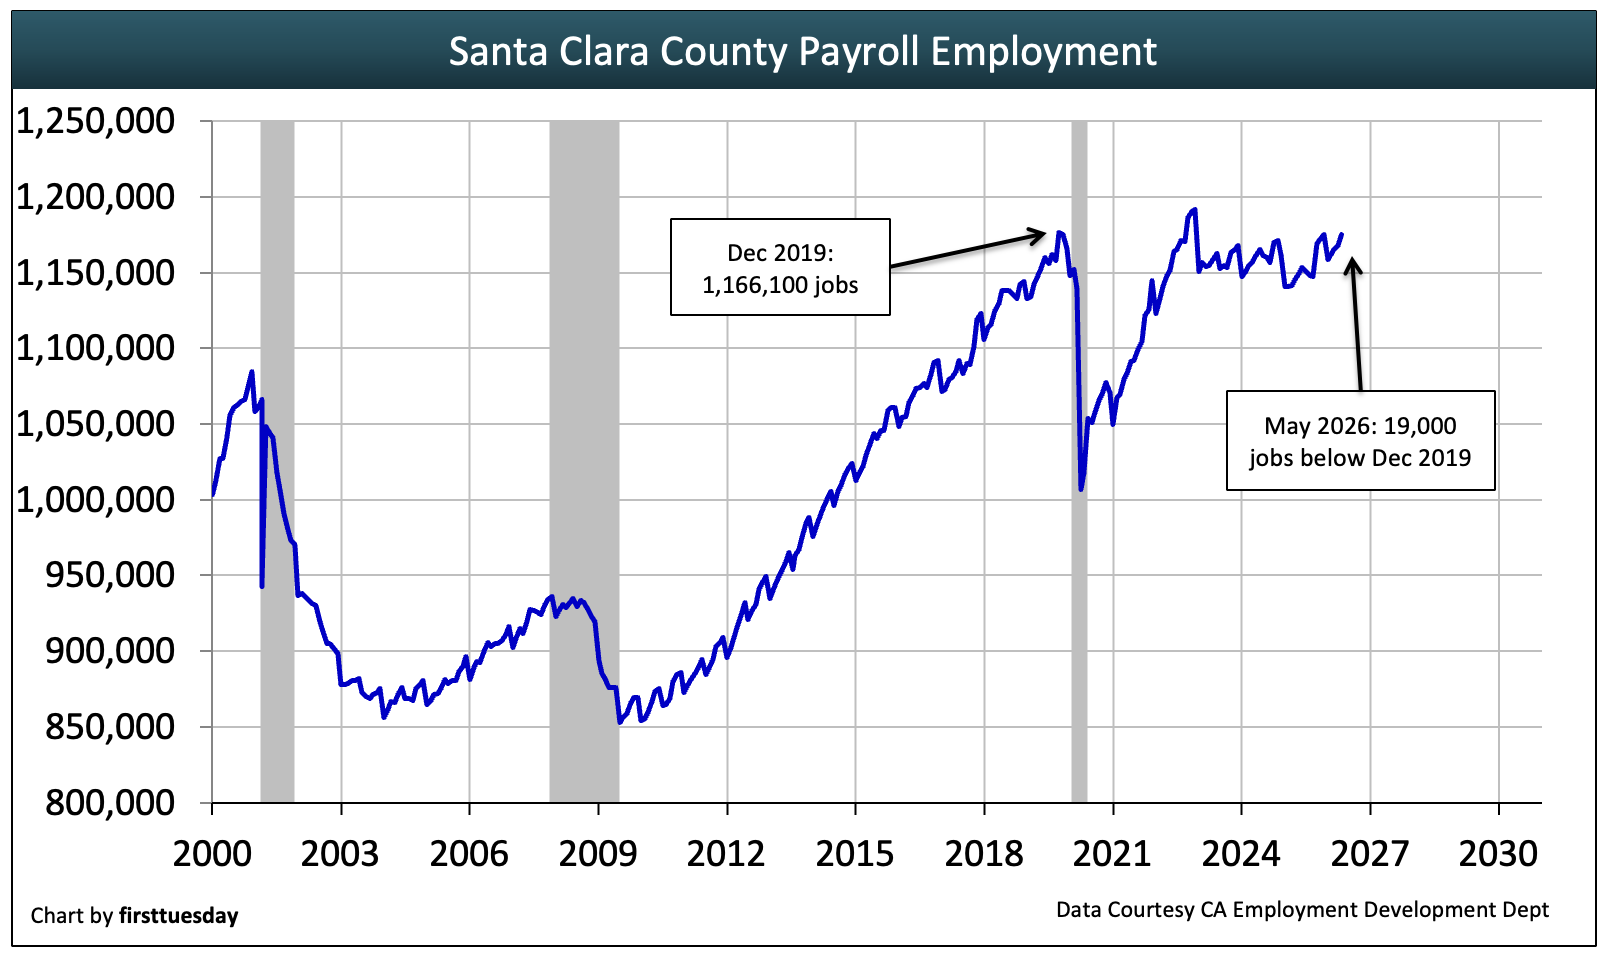
Chart update 06/26/26
| May 2026 | May 2025 | Annual change | |
| Santa Clara County jobs | 1,175,100 | 1,149,400 | +2.2% |
Employment is a leading indicator for all types of housing demands in Santa Clara. Employment and mortgage rates interact to set buyer demand for homeownership.
As of May 2026, Santa Clara County is still 19,000 jobs below its December 2019 peak. However, unlike the rest of the state, employment has experienced a meaningful rebound of 2.2% over the past 12 months. Whether the upward trend continues remains to be seen. Silicon Valley is being drained of its talented technological brains by the nation’s cities as other states successfully lure employers with incentives to relocate. Thus, Santa Clara County is in transition, a local political challenge.
Employment by industry
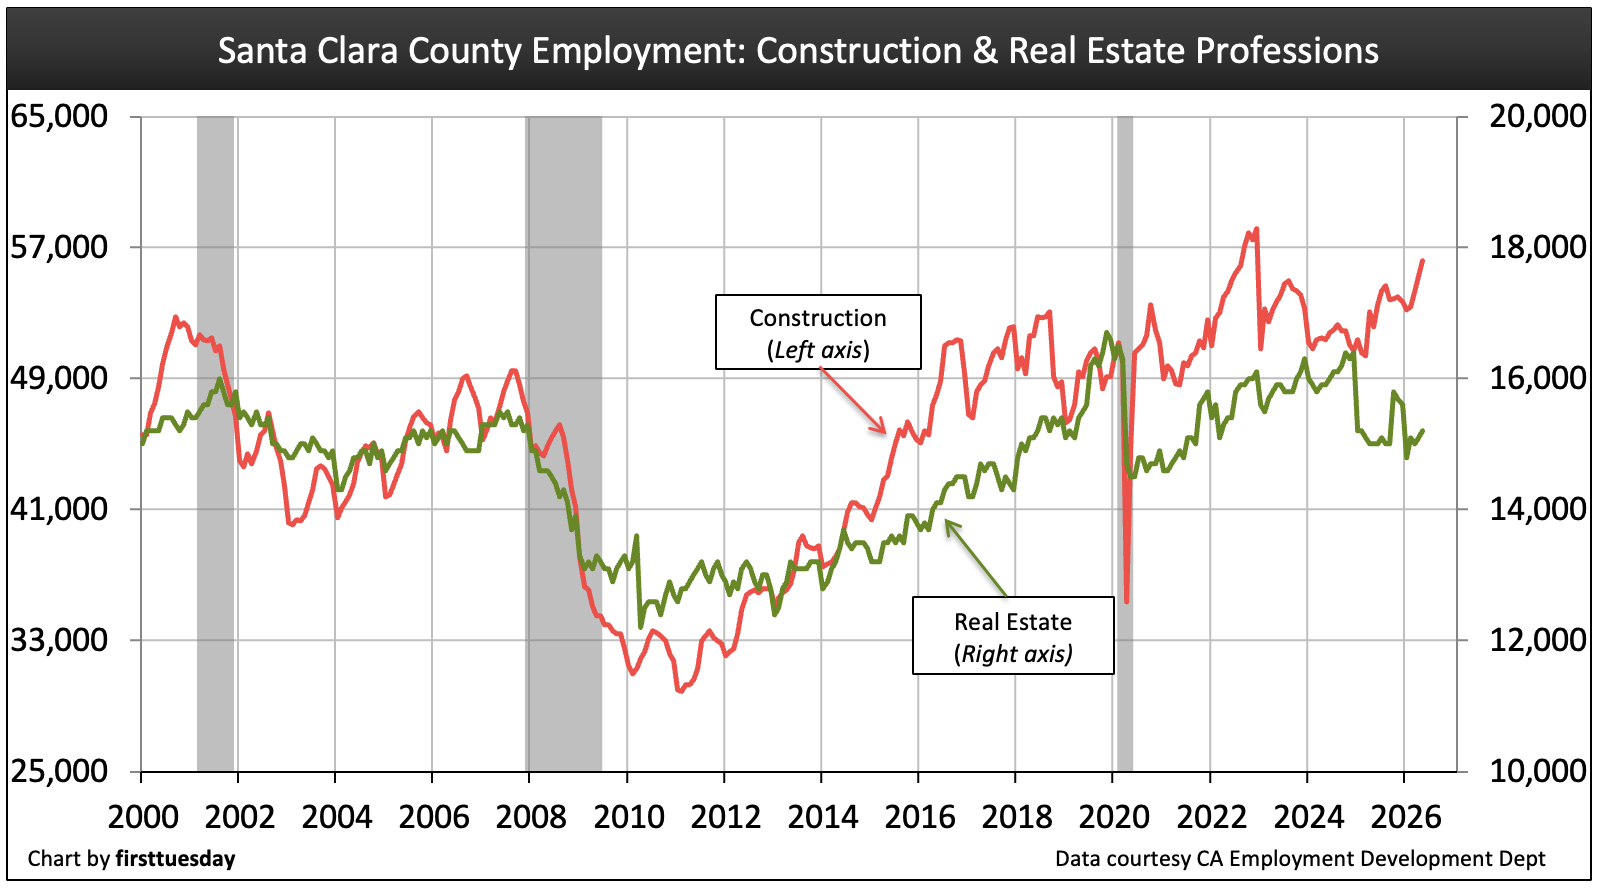
Chart update 08/29/25
| Jul 2025 | Jul 2024 | Annual change | |
Construction | 56,200 | 52,200 | +8% |
Real Estate Rentals & Leasing | 15,200 | 15,000 | +1% |
As of May 2026, construction jobs have grown 8% annually with real estate jobs rising a slight 1% over the same period.
In the construction industry, jobs peaked in 2018. Today, some seven years on, jobs are merely hovering near the pre-pandemic peak and will decline over the next few years. Builder motivation to develop new housing is in serious decline in 2025. Meanwhile, real estate jobs have dropped below pre-pandemic recession years, This trend will continue until sales volume falls no further and then measurably picks up, likely around 2028.
Expect the construction industry to experience a decline in jobs for the next few years as the County of Santa Clara moves further into the real estate recession which set in mid-2022. The decline in construction will continue until the cost of building materials is fully stabilized and necessary laborers are again readily available, a time period not now capable of determination.
The California legislative effort to induce more residential construction is helpful. However, economic feasibility for starts will not set in until material costs and labor issues are resolved at the federal level.
Meanwhile, real estate jobs are down 8% from early 2020 peak, never recovering from the pandemic recession. Further, the present rise in real estate for sale inventory, the current stage set by three years of declining transactions, will continue until sales and leasing activity picks up, likely in 2028.
Related article:
Home sales volume impacts sales agent licensing and renewals
Income is outpaced by home prices and mortgage rates

Chart update 7/11/25
| 2023 | 2022 | Annual change | |
| Santa Clara County per capita income | $151,000 | $142,700 | +5.8% |
| California per capita income | $81,250 | $76,900 | +5.6% |
Santa Clara County personal income is significantly greater than the statewide average. From 2022 to 2023, incomes increased 5.8% in the region, slightly above the state average but not as significant an increase as experienced in recent years.
Despite these relatively large income boosts, one factor or another needs a damaging alteration to attain the homeownership levels of past years. One resolution providing factor which has not taken place is household incomes increasing to match the past 12 years of the price increases in homeownership, and this is not going to occur as income is tied to consumer inflation, not asset inflation.
Another, which is the only feasible factor, is the price to purchase a home or to rent housing needs to decrease dramatically to bring acquisition and carrying costs of mortgage payments into line. Another, the third leg of the triangulation for ownership, is a change in mortgage rates and capitalization rates. They need to decline to 2021 levels, which also is not going to happen as a global bond market controls mortgage rates via the 10-year Treasury note rate.
Expect home prices to drop, say, 15% to 30% depending on a home’s price tier, as the real estate recession deepens. Rents will slip less noticeably, say, 10% to 15%, before the real estate recession is over – around 2028.
Mortgage rates will remain high through the remainder of 2026. Buyers simply wait out periods of home price declines until for-sale inventory reaches a six-to-nine-month supply – based on monthly sales rates – and prices trough and begin to rise.
Related article:
Can the Fed cool inflation without implementing another recession?










A strong jobs market does not always translate into strong home sales. What do you think is holding buyers back right now?
This article provides a valuable data-driven perspective on the challenges facing Santa Clara County’s housing market. What stands out most is the disconnect between rising incomes and even faster-growing housing costs, which continues to make homeownership difficult for many residents despite the region’s strong economy. The analysis effectively highlights how mortgage rates, limited turnover, and affordability pressures are influencing both buyers and sellers. It also serves as an important reminder that housing trends are closely tied to broader economic conditions, making long-term planning and policy decisions critical for creating a healthier and more accessible housing market in the years ahead.
Despite limited inventory limiting sales volume, the Bay Area still seems to be heading for or going above the bubble zone.
Regardless of low inventory hurting sales volume, the Bay Area continues to look like it is approaching or extending into bubble territory.
I have renewed my license with First Tuesday . I started Real Estate in 1978.. I would like to ad First Tuesday to my face book friends and associates.
I read all your real Estate updates and would like to share them. Wanda J Birdsong
Wanda,
Thank you for renewing with first tuesday! If you would like to follow our Facebook page, you can find it here.
Regards,
ft Editorial
I get it. You repost as new (see the only comment – mine from 6 months ago). The premises found in the first two paragraphs are even more incorrect now than back then.
1) Housing recovery not ‘on its way.’ It reached new peaks and continued upward as of two years ago.
2) If high cost is a drag on demand then I would hate to see the 100+ offers per property that might occur instead of the 10-20 we have now for the northwestern quadrant (the most expensive part of the Valley). Send one of your staff here and I’ll drive them around for a half day to demonstrate my points.
Low home sales volume is not due to cost. It is due to inventory. (Perceived) Low demand is not due to cost. It is due to inventory. The basic concept of supply and demand might be a little low-brow for this article but it works a lot better than the theories postulated here.
Steeply rising prices are not a drag on sales volume. A lack of inventory is a drag on sales volume. No one wants to sell when their investment is going up 15-20% per year (for the last 4 years). Most properties coming on the market at or above the median of $900K will receive 3-10 offers or more. Some cities have less than 3 weeks of inventory compared to 4.5 months nationwide. It will slow down and volume will pick up when appreciation settles back to 4-7%.
Silicon Valley (Santa Clara County and half of San Mateo County) is a destination. Most homebuyers do not have an exit plan. They plan to stay indefinitely. They have 25% to 50%+ down payment the majority of the time and are tolerant of market cycles. It is mostly built out despite stories of new construction. Those locations have 1-2 hour commute times (each direction) to major employers along the Peninsula.