
The first quarter (Q1) 2024 reports on the Southern California (SoCal) commercial market are in, courtesy of VOIT Real Estate Services.
SoCal’s commercial market softened further this quarter. Though demand remains higher for industrial compared to retail and office space, all commercial classes are experiencing a slowdown in activity and development.
San Diego County — industrial, retail and office
San Diego County’s industrial vacancy rate is:
- 5.35% in Q1 2024
- up from 4.56% in Q4 2023
- 2.7 percentage points above the vacancy rate of 2.60% in Q1 2023

San Diego County’s retail vacancy rate is:
- 4.36% in Q1 2024
- slightly up from 4.02% in Q4 2023
- slightly below the vacancy rate of 4.42% in Q1 2023
San Diego County’s office vacancy rate is:
- 12.26% in Q1 2024
- up from 11.87% in Q4 2023
- above the vacancy rate of 11.64% in Q1 2023
San Diego County’s industrial net absorption — the total change in occupied industrial space during the quarter — is:
- -616,027 square feet in Q1 2024
- down from -415,173 square feet in Q4 2023
- down from -432,997 square feet in Q1 2023
San Diego County’s retail net absorption — the total change in occupied retail space during the quarter— is:
- -435,480 square feet in Q1 2024
- down significantly from +209,983 square feet in Q4 2023
- slightly up from -452,020 square feet in Q1 2023
San Diego County’s office net absorption — the total change in occupied office space during the quarter — is:
- -414,349 square feet in Q1 2024
- down significantly from +386,362 square feet in Q4 2023
- down from -178,618 square feet in Q1 2023
Orange County — industrial and office
Orange County’s industrial vacancy rate is:
- 3.22% in Q1 2024
- up from 2.57% in Q4 2023
- 1.7 percentage points above the vacancy rate of 1.46% in Q1 2023

Orange County’s office vacancy rate is:
- 16.83% in Q1 2024
- slightly down from 17.27% in Q4 2023
- flat with the vacancy rate of 16.85% in Q1 2023
Orange County’s industrial net absorption during the quarter is:
- -949,396 square feet in Q1 2024
- down significantly from -61,967 square feet in Q4 2023
- down significantly from +94,262 square feet in Q1 2023
Orange County’s office net absorption during the quarter is:
- -207,467 square feet in Q1 2024
- down significantly from +366,886 square feet in Q4 2023
- up significantly from -1,262,288 square feet in Q1 2023
Los Angeles County — industrial
Los Angeles County’s industrial vacancy rate is:
- 4.71% in Q1 2024
- up from 3.77% in Q4 2023
- 2.2 percentage points above the vacancy rate of 2.49% in Q1 2023

Los Angeles County’s industrial net absorption during the quarter is:
- -3,870,528 square feet in Q1 2024
- down significantly from -414,935 square feet in Q4 2023
- down from -3,606,403 square feet in Q1 2023
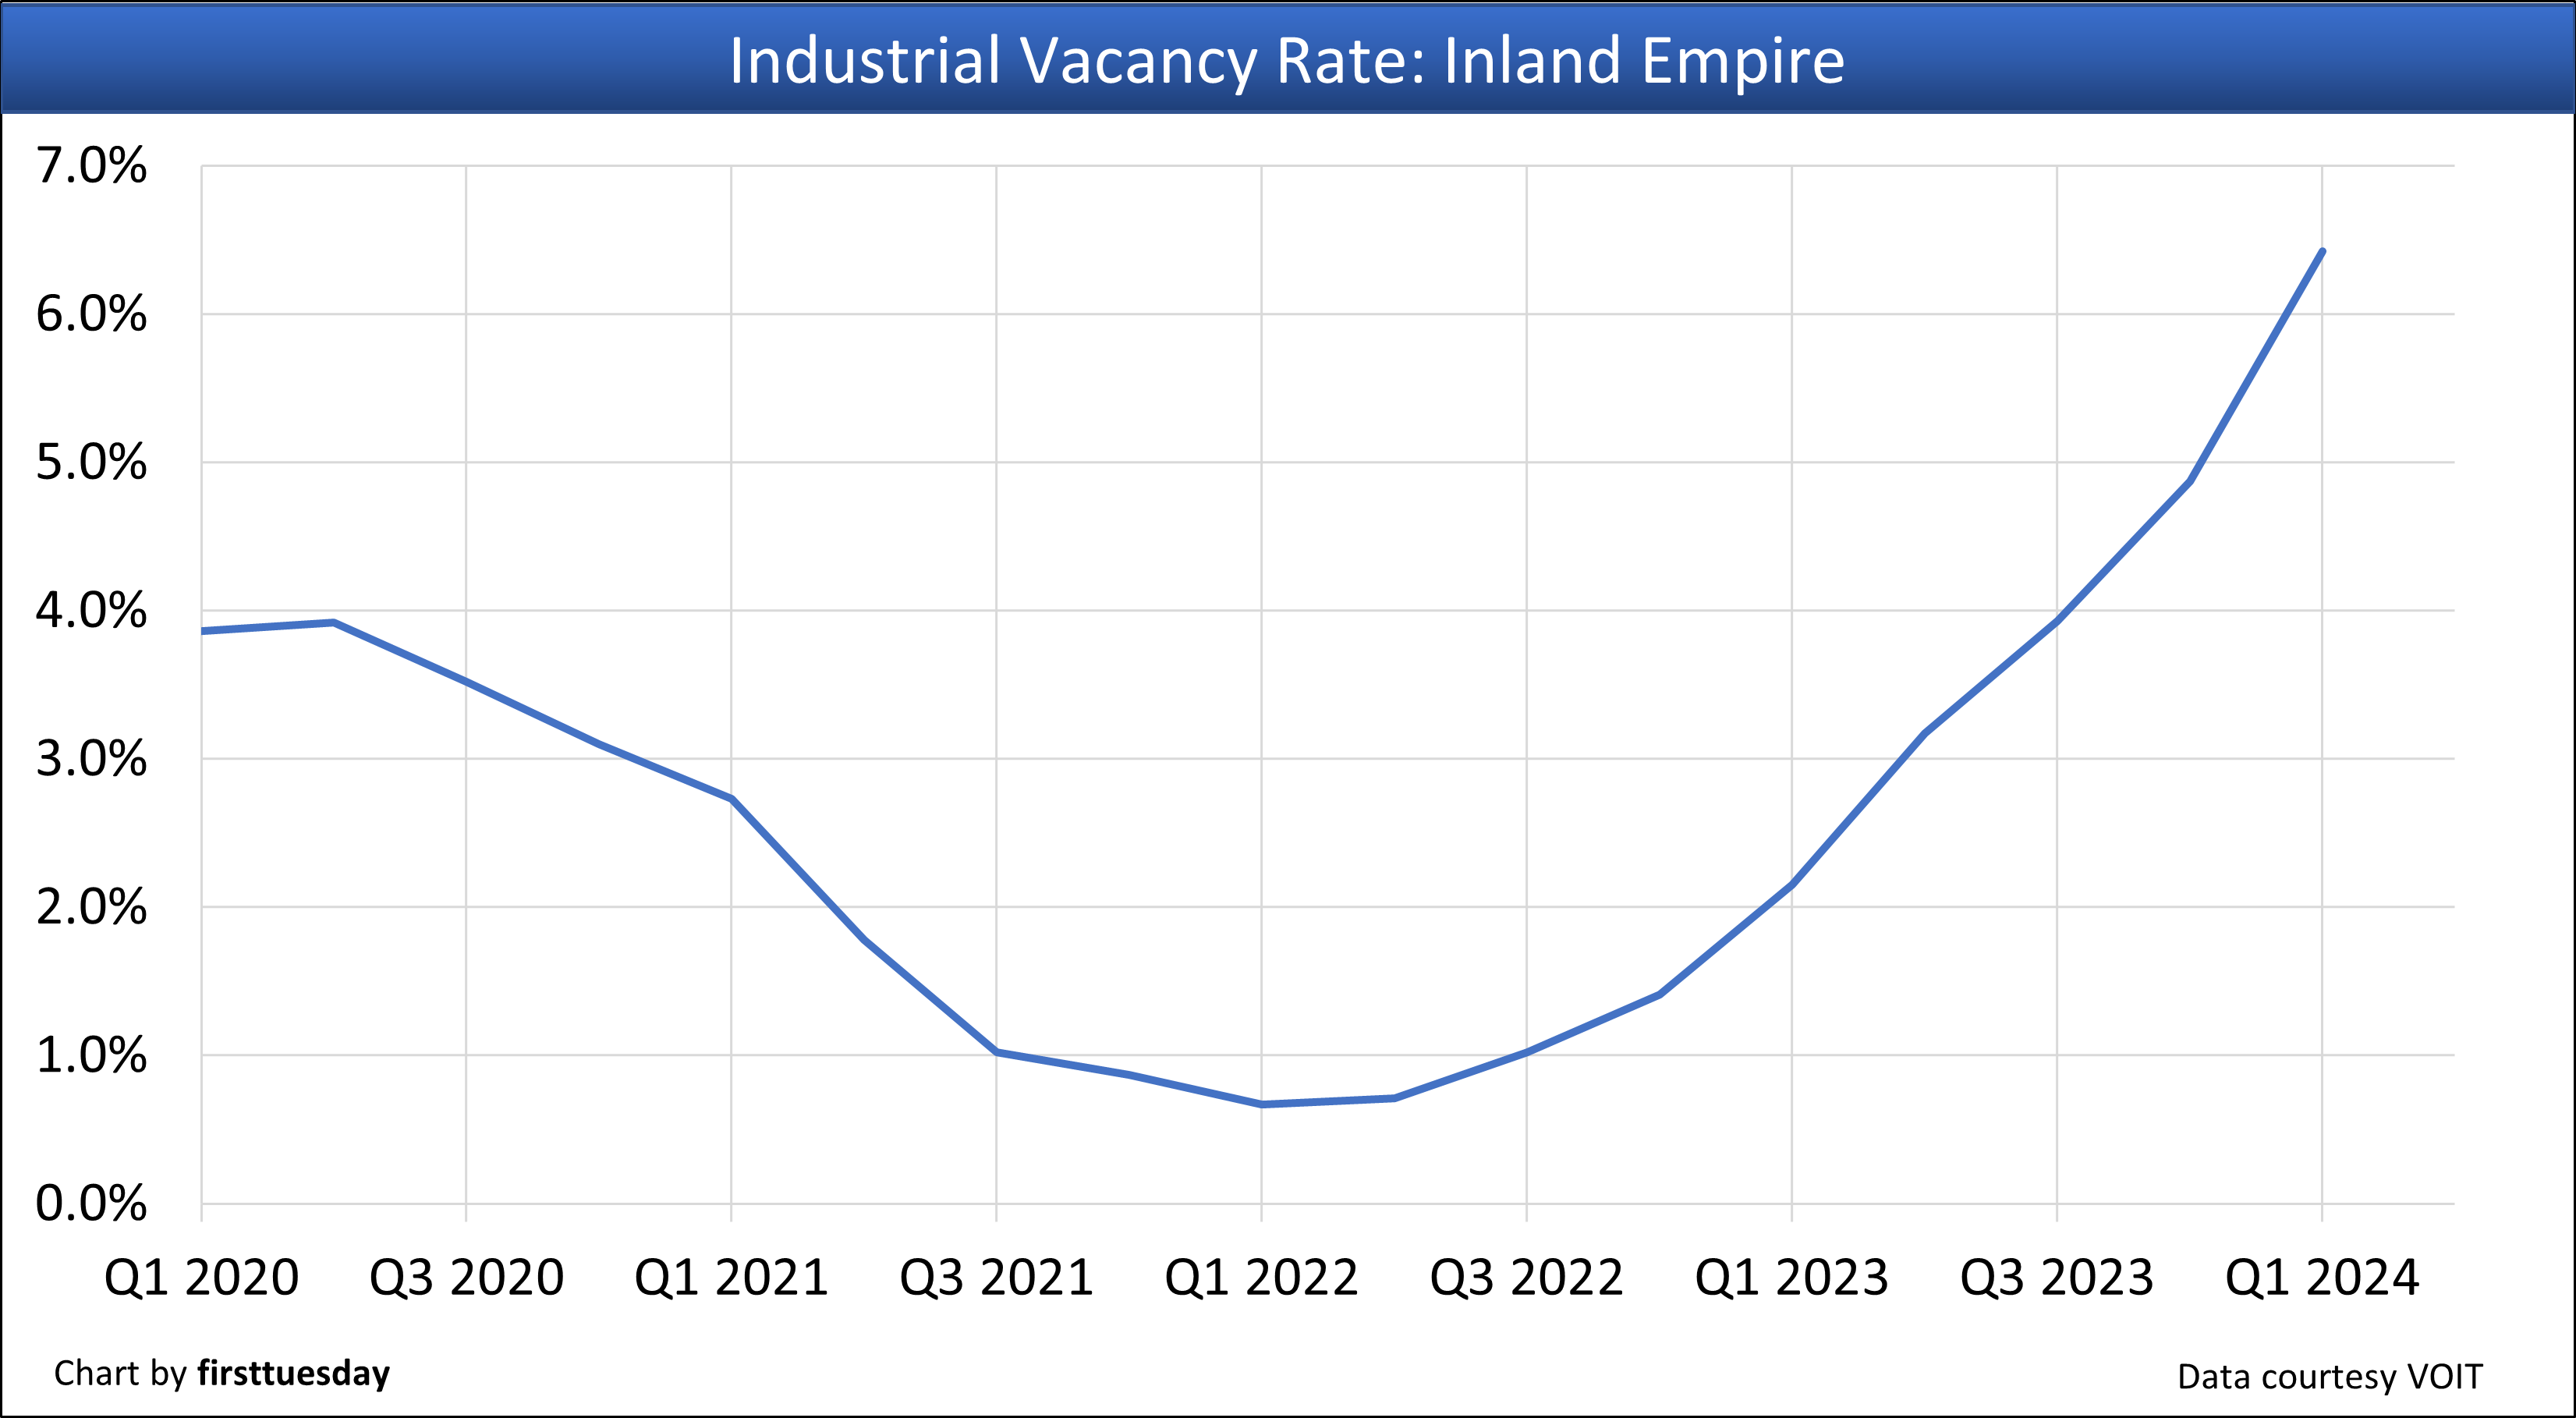
Inland Empire — industrial
The Inland Empire’s industrial vacancy rate is:
- 6.42% in Q1 2024
- up from 4.87% in Q4 2023
- 4.3 percentage points above the vacancy rate of 2.15% in Q1 2023
The Inland Empire’s industrial net absorption during the quarter is:
- -2,170,786 square feet in Q1 2024
- down significantly from +1,320,786 square feet in Q4 2023
- down significantly from +3,063,631, square feet in Q1 2023
Related article:


