The fourth quarter (Q4) 2023 reports on the Southern California (SoCal) commercial market are in, courtesy of VOIT Real Estate Services.
SoCal’s commercial market softened even further this quarter. Though demand remains higher for industrial compared to retail and office space, all commercial classes are experiencing a slowdown in activity and development.
San Diego County — industrial, retail and office
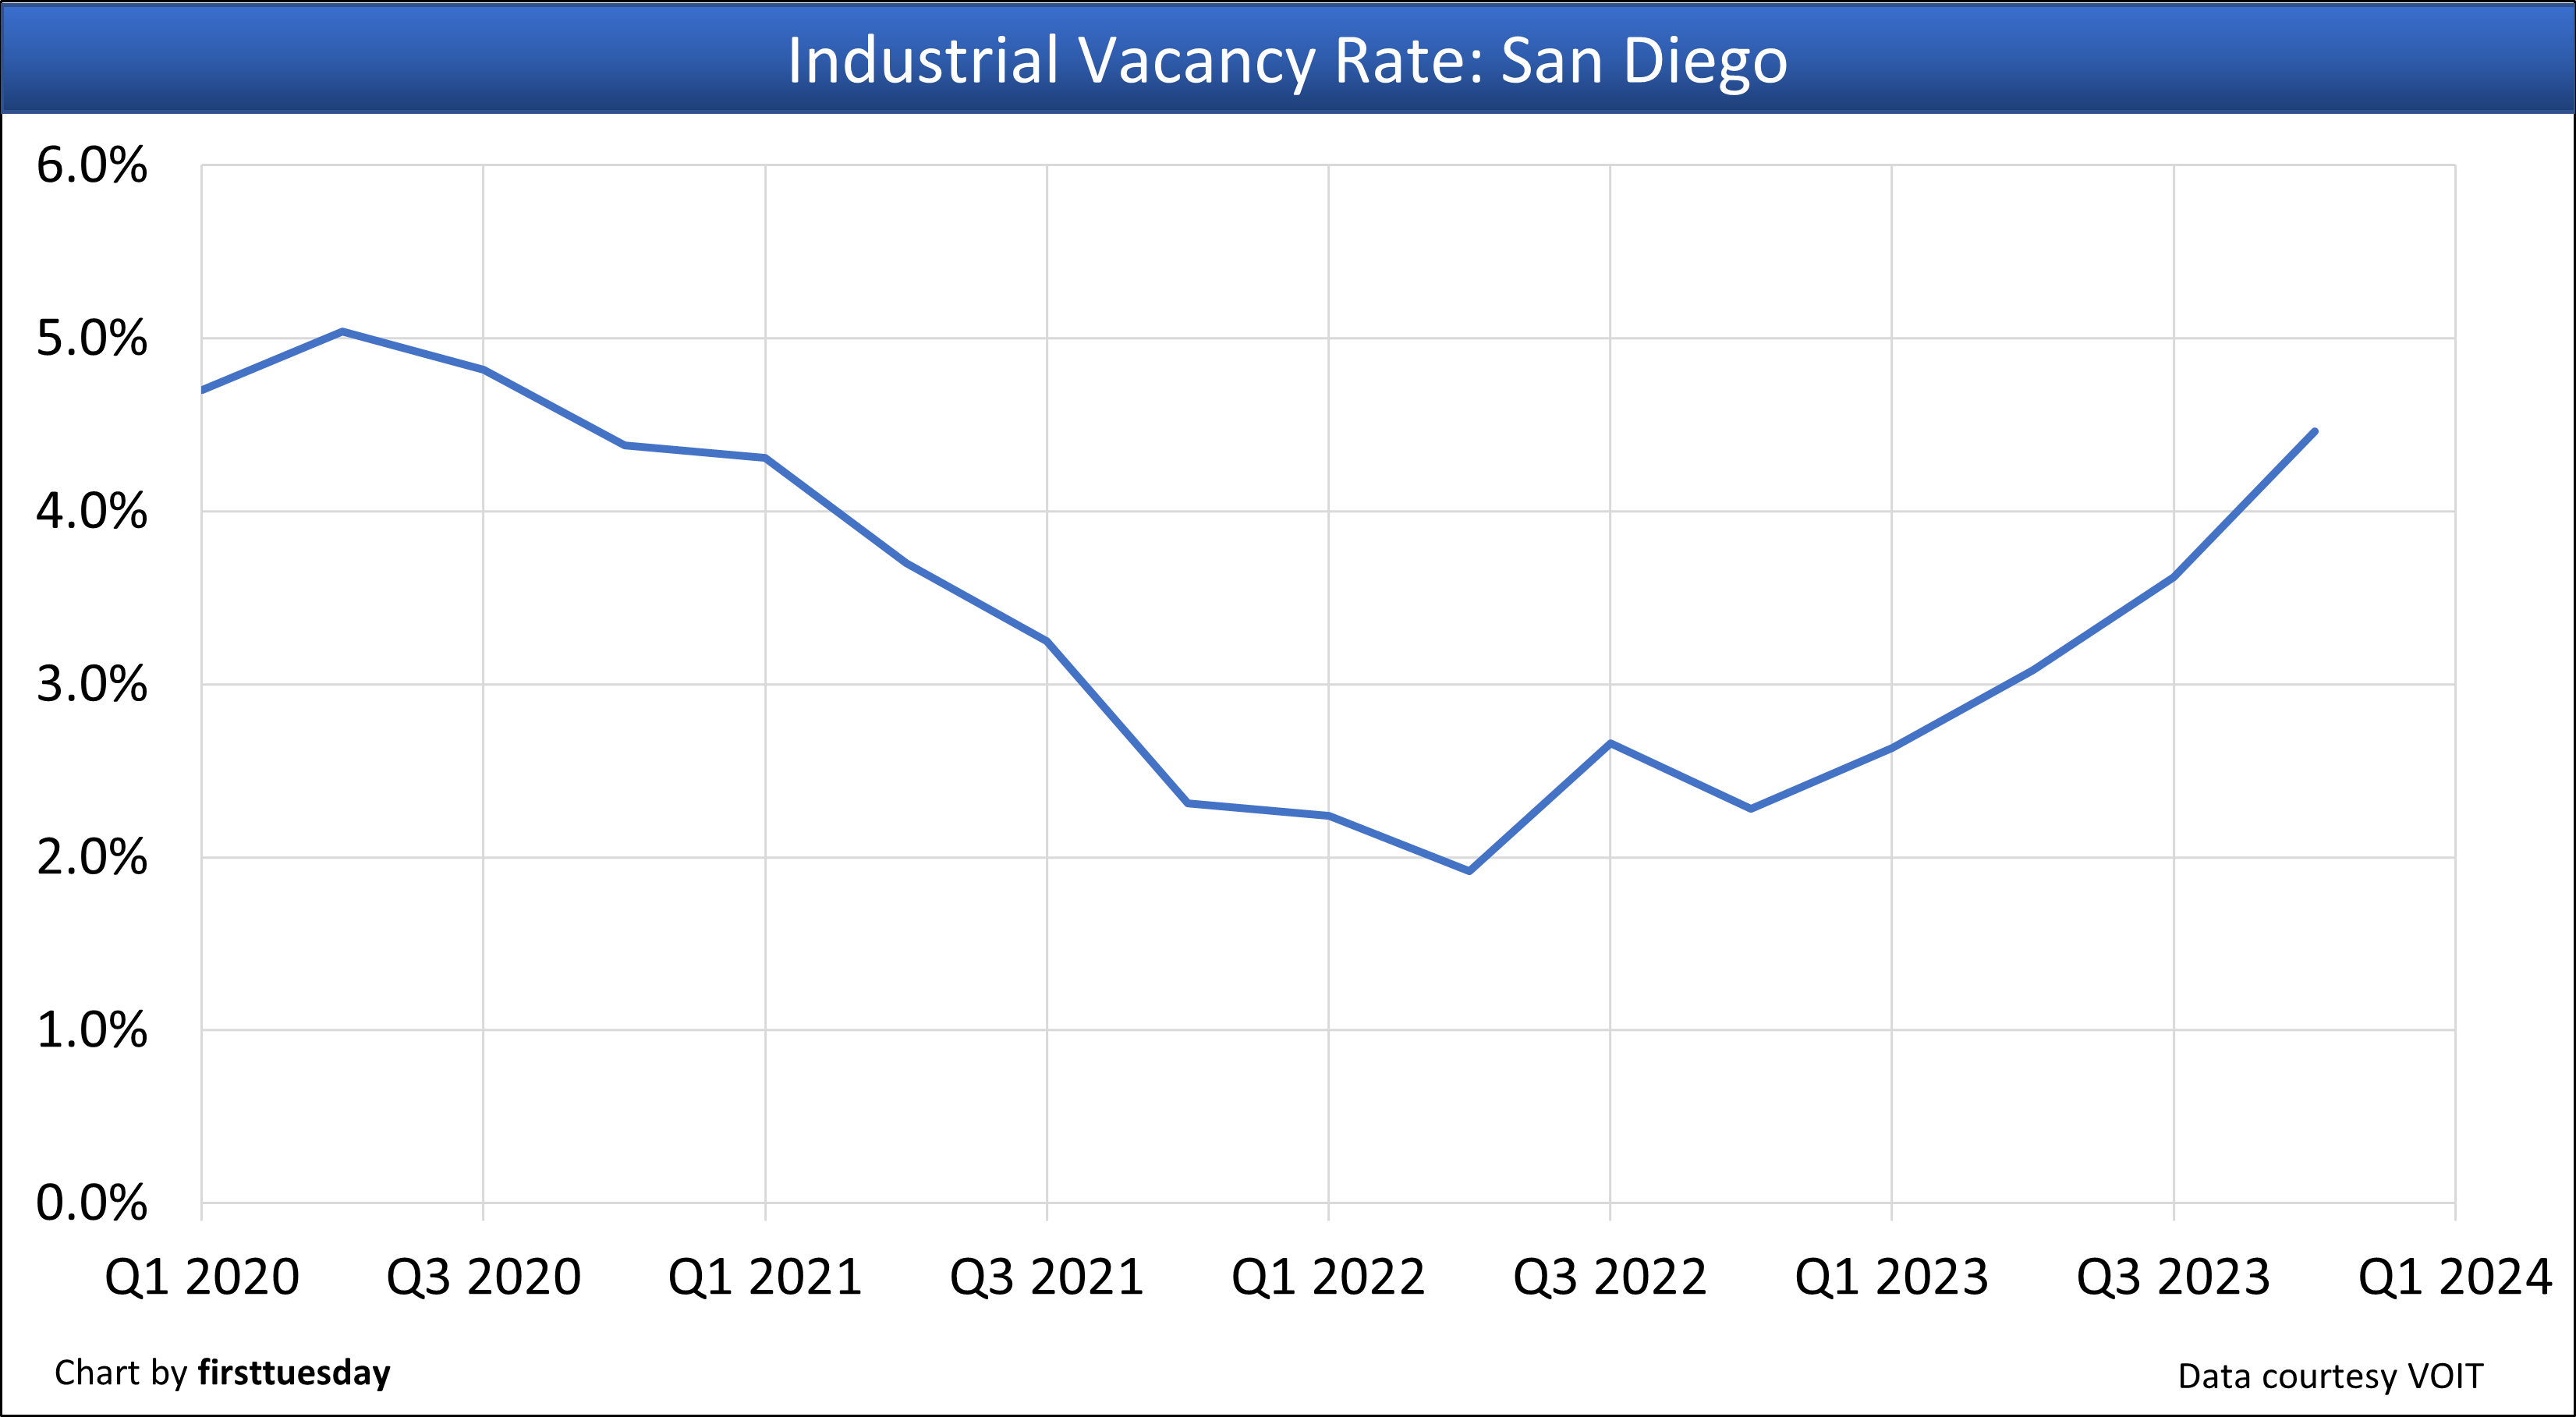
San Diego County’s industrial vacancy rate is:
- 4.46% in Q4 2023;
- up from 3.62% in Q3 2023; and
- well above the vacancy rate of 2.28% in Q4 2022.
San Diego County’s retail vacancy rate is:
- 3.83% in Q4 2023;
- slightly down from 3.96% in Q3 2023; and
- slightly below the vacancy rate of 3.93% in Q4 2022.
San Diego County’s office vacancy rate is:
- 11.75% in Q4 2023;
- down from 12.11% in Q3 2023; and
- slightly above the vacancy rate of 11.47% in Q4 2022.
San Diego County’s industrial net absorption — the total change in occupied industrial space during the quarter — is:
- +240,559 square feet in Q4 2023;
- up slightly from +226,955 square feet in Q3 2023; and
- up from +206,511 square feet in Q4 2022.
San Diego County’s retail net absorption — the total change in occupied retail space during the quarter— is:
- +18,351 square feet in Q2 2023;
- up from -394,774 square feet in Q1 2023; and
- down from +414,640 square feet in Q2 2022.
San Diego County’s office net absorption — the total change in occupied office space during the quarter — is:
- -33,561 square feet in Q4 2023;
- up slightly from -36,792 square feet in Q3 2023; and
- down from +11,252 square feet in Q3 2022.
Orange County — industrial and office
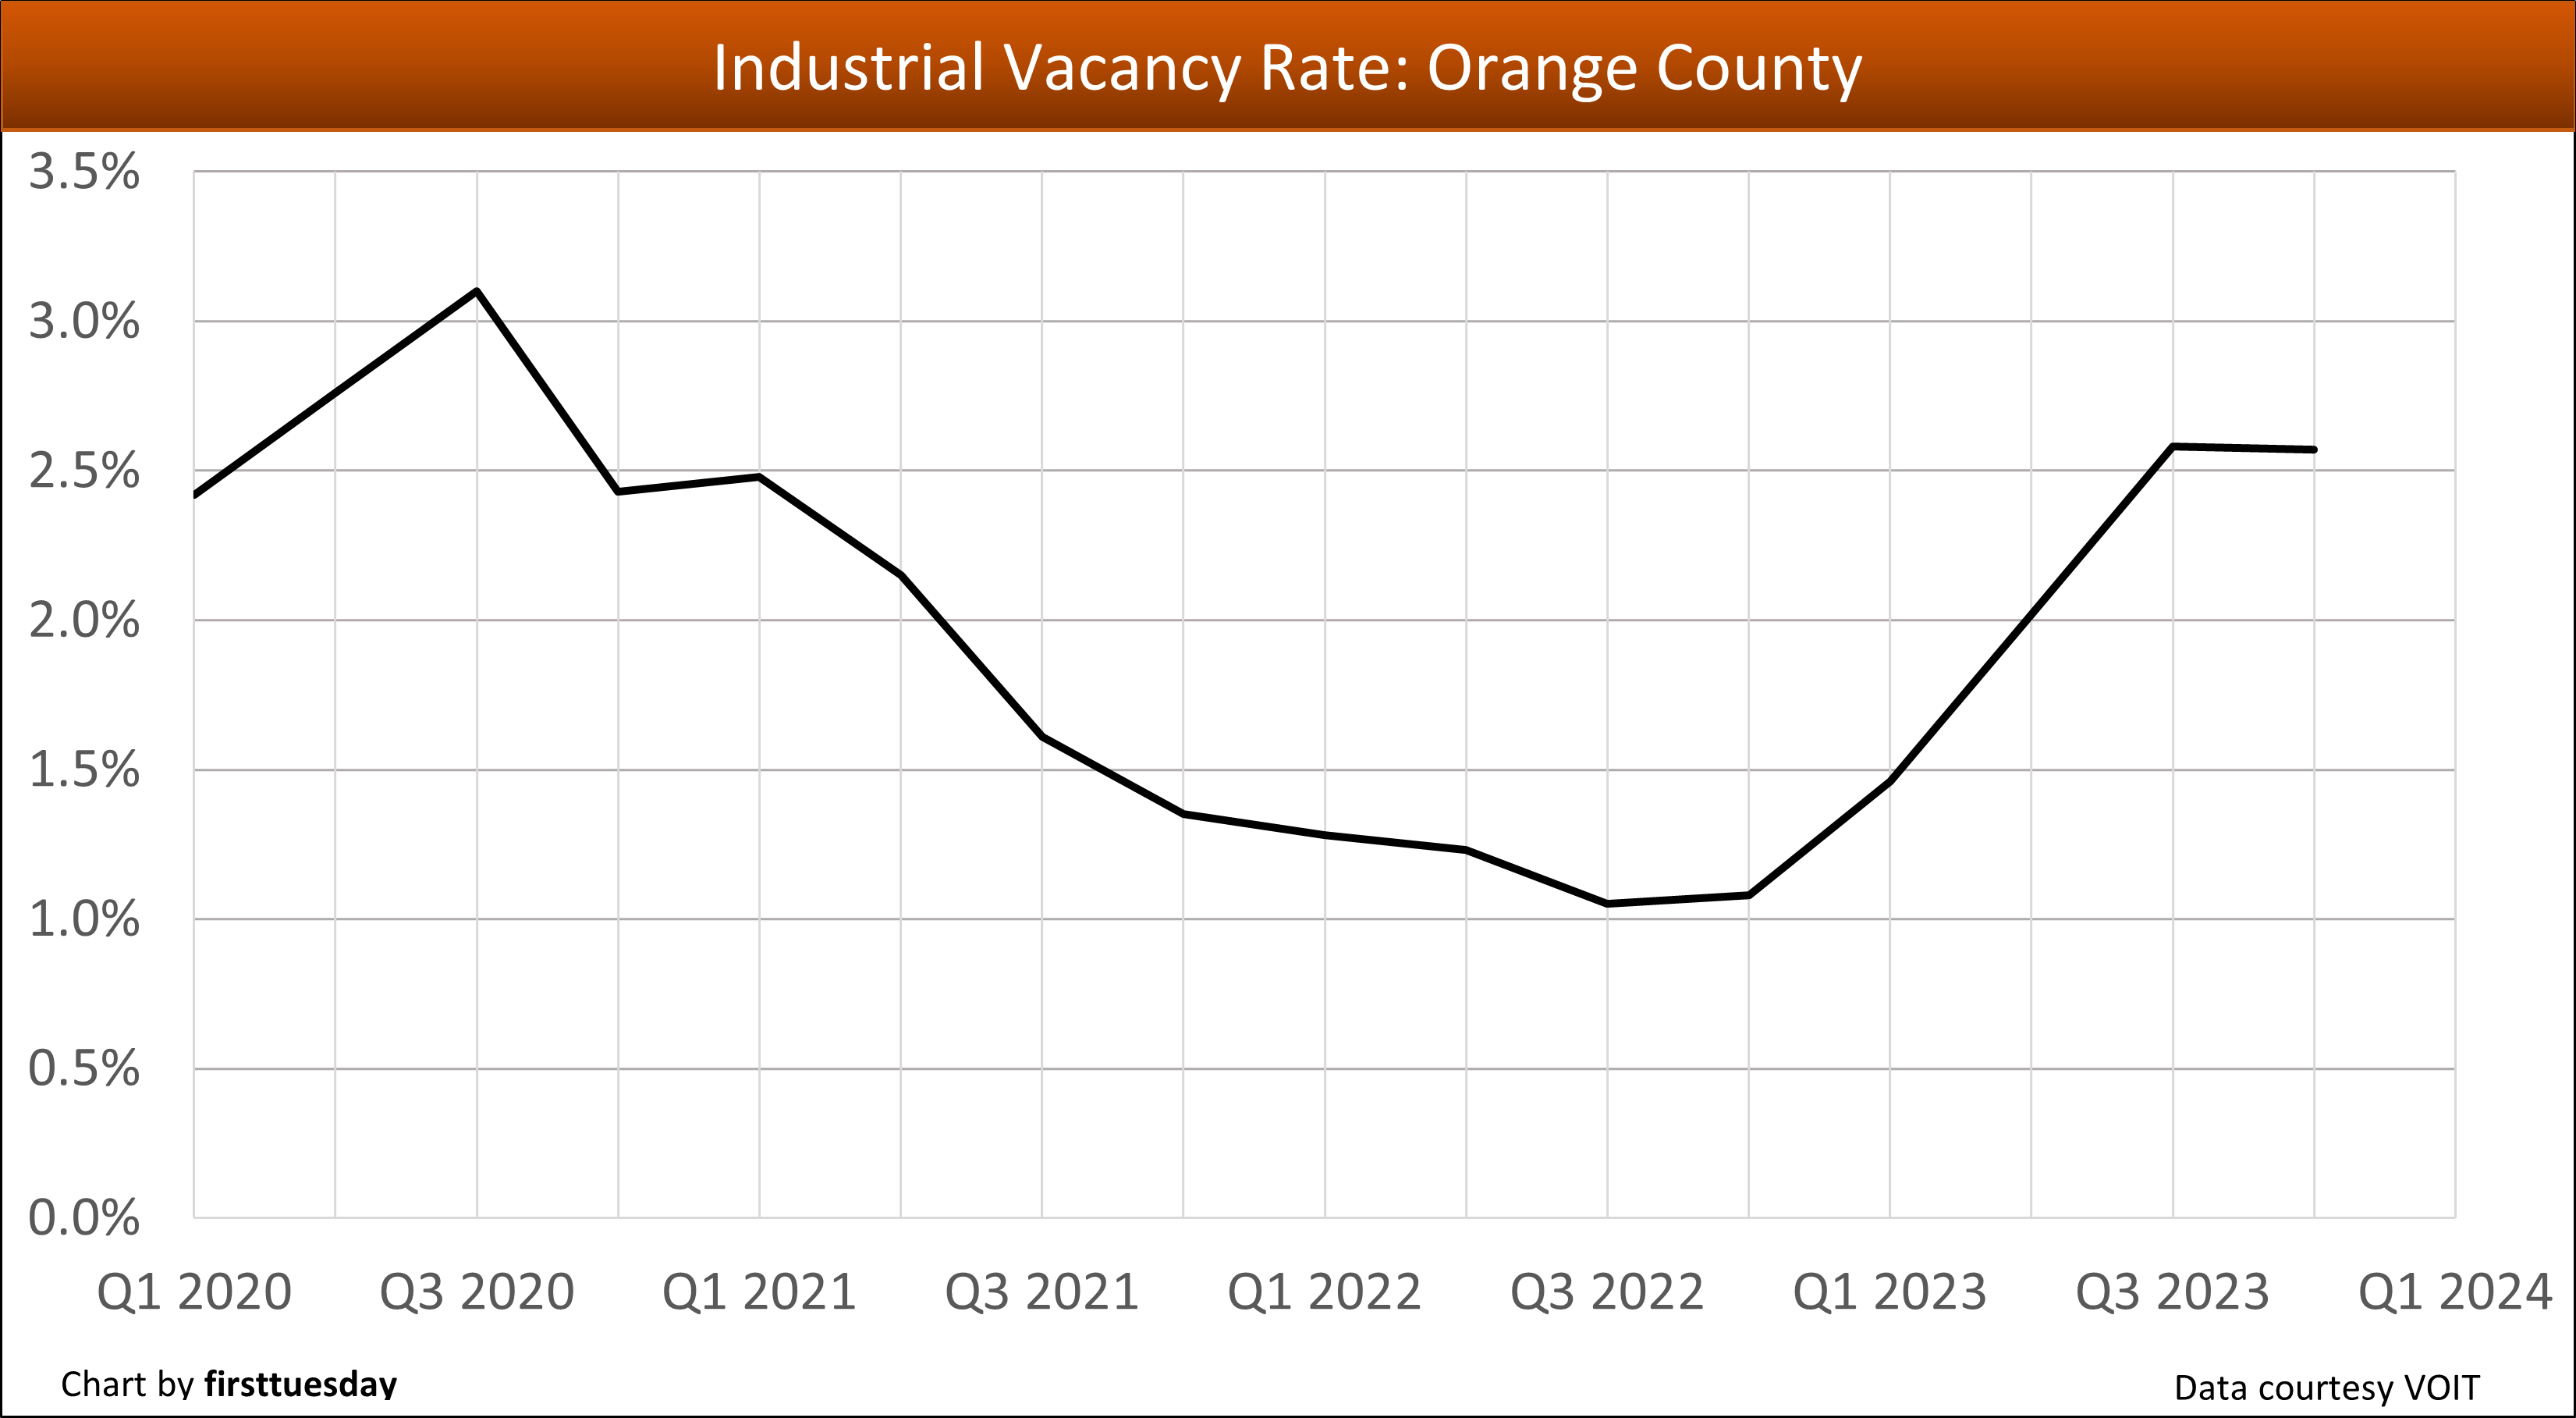
Orange County’s industrial vacancy rate is:
- 2.57% in Q4 2023;
- down slightly from 2.58% in Q3 2023; and
- above the vacancy rate of 1.08% in Q4 2022.
Orange County’s office vacancy rate is:
- 17.27% in Q4 2023;
- slightly down from 17.47% in Q3 2023; and
- above the vacancy rate of 15.75% in Q4 2022.
Orange County’s industrial net absorption during the quarter is:
- -202,662 square feet in Q3 2023;
- up from -423,503 square feet in Q2 2023; and
- down significantly from +2,644,930 square feet in Q4 2022.
Orange County’s office net absorption during the quarter is:
- +366,886 square feet in Q4 2023;
- up from -403,741 square feet in Q3 2023; and
- up significantly from -787,025 square feet in Q4 2022.
Los Angeles County — industrial
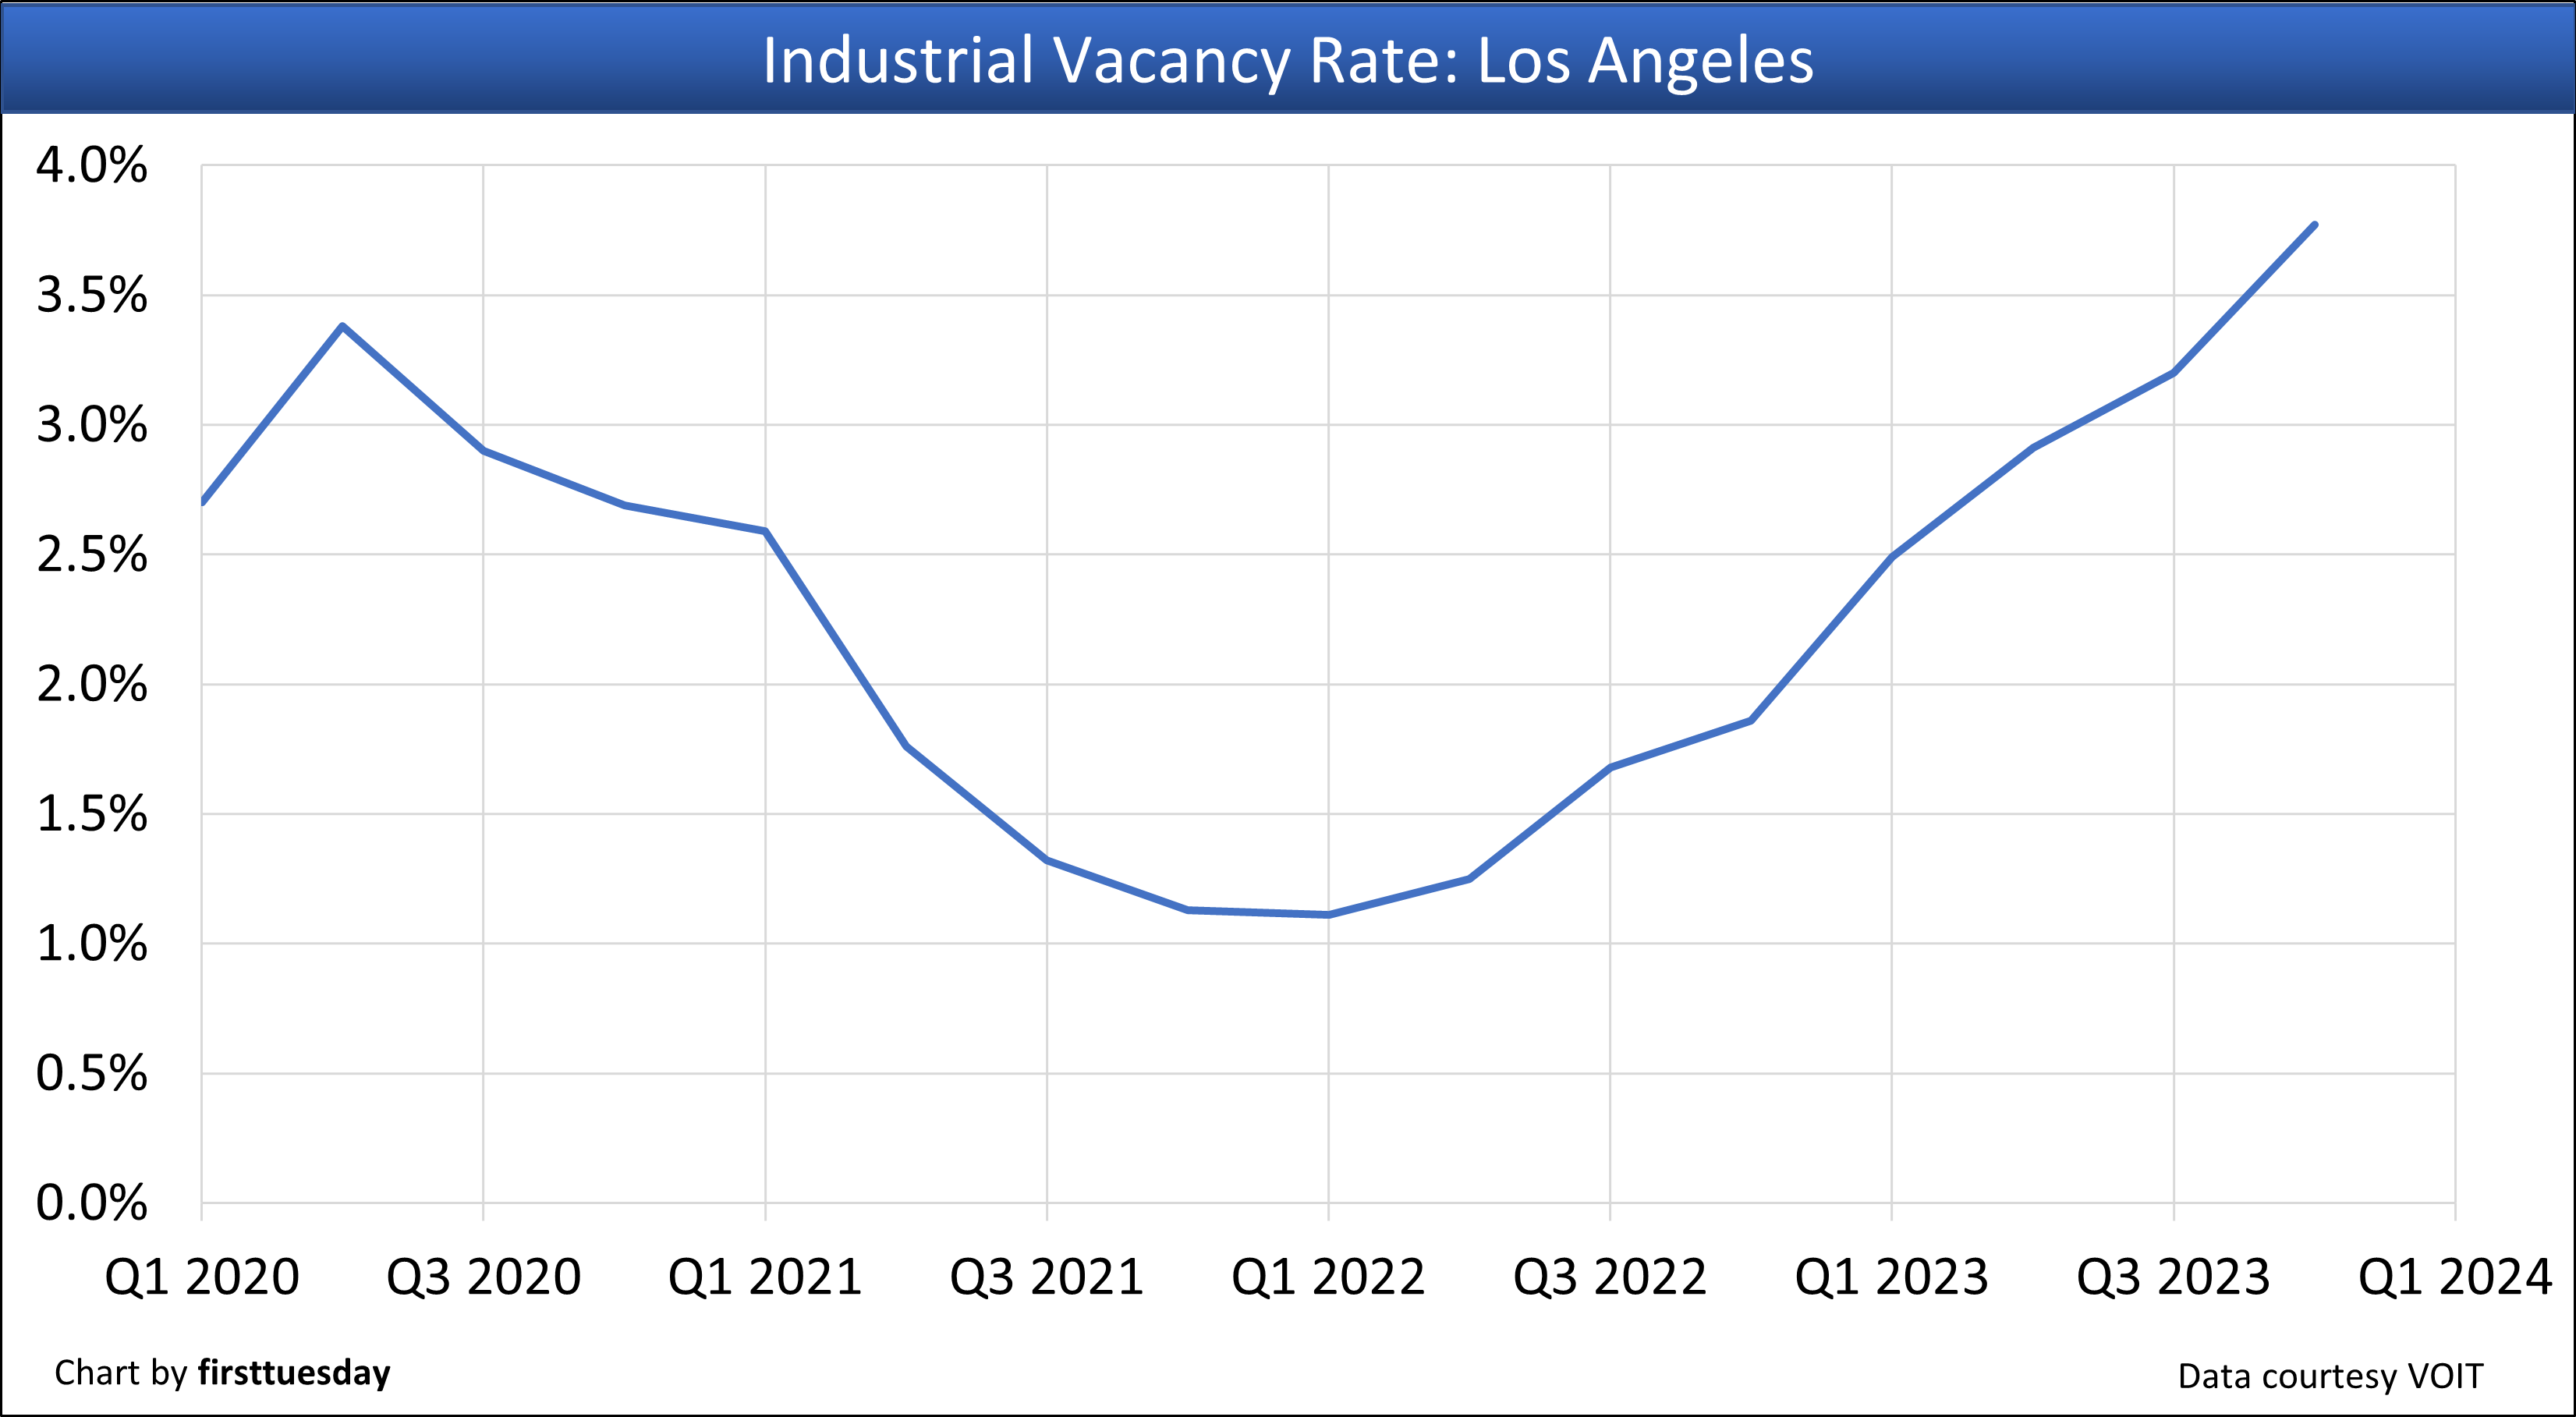
Los Angeles County’s industrial vacancy rate is:
- 3.77% in Q4 2023;
- up from 3.20% in Q3 2023; and
- above the vacancy rate of 1.86% in Q4 2022.
Los Angeles County’s industrial net absorption during the quarter is:
- -414,935 square feet in Q4 2023;
- up significantly from -1,414,571 square feet in Q3 2023; and
- up from -712,266 square feet in Q4 2022.
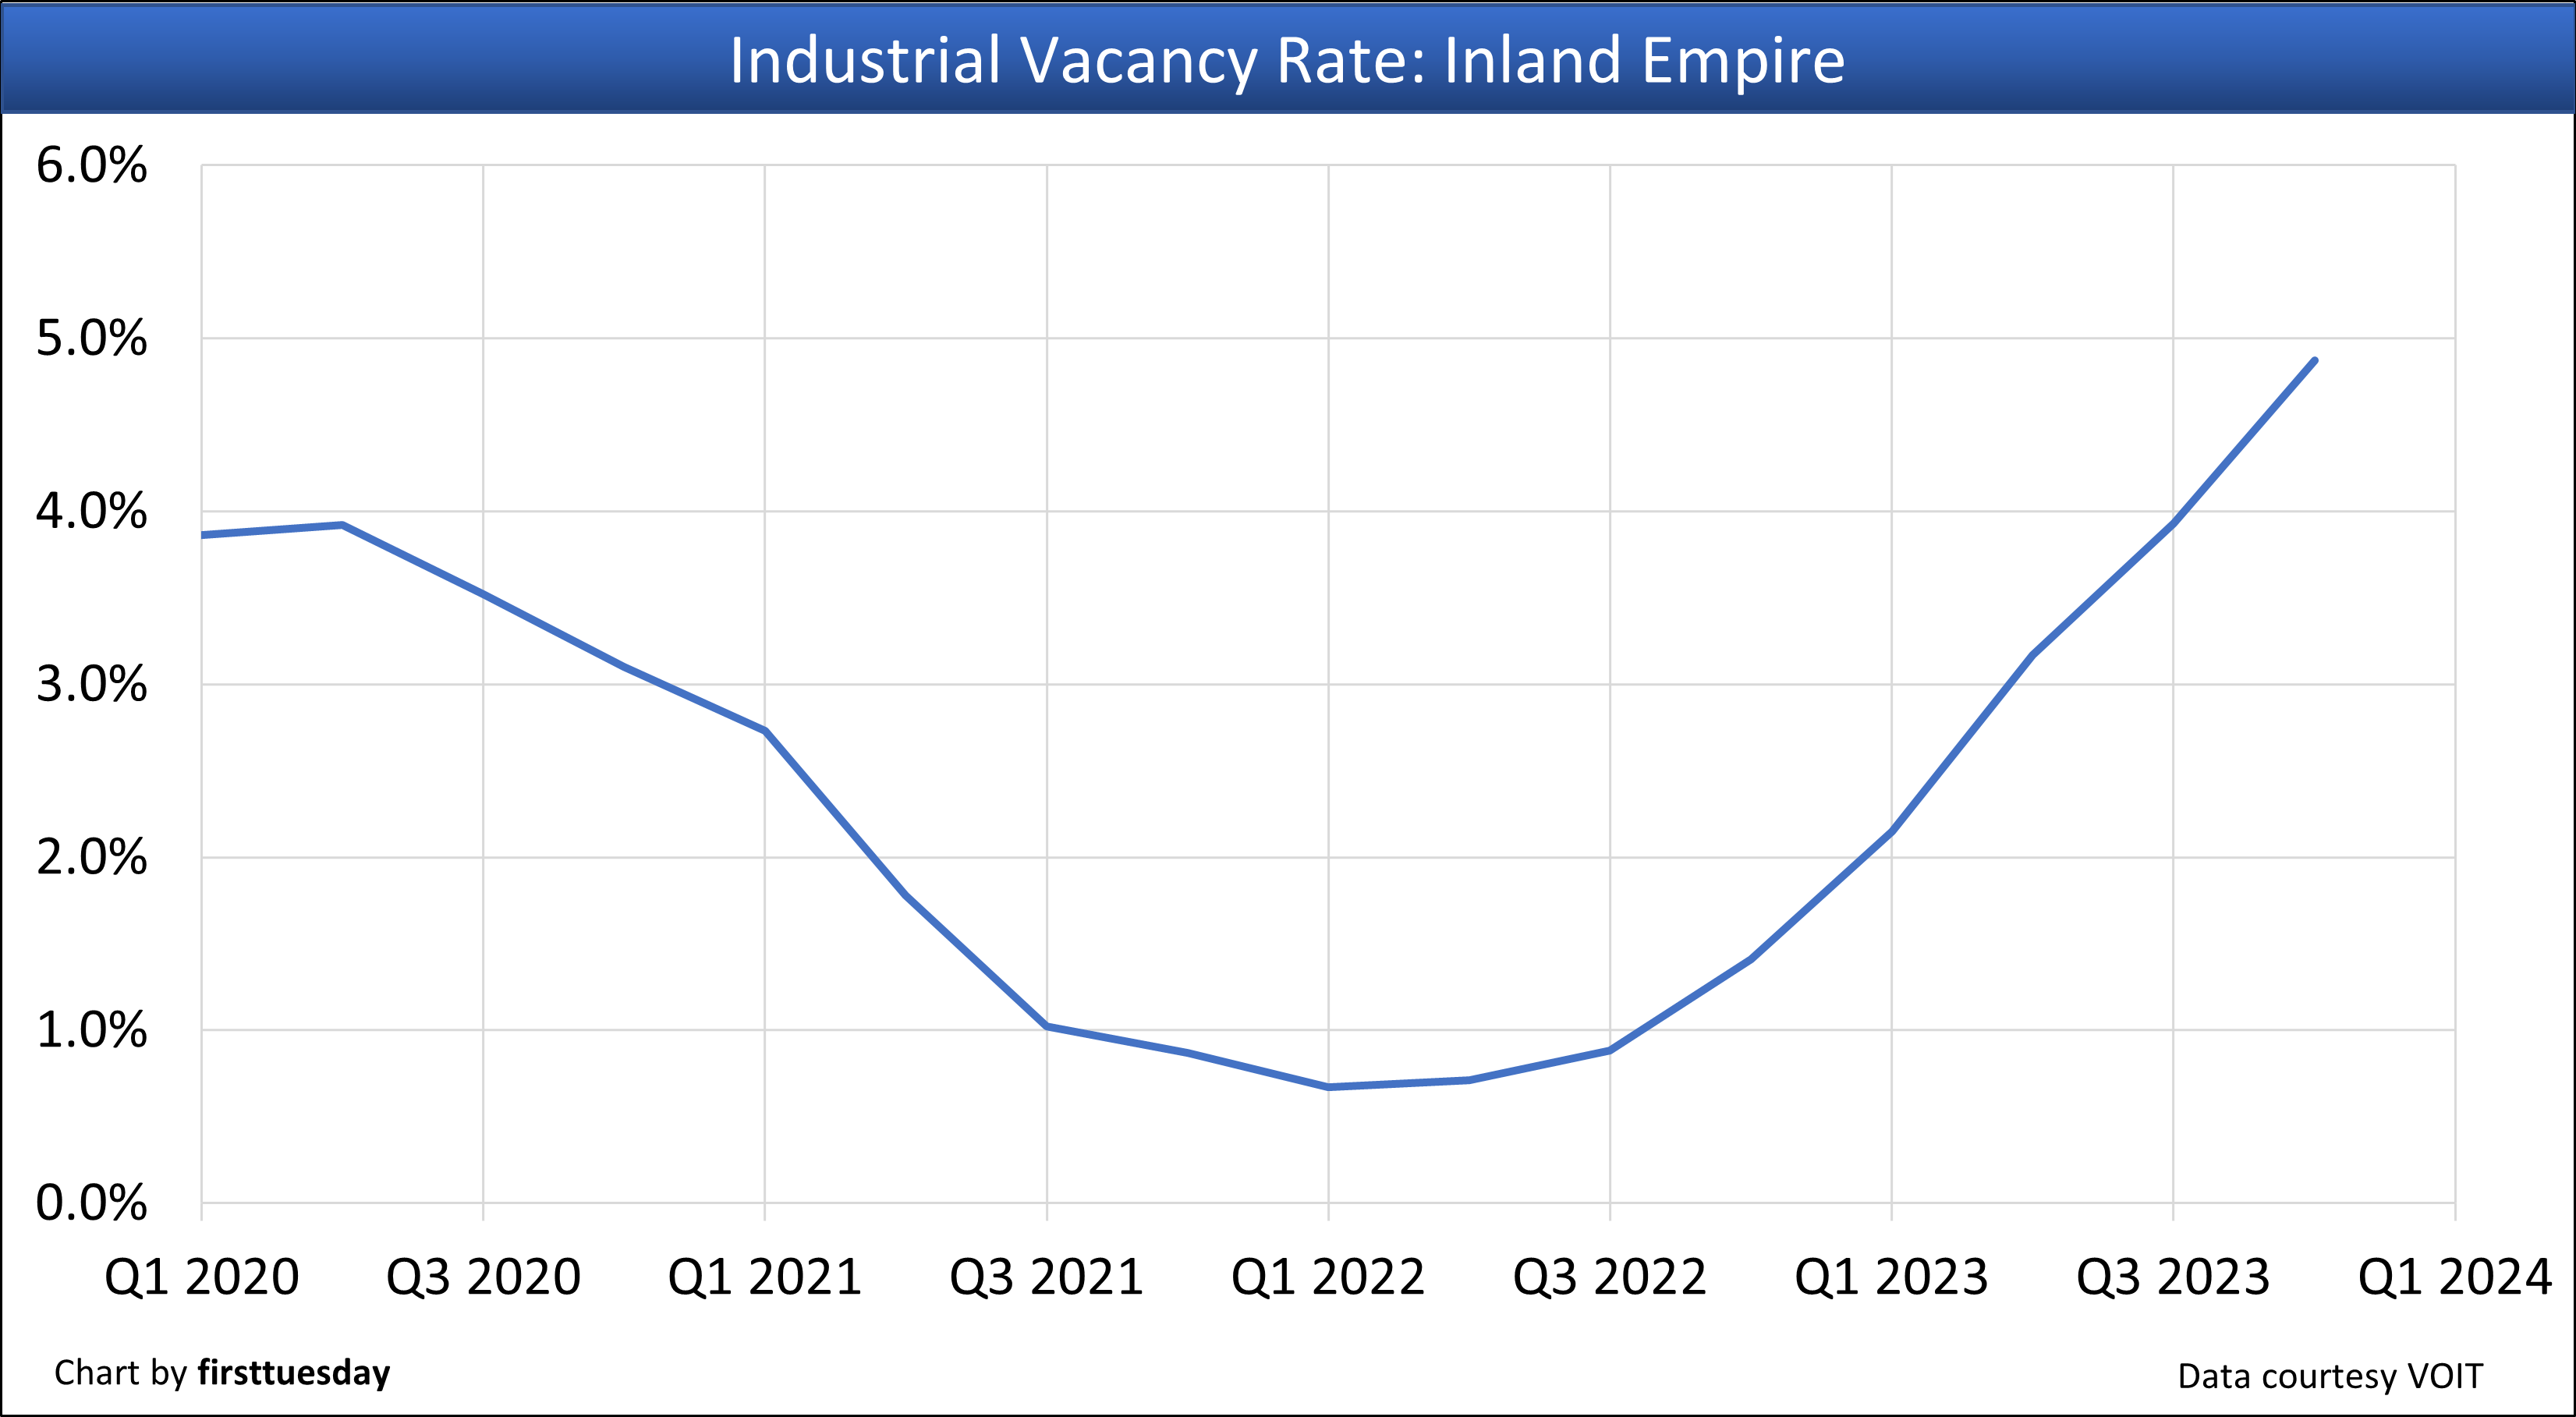
Inland Empire — industrial
The Inland Empire’s industrial vacancy rate is:
- 4.87% in Q4 2023;
- up from 3.93% in Q3 2023; and
- well above the vacancy rate of 1.41% in Q4 2022.
The Inland Empire’s industrial net absorption during the quarter is:
- +1,320,786 square feet in Q3 2023;
- down from +1,506,645 square feet in Q2 2023; and
- down significantly from +2,152,486 square feet in Q2 2022.
Related article:


