
Why this matters: San Francisco tends to be a step ahead of the rest of the state in terms of economic trends, making it a weathervane for California’s economy and real estate market.
Homeownership spiraling down
San Francisco is a unique region in California’s housing landscape. Here, jobs and home values recovered quickly following the 2020 recession due to the presence of the high-paying tech industry. However, now that pandemic-era stimulus has run dry and interest rates have resumed their upward march, the Bay Area housing market is attempting to find a solid footing in 2026 — a task hindered by low inventory, faltering home prices and a constricting jobs market.
The elevated buyer dissatisfaction stemming from the distorting confluence of high property prices, high mortgage rates and limited for-sale inventory dampens ownership by making renting financially far more feasible. Collectively, these conditions cause a housing crisis for tenants and homebuyers alike.
San Francisco’s infamously high home prices began to tumble in mid-2022, the result of rising mortgage rates which immediately cut buyer purchasing power for purchase-assist mortgage funding and the end of pandemic stimulus efforts. Since then, prices have bumped along, sometimes rising, but never beyond the rate of inflation. Thus, in terms of real value, home values have remained trapped in a steady decline since 2023.
Expect prices to continue their flat performance here until the present trough ends around 2028. The next meaningful recovery — evidenced by prices rising annually beyond the rate of consumer inflation — will arrive by 2030.
For sales agents, look to recession-proof your practice to ensure the continuing success of your real estate career during the ongoing slump in fee-producing transactions. The opportunity for brokers is to get into other services as a provider. Brokers initially get the leads needed by providers, a task made easier by representing the principals involved.
View the charts below for current activity and forecasts for San Francisco’s housing market.
Updated June 25, 2026.
Home sales volume stays low
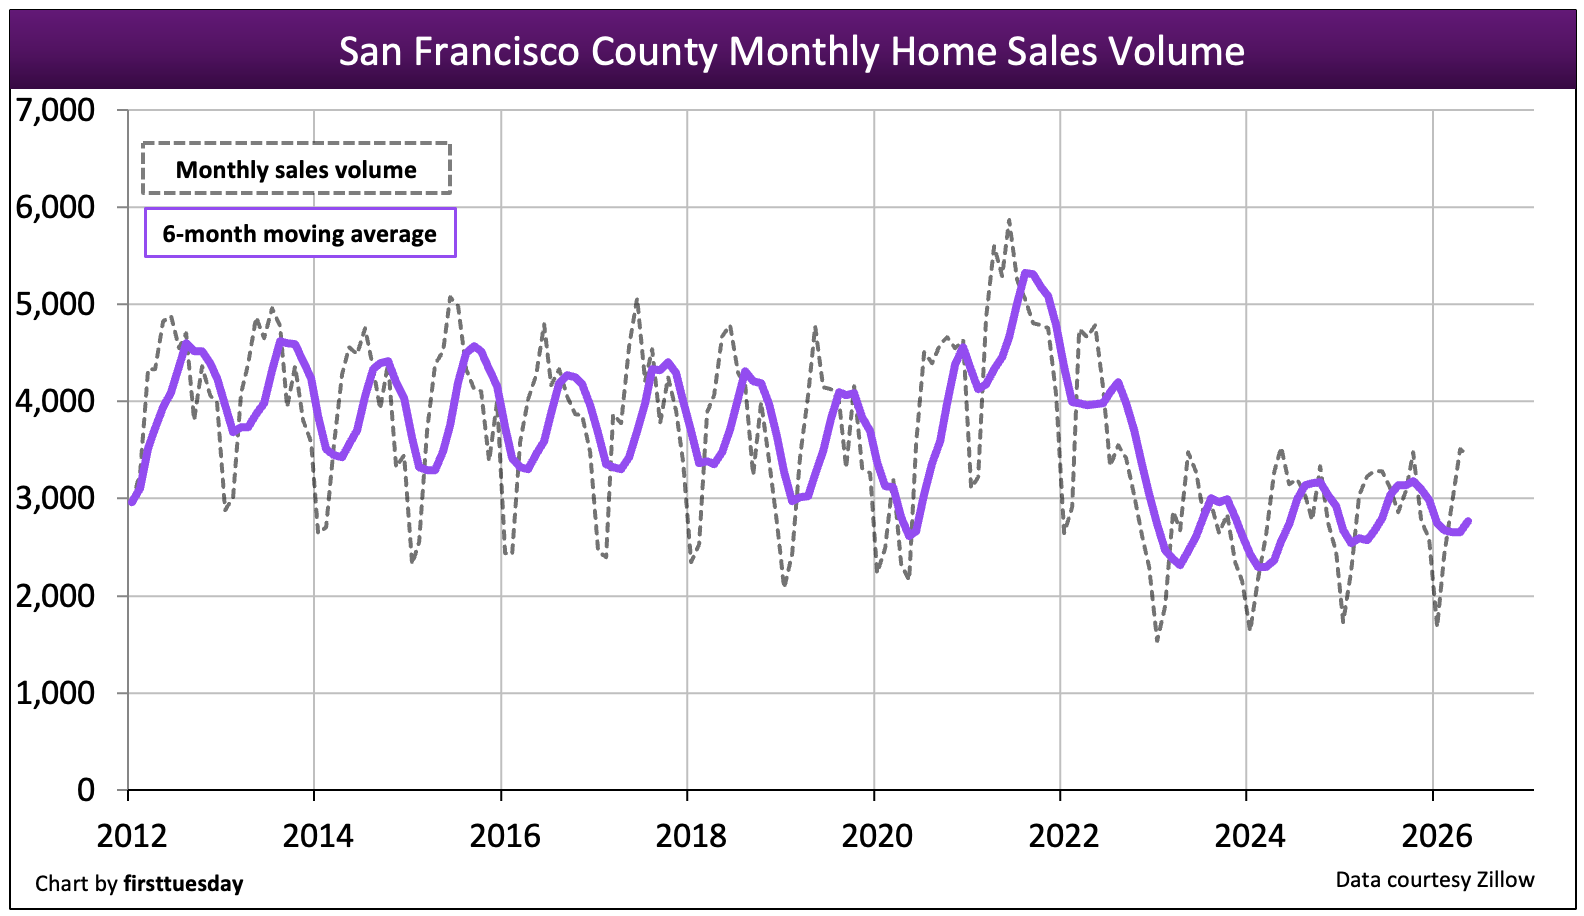
Chart update 06/25/26
| 2025 | 2024 | Annual change | |
| San Francisco County home sales volume | 5,400 | 4,900 | +10% |
Home sales volume in San Francisco County is volatile but has tended to run a step ahead of the rest of the state in terms of trends.
Sales peaked in 2021 due to the reservoir of delayed buyers from 2020 and historically low mortgage rates which cannibalized 2022 buyers, causing 2022 sales to drop. In 2023, annual home sales volume was 25% below a year earlier. This rapid decline has since rebounded, with 2025 sales volume rising 10% over the prior year.
The pace of growth has fallen back in 2026, as home sales volume in San Francisco is a slight 4% lower than YTD sales a year earlier as of May 2026. Based on current sales volume trends, expect sales volume to end the year flat-to-down.
Buyer caution, not an inability to buy, now keeps more buyers on the sidelines. The unwillingness to buy in the recent soft downward trend is fed by the lack of clarity about job opportunities, the global trade wars, mortgage funding and the federal war on California’s huge immigrant population.
California has reasons for its position as the fourth largest economy in the world. The state has unparalleled geography and a coherence of government, business and population that other states can only watch.
As we make our way into the fast-developing economic recession, look for home sales volume and prices to fall back further, likely ended by 2028. Understandably, homebuyers sit out a declining real estate market until they observe prices bottom and begin to rise.
Related article:
Inventory rises again from historic lows
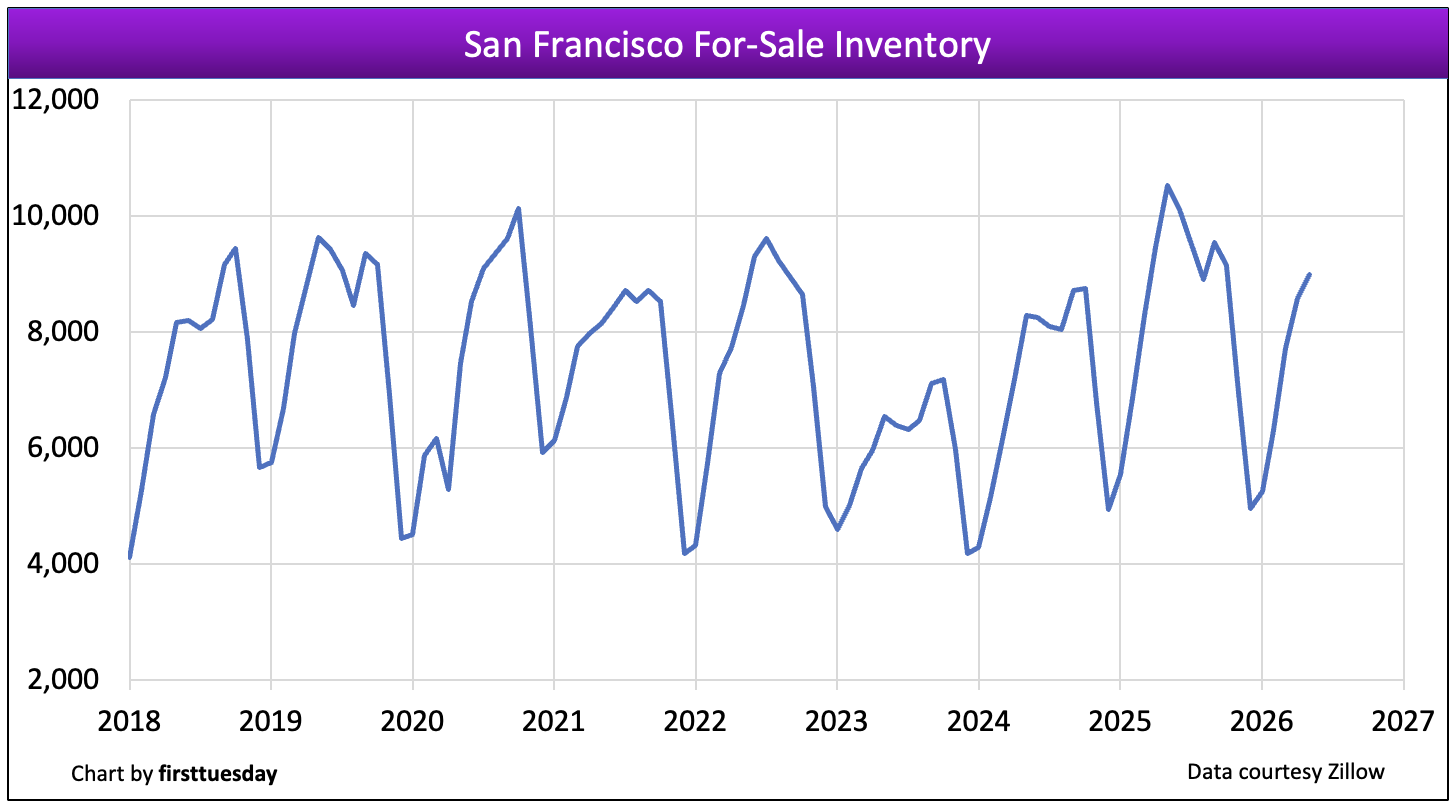
Chart update 06/24/26
| May 2026 | May 2025 | Annual change | |
| San Francisco County for-sale inventory | 9,000 | 10,500 | -15% |
Multiple listing service (MLS) inventory has increased from the historic low reached at the end of 2021 and repeated going into 2024. From that low point in early 2024, for-sale inventory climbed in San Francisco during 2025, now falling back 15% below a year earlier as of May 2026.
Rather than increased demand from buyers, today’s reduced inventory more likely signals seller reluctance. Faltering home prices, high interest rates and an uncertain jobs market give sellers little reason to sell in 2026.
Turnover rates return to pre-pandemic era
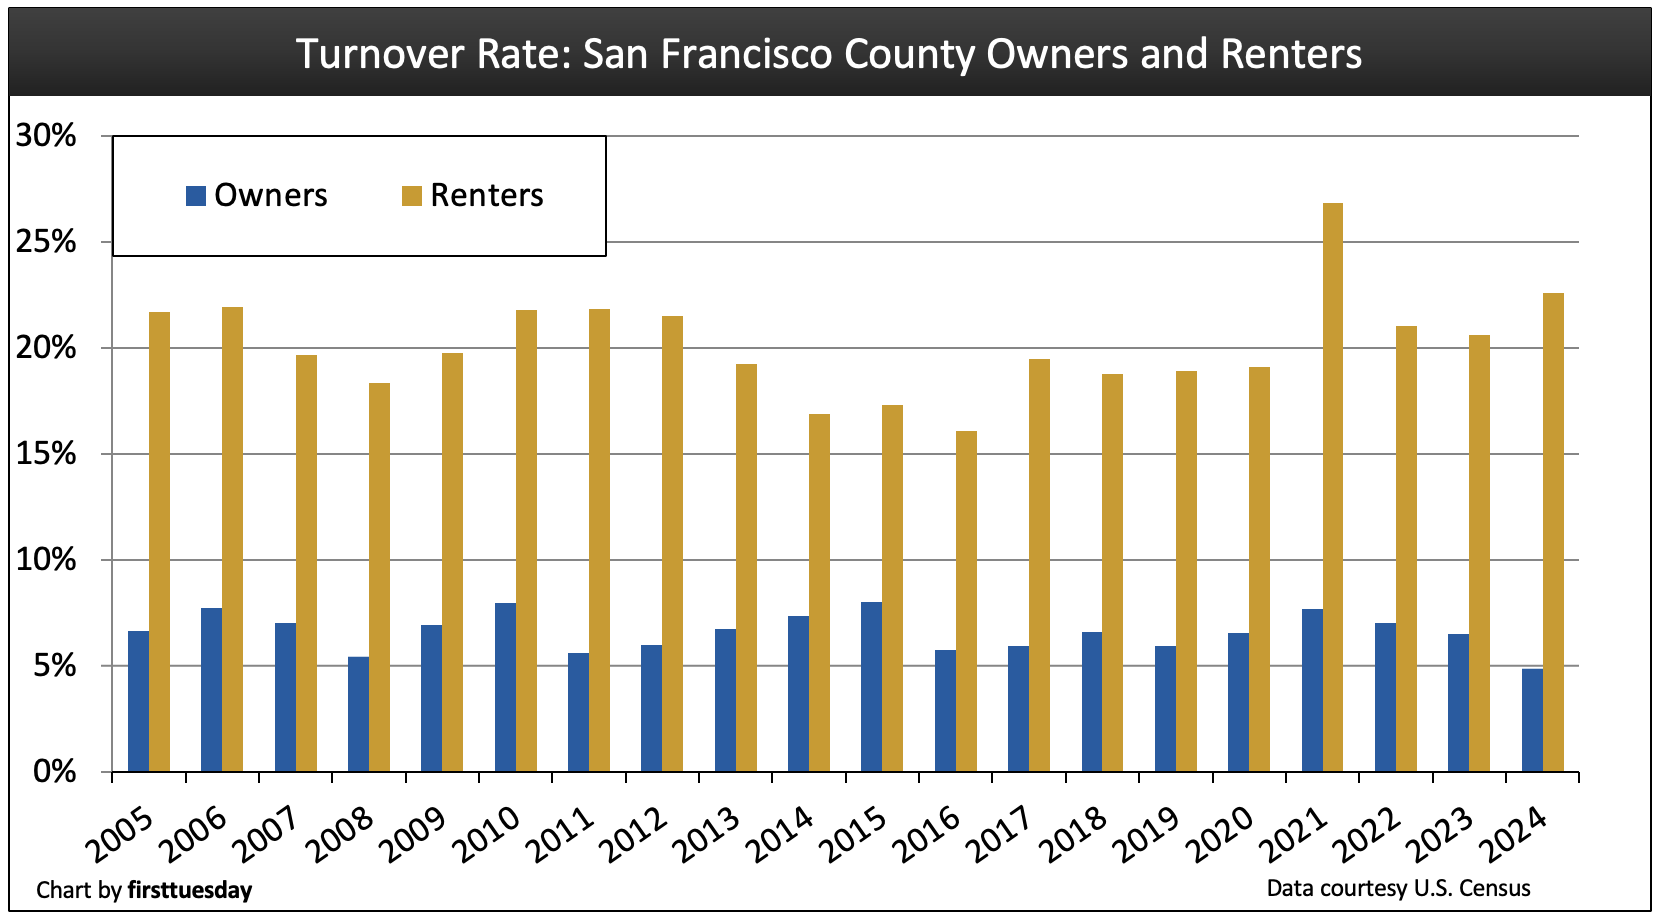
Chart update 12/05/25
| 2024 | 2023 | 2022 | |
| San Francisco County homeowner turnover rate | 4.9% | 6.5% | 7.0% |
San Francisco County renter turnover rate | 22.6% | 20.6% | 21.0% |
San Francisco’s renter turnover rate increase in 2024 to 22.6%, a significant rise from the year prior. The homeowner turnover rate, which produces sales and relocating buyer transactions, fell in 2024 to 4.9%. Based on more recent sales volume trends, the homeowner turnover rate likely continued to decline in 2025.
Renter and homeowner turnover rates indicate both the willingness and corresponding ability of renters and homeowners to move. With the loss of jobs and income during the 2020 recession, turnover rates for renters in San Francisco skyrocketed while homeowners stayed relatively put, as tenants have great mobility compared to owners. The significantly high rents in San Francisco are now swiftly pushing tenants out of the city and into the nearby counties of Alameda and Contra Costa. Those with rent-controlled housing strive to stay put which kills turnover and new construction.
Turnover rates have already fallen from the high levels during the 2021 pandemic buying and moving frenzy. Looking forward, turnover rates will likely fall further in 2025-2026 in reaction to the brakes being firmly placed on the economy heading into Q3-2025. With the 3-year real estate recession ongoing, homeownership will continue its long-term downward trend as homebuyers simply back off ownership until prices bottom and begin an upward turn.
In the meanwhile, expect tenant turnover to decline as tenants tend to remain in rentals when homeownership is much more expensive than rent. Already, prices and sales volume have dropped in this region, which is hyper-reactive to profit swings in the stock market.
Homeownership plummets, a trend with an end
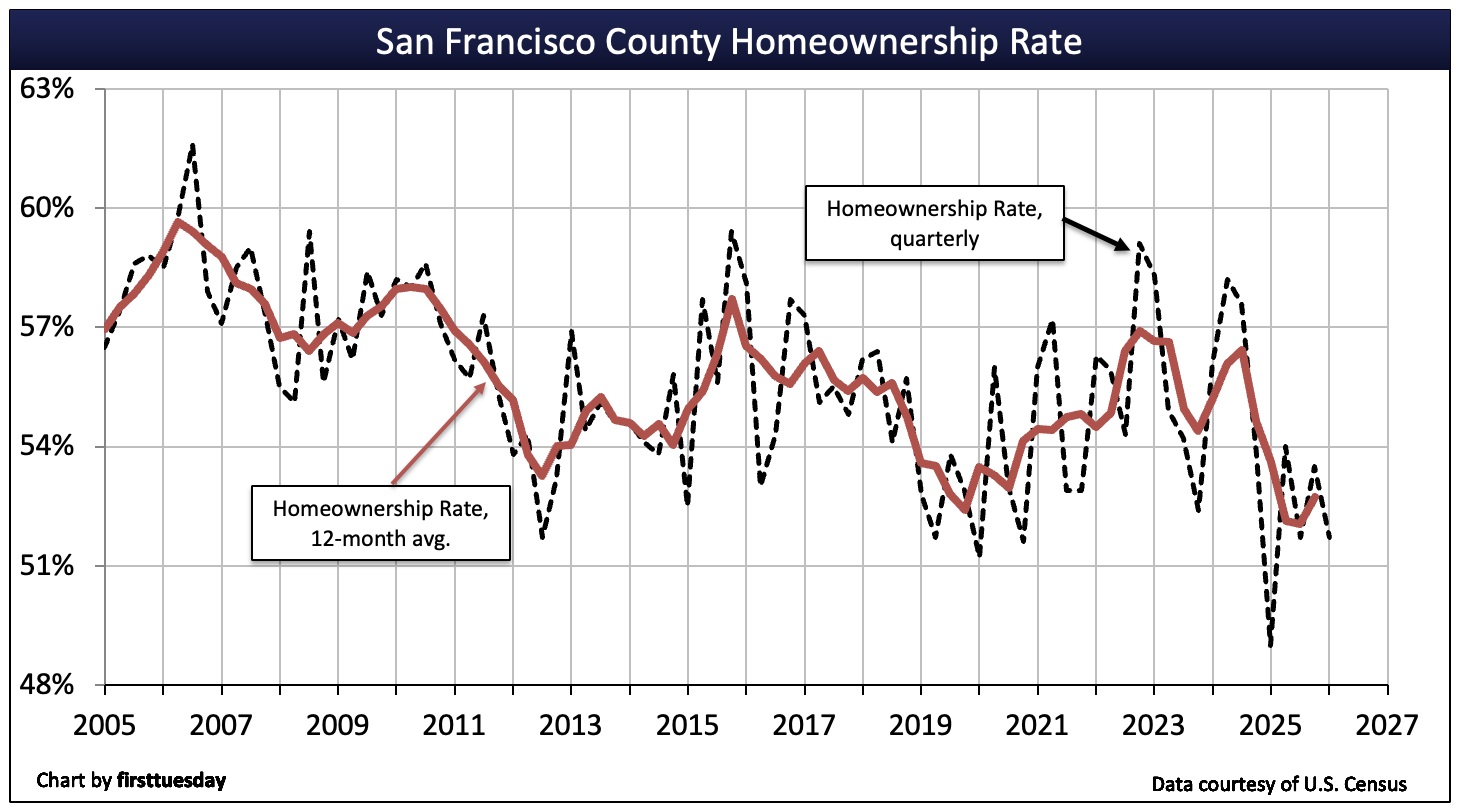
Chart update 06/25/26
| Q1 2026 | Q4 2025 | Q1 2025 | |
| San Francisco County homeownership | 51.7% | 53.5% | 49.0% |
The homeownership rate in the Bay Area tends to vary more wildly than other parts of the state. However, the general trend from the end of the Millennium Boom through today has been down. With a brief bump up in 2017 through 2019 as the economic upturn expanded to its recovery peak, homeownership remains volatile from quarter-to-quarter. As of Q1 2026, San Francisco’s homeownership rate is 51.7%, below the statewide average of 55.7%.
Fueling the preference in San Francisco to rent rather than own is the high cost of ownership alongside the allure of city living. Also, a strong influence to rent, not own, is the mobility maintained by tech workers as they take advantage of fast evolving employment opportunities.
Home prices’ crawl weakly as support vanishes
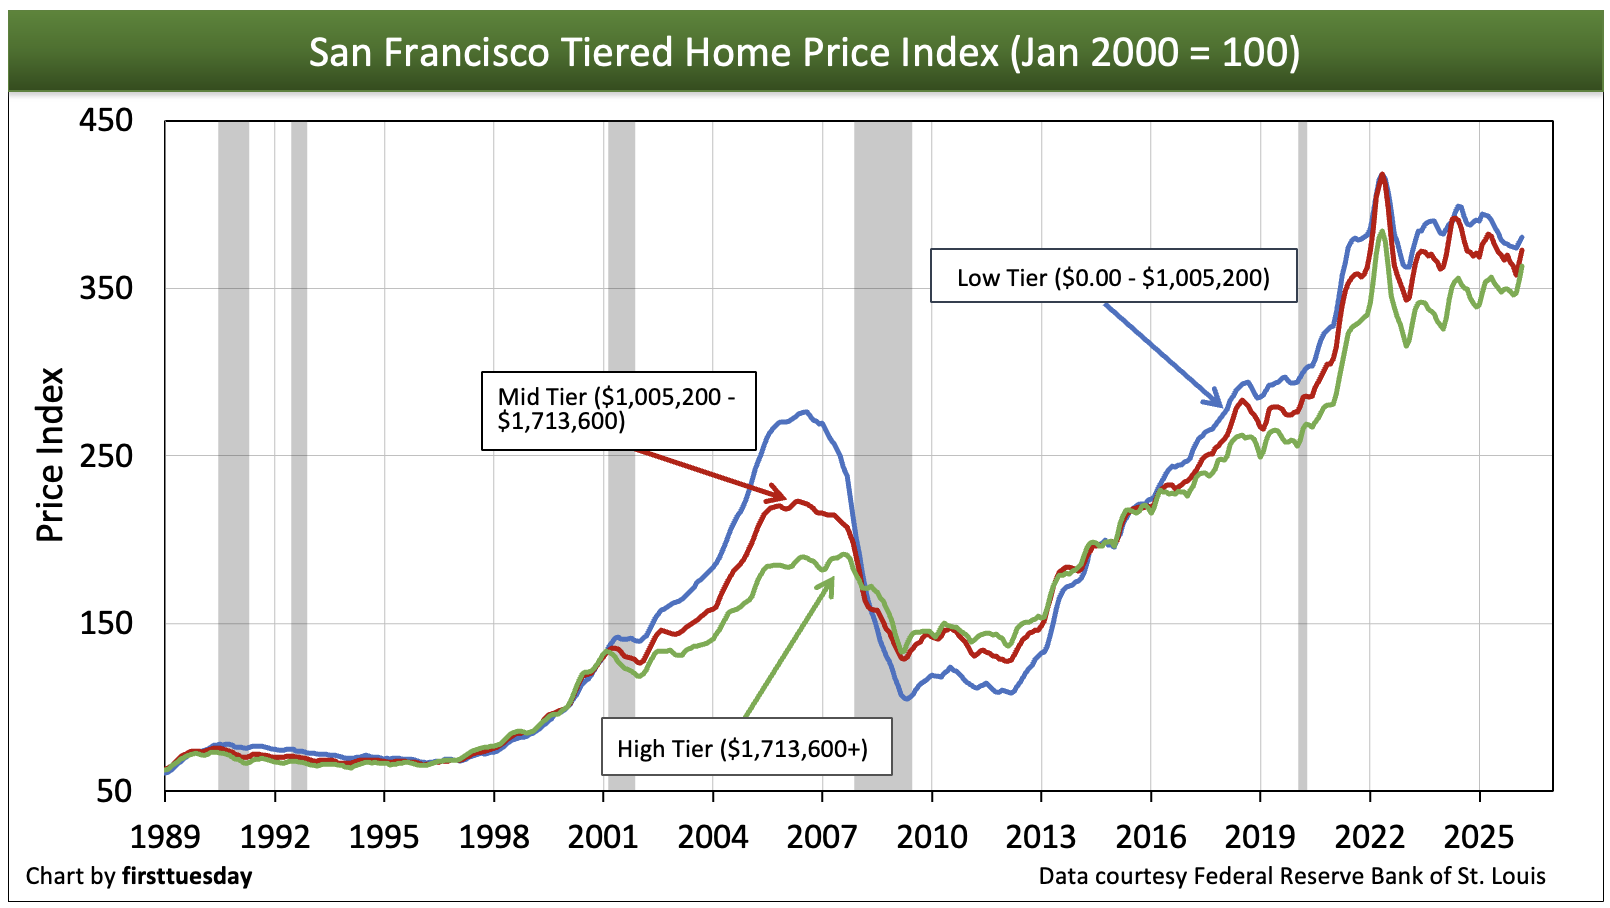
Chart update 06/25/26
| Low-tier annual change | Mid-tier annual change | High-tier annual change | |
| San Francisco County home pricing index: Mar 2026 | -3% | -2% | +3% |
As of March 2026, San Francisco’s low-tier home prices are 3% lower than a year earlier, with mid-tier 2% lower and high-tier prices 3% higher.
Home price reports are expected to continue their downward trend through the remainder of 2026, continuing until bottoming in 2027-2028.
Home price reports run about two months behind current sales events. However, for homeowners, sticky prices tend to persist several months beyond the moment when home sales volume begins to slow, which has taken place.
In the coming months, higher mortgage rates and the deteriorating jobs economy puts additional pressure on home prices. Watch for low- and mid-tier prices to hit bottom alongside the rest of the state near 2027-2028. However, high-tier prices will recover sooner since it is the wealthiest who first see business improvement and jump back into the housing market here in San Francisco and in other coastal areas of the state. Not so in inland bedroom communities.
Related article:
Construction stays low
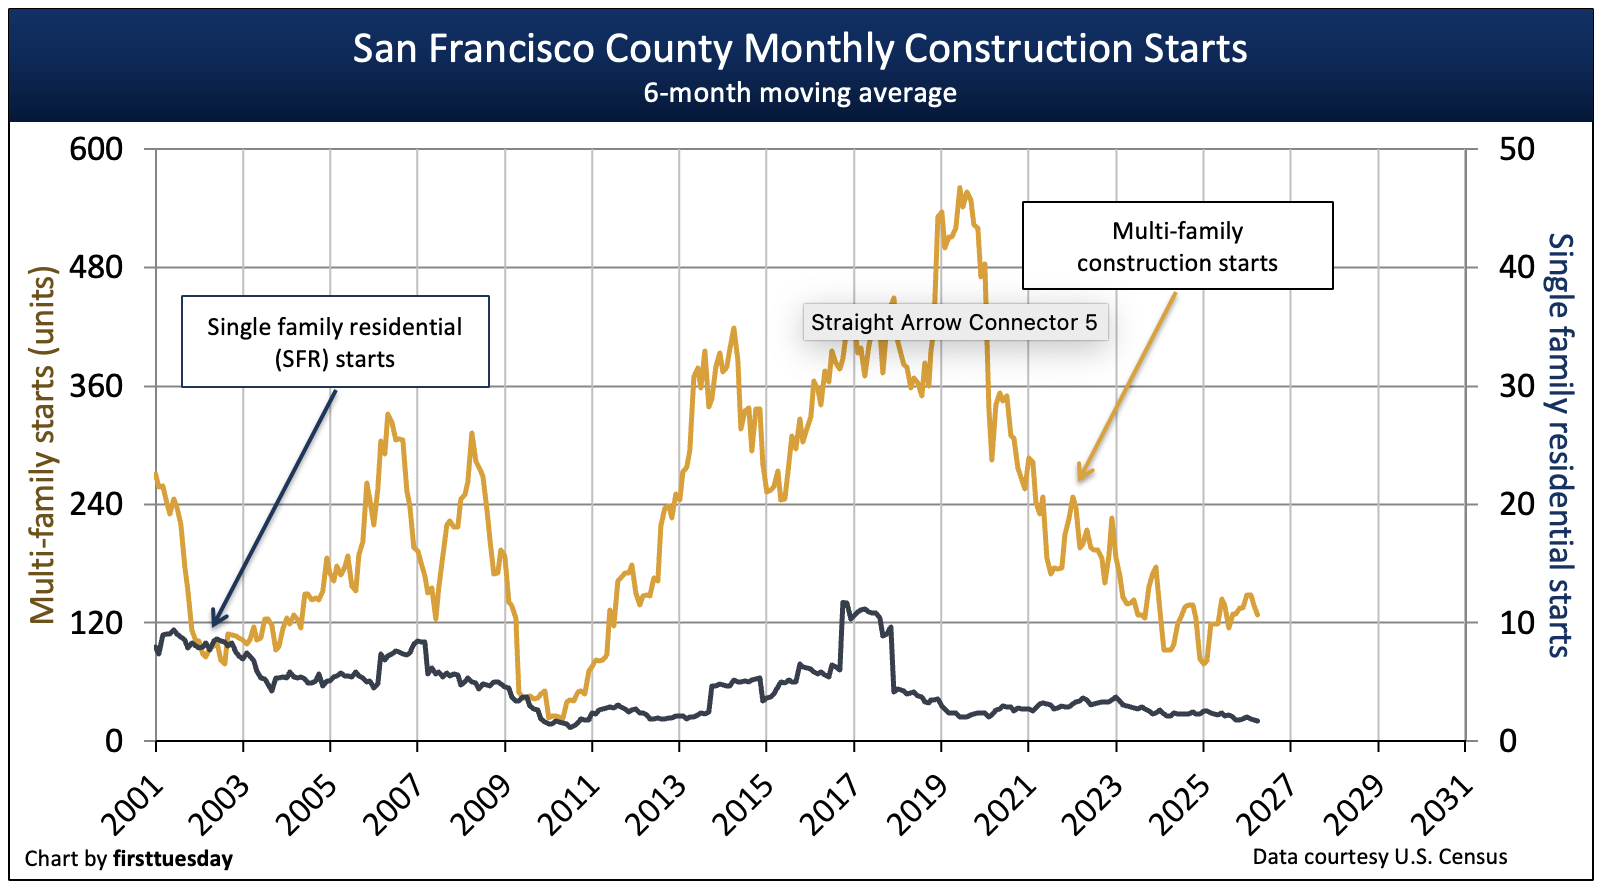
Chart update 06/25/26
| 2025 | 2024 | Annual change | |
| San Francisco County single family residential (SFR) starts | 20 | 26 | -23% |
San Francisco County multi-family starts | 1,600 | 700 | +125% |
Very few single family residences (SFRs) are built in San Francisco County each year, a number so low as to be irrelevant.
Multi-family construction starts, on the other hand, swing wildly from year-to-year, though the trend has is clearly down since peaking in early 2020. Multi-family construction dropped in 2024, down 36% from the prior year, rebounding somewhat in 2025, mostly due to the additions of a handful of larger developments and not any solid trends. The long approval and permitting process in San Francisco holds down construction starts of all types.
However, the legislature continues their attempt to loosen the local permitting process and stop NIMBY litigation to make it easier for builders to meet the inevitable demand to work and live in the heart of a city.
Jobs trending down
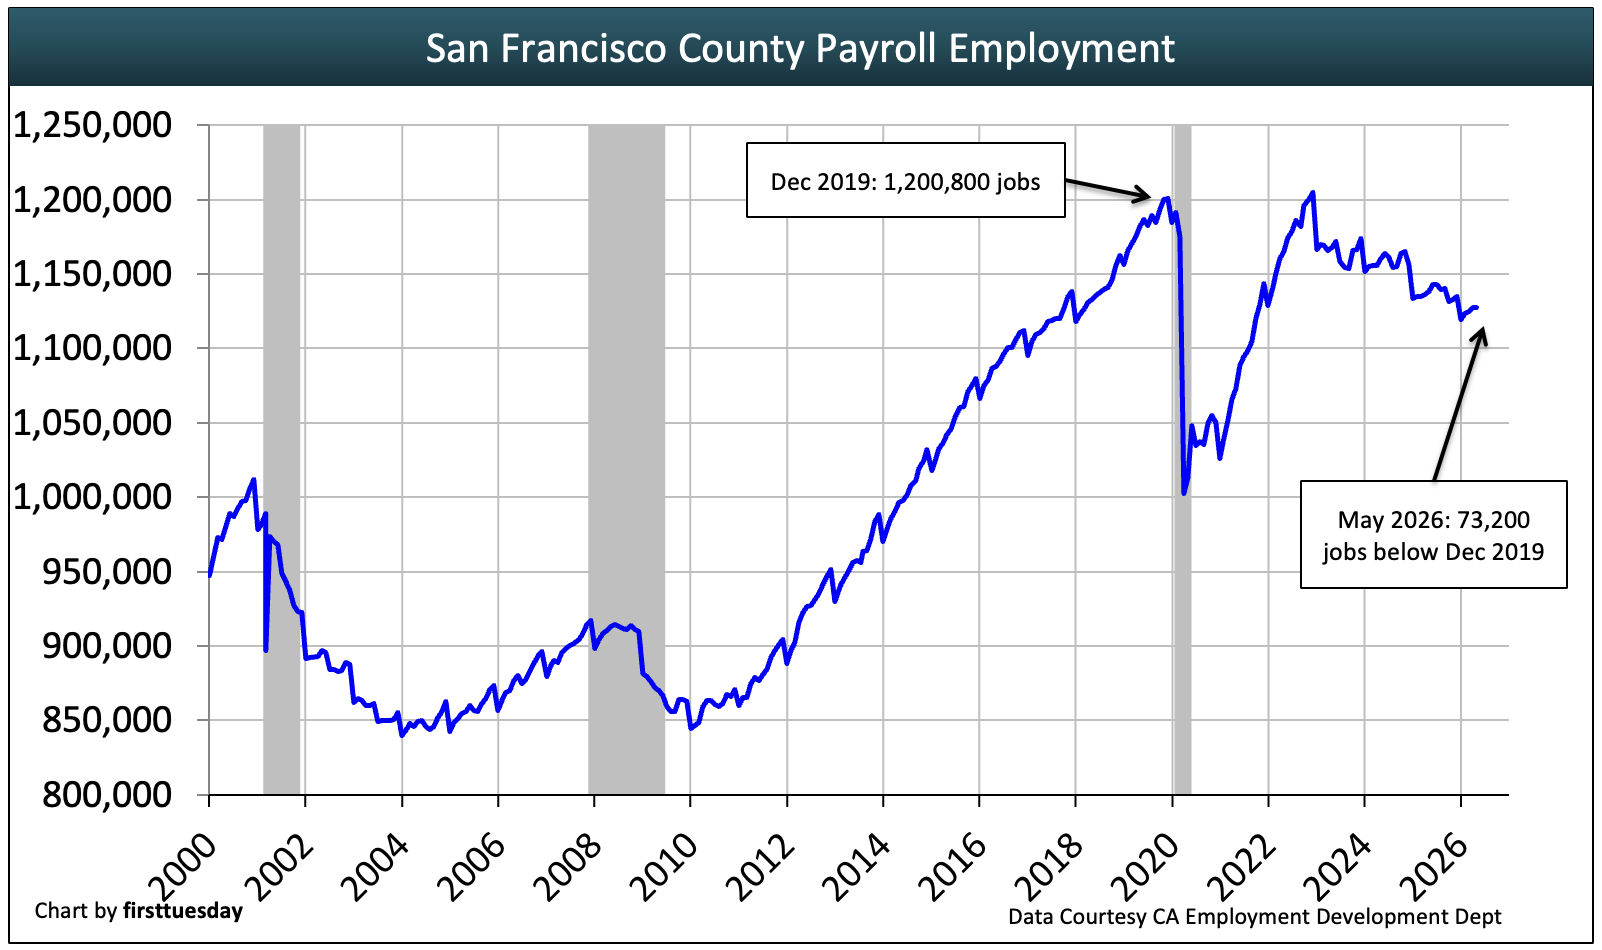
Chart update 06/25/25
| May 2026 | May 2025 | annual change | |
| San Francisco County employment | 1,127,600 | 1,138,500 | -1.0% |
Jobs met and exceeded residents’ need for employment during the recovery following the 2008 Great Recession far earlier than statewide, including San Francisco’s population increase of roughly 70,000 working-age individuals. By comparison, California just caught up to pre-recession levels in mid-2014, finally meeting the intervening population increase in 2019, just before the economy was slammed with Covid-era job losses.
What jobs were gained in the recovery were quickly lost during the Covid recession. Then the jobs recovery from the 2020 Covid recession peaked sharply at end of 2022 and quickly turned downward in 2023, eventually slipping to 2018 levels at the start of 2025 — and falling. With tech industry job holders being successfully lured by employers to other states and the fast-building global economic uncertainty now generally realized, expect to see additional job losses pull rent and home pricing down in 2026-2027.
Jobs by real estate industry
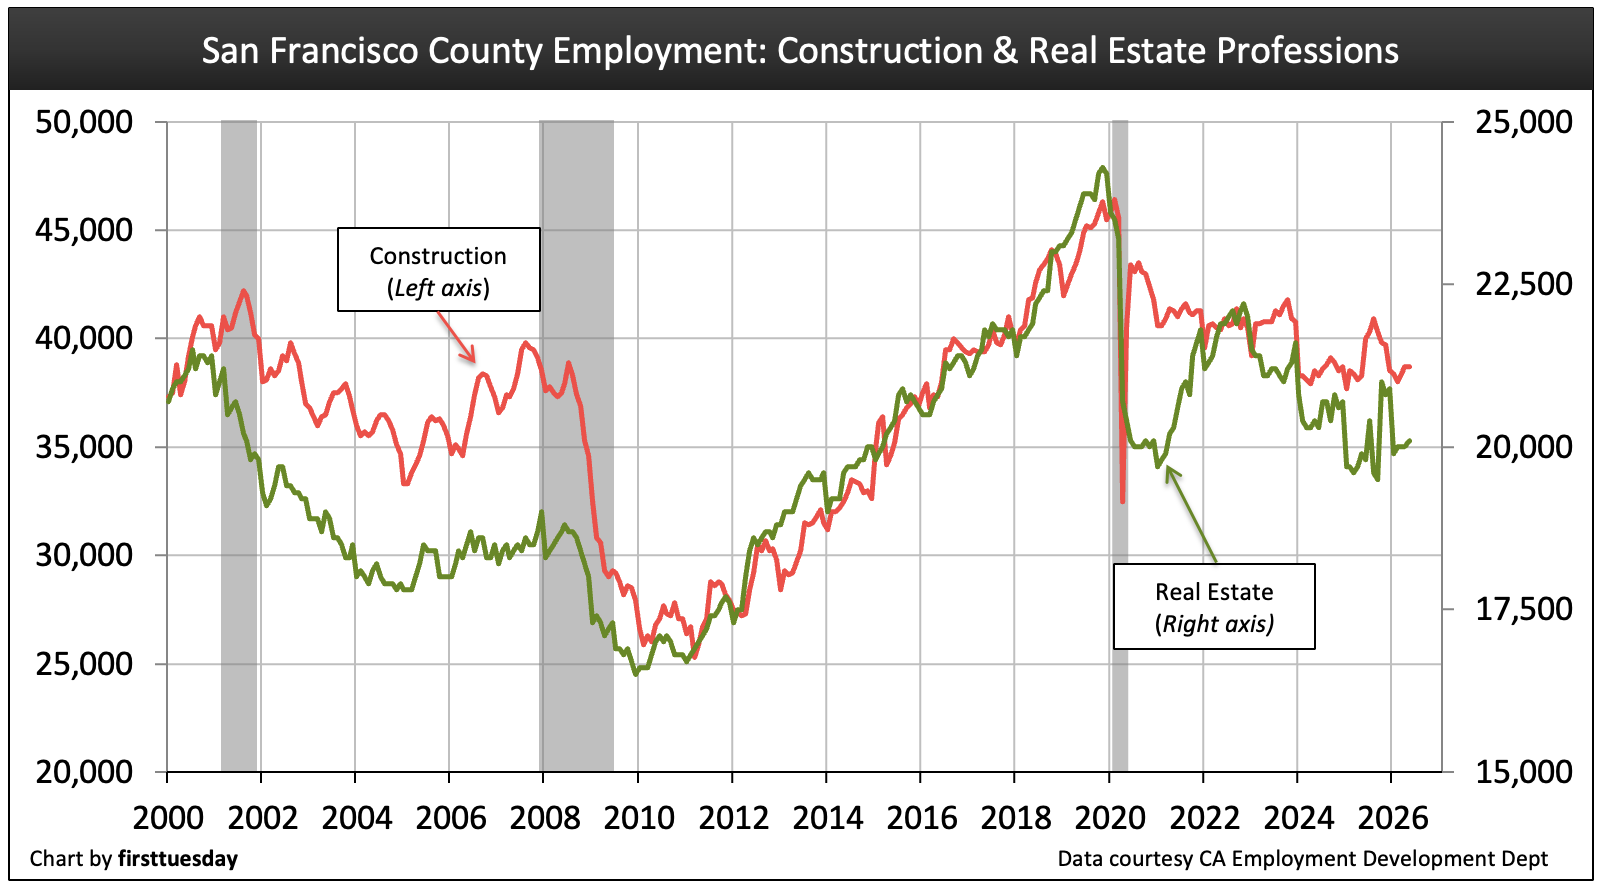
Chart update 12/17/25
| Sep 2025 | Sep 2024 | Annual change | |
Construction | 38,700 | 38,300 | +1% |
Real Estate | 20,100 | 19,900 | +1% |
The number of people employed throughout San Francisco’s real estate related industries has remained relatively flat over the prior year as of May 2026. Employment in the real estate industry remains well below pre-Covid levels and faces further decline as the general economy slides into a Conference Board declared recession.
The construction industry also suffered greatly during 2020, continuing as builder motivation to develop new housing declines significantly.
The aggressive California legislative effort to encourage more residential construction is helpful. However, uncertainties are becoming deep-rooted in our population. New starts are unfeasible for builders until material costs and labor issues become predictable and no longer disrupted at the federal level. The federal courts are a stabilizing and helpful influence, but meaningful decisions take time to produce.
Meanwhile, the dire need for more residential construction continues, locally stressed by high costs, high mortgage rates and high asking prices.
Real estate jobs are also wavering, flat compared to this time last year as fee-generating transactions slow and buyers wait for prices or mortgage rates to sink before they are willing to act.
Per capita income has recovered

Chart update 7/17/25
| 2023 | 2022 | Annual change | |
| San Francisco County per capita income | $164,800 | $155,200 | +6.2% |
| California per capita income | $81,250 | $76,900 | +5.6% |
The interesting and persistent fate of an individual’s income is that wages and salaries rarely decline in an economic turndown. What does happen is that businesses release those considered excess employees and hiring essentially stops.
Per capita income in San Francisco is double that of California’s average income, increasing at a significantly quicker pace that most of California in recent years.
It is alarming, but San Francisco residents spend on average a debilitating 41% of their income on housing expenses. Many employees simply cannot afford to live in the city and are forced out to the suburbs, the only place where their paycheck qualifies them for housing. But chasing nearby housing does not solve the burden of housing costs long term for San Francisco.
If you’re looking for indications of where California’s housing market will be in two to three years, take a look at San Francisco County. Sales volume will fall back due to:
- too-high home prices relative to incomes;
- the desire of households to escape their current depressed standard of living; and
- the stress of an unstable global economy navigating international hostilities of all varieties.
Even though personal incomes here are higher than virtually anywhere else in the state, rising incomes still are outpaced by the cost of housing here in San Francisco. Availability is the issue, as insufficient housing is the basis for fast rising housing costs.
With income tied to consumer inflation, not asset inflation, household incomes are not rising enough to buy a home – a capital asset in an open market lest you forget. At current asking prices and mortgage rates, household income will take years to catch up. If not through income, another homebuying factor needs to change to improve the opportunity for homeownership.
The least likely factors to change drastically, mortgage rates and capitalization rates for setting asset value, are held back by a global bond market which controls mortgage and cap rates via the 10-year Treasury note rate.
The final leg of the triangulation for ownership is pricing, which needs to decrease dramatically to bring housing costs for buyers into line with individual income. This will happen slowly at first as sellers hold onto illusions of yesterday’s prices, known as the sticky pricing phenomenon.
As inextricably coupled to one another, property provides housing for families and businesses. When ownership costs drop, so will rents in order to remain competitive attracting and retaining tenants. You just might see construction of housing leading the California economy out of the now developing recession.


These are some interesting statistics, thanks!
It’s interesting that there was no mention of overseas buyers of San Francisco real estate. ZIRP and the availability of mortgages are what have generated the current housing bubble, and inflation and an increase in interest rates are the only things that will collapse it. However, there may not be statistics to track such metrics, or the article may simply be being politically correct.
What are the total multifamily construction starts for 2020?
Interesting, not a word about foreign investors into the SF real estate market. Or perhaps there is no data to track such metrics or the article is just being pc. ZIRP and mortgage availability is what has caused the current housing bubble, inflation and a rise in interest rates are the only things that will pop it.
This is crap, why? Most of the sale price increases have not come from “real” buyers, just speculation. Speculation is very unhealthy and will lead to a sell-off. The recent massive of building projects, condos, will lead to a glut. Speculators are exiting, high paying jobs are starting to leave.
Has anyone done the math on how a median home income of 84,000 can be useful to buy a house in San Francisco? Or, how will these people come up with 267,000 down payment, let alone, qualify for a loan. The median household income is only good for paying up 450,000, not 1.2 million…How come the media ignores this?
I don’t think more than 1 percent of people under 45 can qualify for any kind of jumbo loan, who will buy the homes, where are the “real “buyers?
Get ready for the biggest property crash in American history. We are being lied to and manipulated
We already had the biggest property crash in American history. The next one will be different. The last one was a collapse in over-inflated entry level housing. The next one will see a crash in over inflated high end housing.