
California is home to the largest population of residents — and real estate professionals — in the nation.
How does California’s real estate broker and agent population stack up against other states? To gather meaningful data, we present these charts, which compare the number of agents based on the population size they serve, according to the Bureau of Labor Statistics (BLS). The states with the largest populations of real estate licensees are included in this analysis.
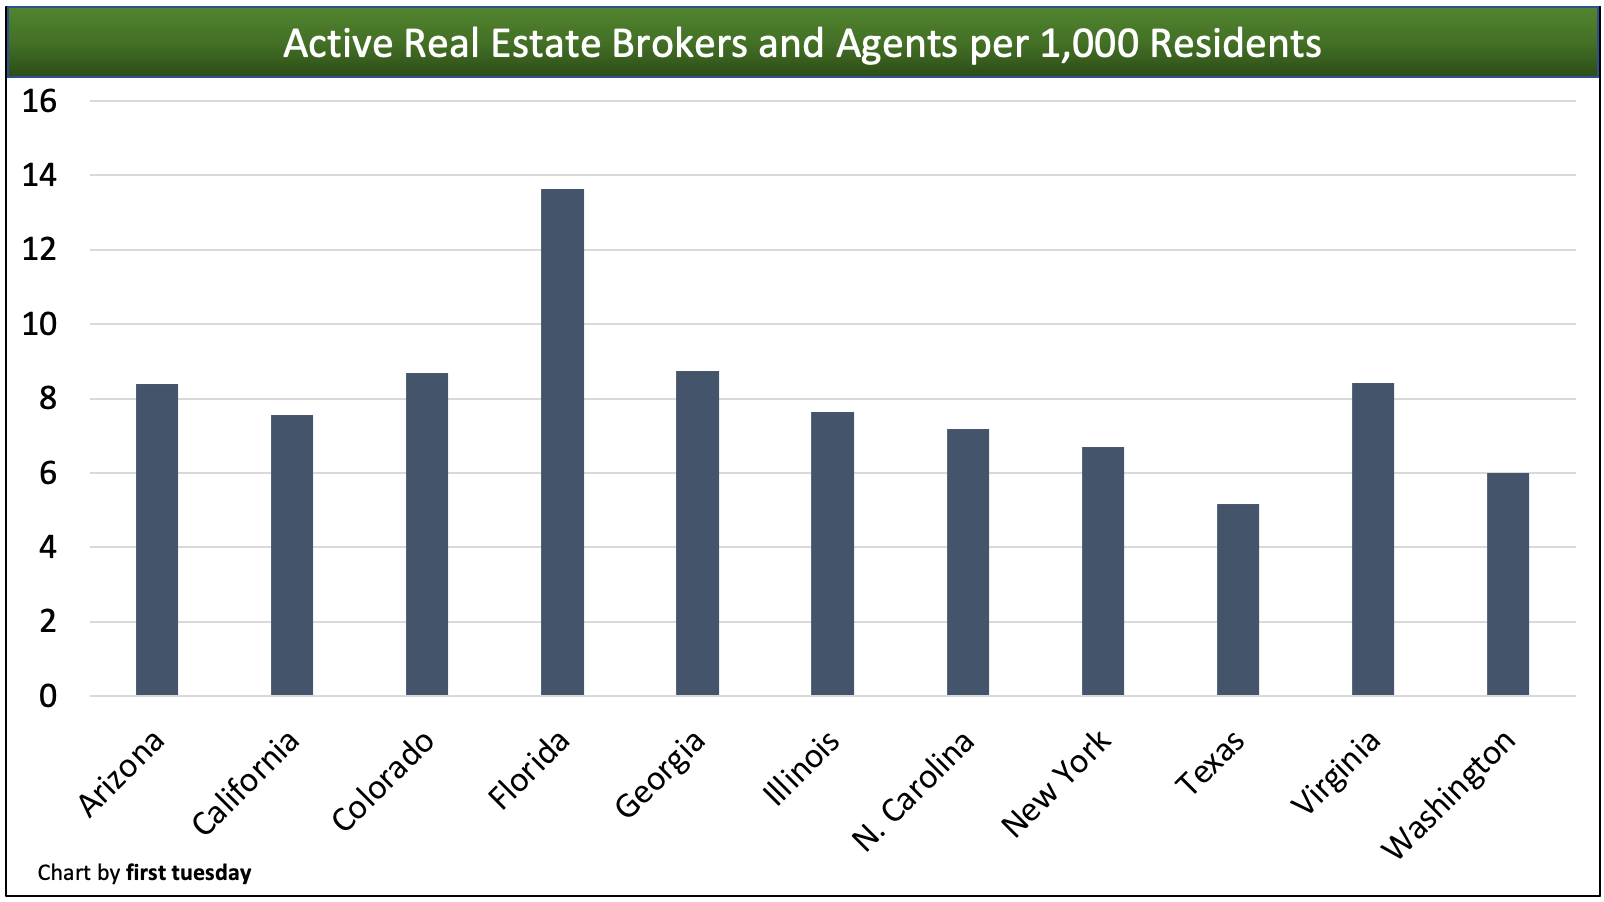
For example, in California, there are just under 299,000 active agents and brokers licensed as of May 2020. This is just slightly more than the 293,000 active agents and brokers who practice in Florida. However, given California’s much larger total population, the number of active licensees per 1,000 residents is significantly higher in Florida than here in California.
Sources: Multiple sources were referenced, including the government bodies overseeing each state’s real estate population and the U.S. Census Bureau.
| State | Agents and Brokers per 1,000 residents |
| Arizona | 8.4 |
| California | 7.6 |
| Colorado | 8.7 |
| Florida | 13.6 |
| Georgia | 8.7 |
| Illinois | 7.6 |
| North Carolina | 7.2 |
| New York | 6.7 |
| Texas | 5.2 |
| Virginia | 8.4 |
| Washington | 6.0 |
Licensees who practice in states with higher numbers in the table above have fewer opportunities to make money as licensees. For example, licensees in Washington, which has only six agents per 1,000 residents, have less than half the competition than do Florida agents and brokers, with 13.6 licensees per 1,000 residents. Each of these residents — minus those under 18 — represents an opportunity for a real estate agent or broker to make a sale.
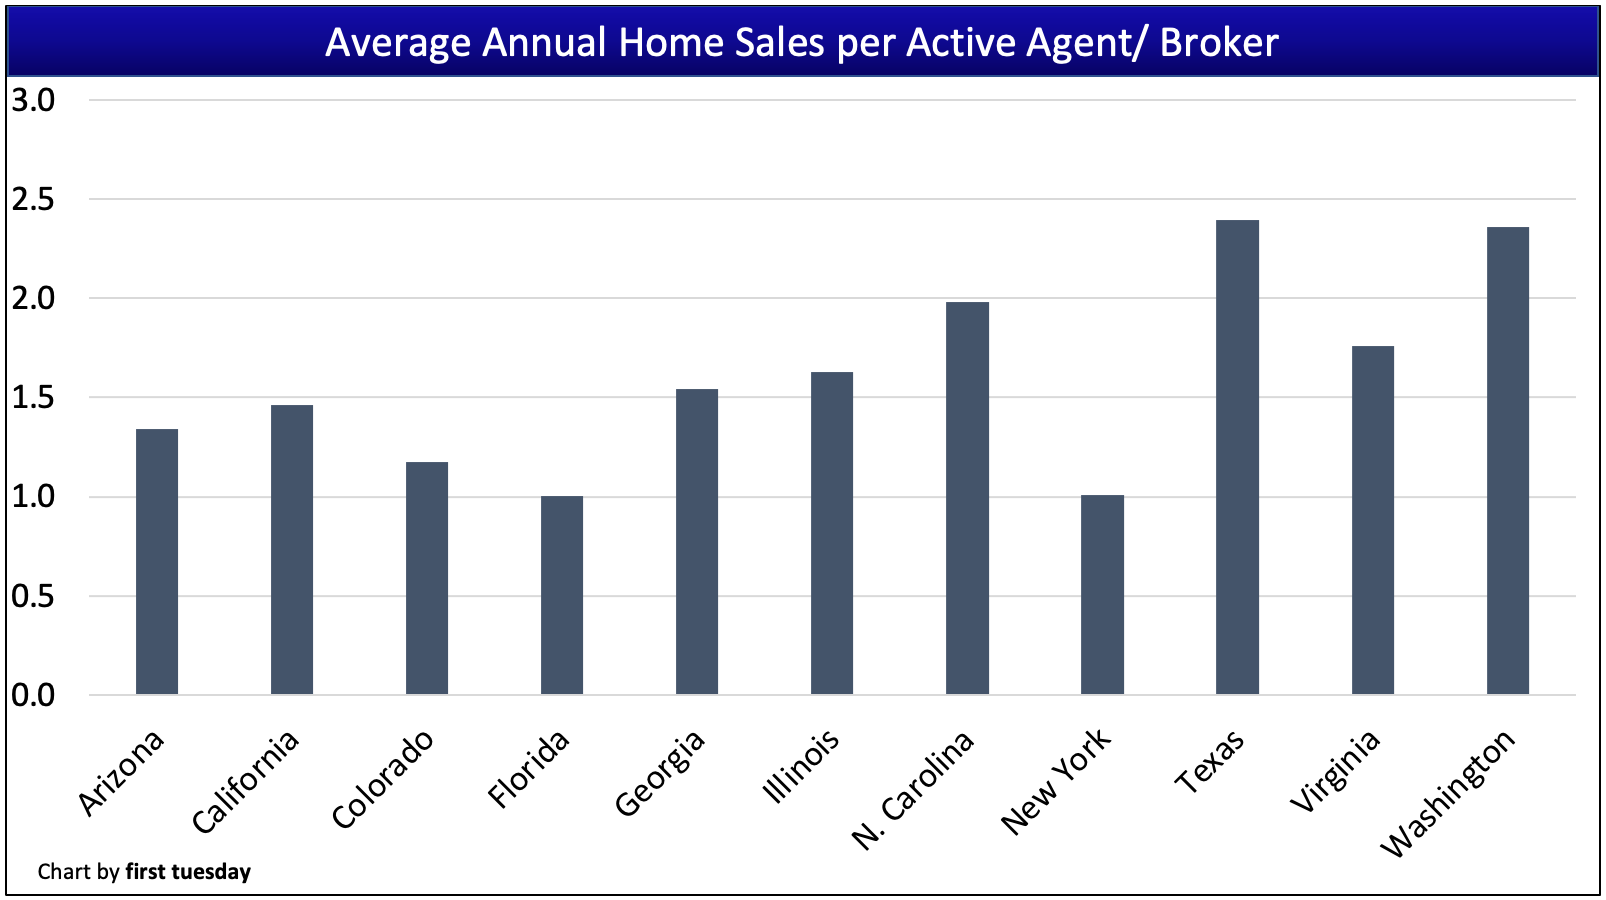
The more sales available per active licensee, the more transactions each licensee will be able to close in a year. Therefore, the above chart is only half the story.
Here in California, fewer home sales per resident occur compared to other states, contributing to our state’s low homeownership rate. Thus, even though our state is roughly average when comparing the number of licensees per resident, it performs below average when considering the number of home sales that close each year.
Sources: Multiple sources were referenced, including the government bodies overseeing each state’s real estate population and various regional news sources for the number of home sales closed each year.
| State | Annual home sales per active agent and broker |
| Arizona | 1.3 |
| California | 1.5 |
| Colorado | 1.2 |
| Florida | 1.0 |
| Georgia | 1.5 |
| Illinois | 1.6 |
| North Carolina | 2.0 |
| New York | 1.0 |
| Texas | 2.4 |
| Virginia | 1.8 |
| Washington | 2.4 |
This chart shows the number of home sales closed in each state on an annual basis per active real estate licensee, including agents, broker-associates and employing brokers.
On average, most states see one-to-two sales closed per active licensee each year. Of course, it’s difficult to make a living based on these statistics above, and most practicing agents close far more sales each year than what is represented. That’s because, even though a licensee is considered to be active by the state, that doesn’t necessarily mean they are marketing or actively working to close sales.

In California, an active agent is simply an agent who is employed by a broker at the time of their renewal. Still, many “active” agents do not actively seek out clients, instead using their license on an as-needed basis, or are otherwise transitioning out of the industry. Employing brokers also may not be seeking out home sales, relying instead on income generated by their agents.
On the flip side, some licensees who are technically inactive still contribute to home sales, by acting as principals. These types of inactive agents are often found during recessionary periods flipping or speculating property.
Further, the number of sales needed to support an agent varies based on the average home sale price of each transaction. For example, home prices across California are much higher than prices in almost any neighborhood in, say, Georgia. Therefore, it will take fewer California sales to match the income of an average Georgia real estate agent.

Sources: Multiple sources were referenced, including the government bodies overseeing each state’s real estate population and Zillow’s Home Value Index. The resulting figures were calculated using the number of active licensees per state, the latest annual home sales volume figures and the average home value in each state. The chart assumes a 3% fee produced per agent for each transaction.
| State | Average annual fees earned based on sales volume and agent/broker population |
| Arizona | $11,700 |
| California | $25,800 |
| Colorado | $14,900 |
| Florida | $7,800 |
| Georgia | $9,900 |
| Illinois | $10,500 |
| North Carolina | $12,900 |
| New York | $10,500 |
| Texas | $16,000 |
| Virginia | $15,600 |
| Washington | $31,300 |
This chart shows the average annual income earned per active agent, based on a 3% fee earned per home sale. It’s important to remember these figures are abstractions, as they do not account for a broker fee split and they are based on average sales-per-active-licensee figures, which can be misleading.
Still, the figures above represent a measure of opportunity for licensees in each state, hinting toward a tight market for licensees in some states, and room for growth in others.
For example, at $31,300, Washington has the highest average annual income based on sales-per-active-licensee. Of course, Washington has a relatively high cost of living, thus this above-average income will not go as far as it would in states like Texas, Arizona or Georgia. Still, licensees in Washington are better positioned than those in California, who earn a lower average income based on sales-per-licensee, despite our state’s higher cost of living.
Keeping an eye on licensee trends
For real estate licensees to remain successful, keeping an eye on trends in their population is essential.
During the Millennium Boom, California’s agent population exploded, increasing 85% in a span of just five years. Sure, California home sales and prices were also booming during that time, but nothing about the Millennium Boom was sustainable for agents or homeowners.
When the market turned and the Great Recession set in, those numbers quickly deflated, with the number of active agents bottoming in 2014 and the number of active brokers still descending in 2020.
Related article:
As we continue through the 2020 recession, some unemployed residents may consider real estate as a promising career path. After all, home prices continue to rise and homebuyer competition remains a talking point for media outlets. But there are more worrying signs to consider before potential rainy-day agents enter the profession, including:
- 9% lower year-to-date home sales volume as of August 2020;
- a low 5% increase in prices on average, despite the 10% annual increase in buyer purchasing power; and
- the long recovery ahead for the historic job losses that occurred in spring 2020.
Each of these factors reflects reduced homebuyer demand, the impact of which will continue to strangle the housing market in 2021. 2020’s reduced sales volume will continue to pull back on home prices, resulting in annual losses in the months ahead. The coming end to the foreclosure moratorium will result in a surge of distressed sales, which will pull down home values.
In other words, real estate is not a career path for someone looking for an easy, sustainable path to income. However, those willing to work hard and creatively as licensees will be well positioned to earn a living in the lean months to come.
Related article:


It’s the best school to go through to get your real estate license. Whether in a class or online I’ve done both and it’s educational andinformative!