
The California Buyer Purchasing Power Index (BPPI) figure remains deeply negative, at -22.7 in the first quarter (Q1) of 2023. This figure tells us a homebuyer with the same income is able to borrow 22.7% less purchase-assist mortgage money than a year ago when mortgage interest rates were just beginning to rise from historic lows.
Q1 2023’s basement level BPPI figure reflects the oppressive situation for homebuyers reliant on mortgage financing, as the BPPI was positive during 2019-2021 due to consistently lower mortgage interest rates.
While the BPPI rises and falls on a short-term basis, in the coming decade, the annual BPPI figure will generally remain negative due to continually rising interest rates, a turnaround in long-term interest rate movement which began in 2012.
The impact to homebuyer mortgage funding has been devastating — and the inevitable shockwave to home prices arrived in mid-2022, pushing prices to rapidly implode. More acutely, the abrupt spike in home prices in 2021 was certain to be followed by a sudden and equal drop in prices as the pandemic stimulus of abnormally low mortgage rates was eliminated and normal bond market mortgage rate conditions returned.
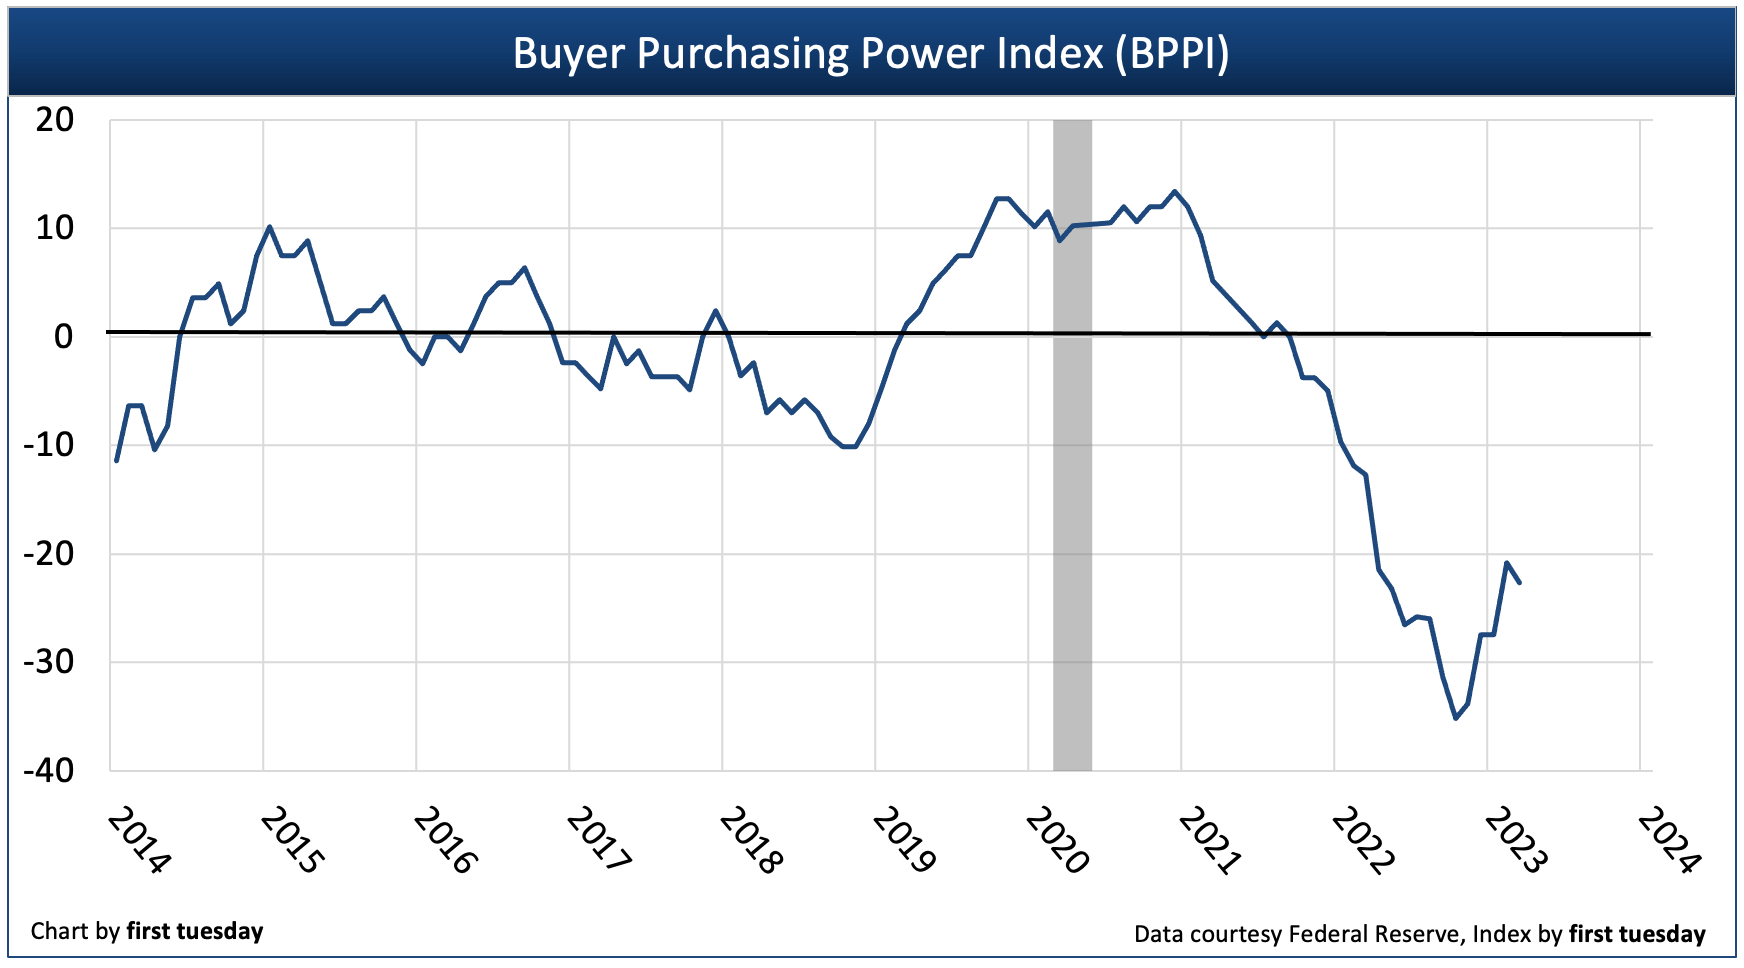
Chart update 04/02/22
| Q1 2023 | Q4 2022 | Q1 2022 | |
| Buyer Purchasing Power Index (BPPI) | -22.7 | -31.0 | -12.7 |
Video update: February 2023
The BPPI foreshadows home price movement
As the BPPI declines, so goes support for home prices.
In this decade’s rising mortgage interest rate environment, both the BPPI and homebuyer participation in the home sales market are adversely affected.
Homebuyers qualify for a maximum mortgage amount based on:
- their incomes and savings; and
- shifting interest rates.
Thus, any rise in mortgage rates instantly cuts the amount of capital funding homebuyers can borrow, and in turn the price they pay for a home is reduced. Sellers are slowly discovering, as are seller’s agents, that the math of interest rates to borrow capital leaves all property worth less in price.
At the outset of the pandemic in 2020, mortgage rates descended to historic lows due to Fed efforts to stimulate spending by inducing home refinancing to pull cash — the ATM effect — and home purchases needed to support real estate sales volume. Then, in 2022, the Fed stopped its pandemic mortgage market activities and mortgage rates rapidly increased to make their mark on home sales volume, freezing over the market momentum built up during the Pandemic Economy.
Here in California, home prices began to decline on a monthly basis in mid-2022. As of January 2023, average California home prices are 2%-to-3% lower than one year earlier and down 10%-13% from their May 2022 peak. For readers keeping track, that decline in pricing is -1.5% averaged monthly, a figure mostly likely to be experienced again after a modest spring price bounce.
Without the financial support of consistently falling interest rates (unlikely to improbable in 2023), government stimulus, or a boost in wages, home prices will continue to fall back in 2023-2024.
Related article:
The Fed and the bond market influence mortgage rates
To end its pandemic period monetary policy of funding and setting interest rates on home mortgages, the Federal Reserve (the Fed) exited the mortgage-backed bond (MBB) market at the end of 2021.
On exiting, the funding and setting of fixed rate mortgage (FRM) rates returned to the bond market. This resulted in a jump in mortgage rates to match bond market MBB yields which, unlike Fed funding, are based on the 10-year Treasury Note rate plus a risk premium rate presently set at double historic norms in anticipation of a recessionary rise in mortgage defaults.
The result of all the pandemic fiscal and monetary stimulus of 2020-2021 caused consumer inflation to vastly exceed the Fed’s target of 2%. To rein in and tamp down excess consumer inflation, the Fed bumped up their benchmark rate several times in 2022, with more to come in 2023. This directly increased interest rates on adjustable rate mortgages (ARMs).
Further, interest rates on long-term debt obligations, such as the 30-year FRM, used to calculate the BPPI, reflect bond market investor perceptions about the level of success the Fed will achieve in their fight to lower consumer inflation and that fight’s effect on investment opportunities in the near future. When the Fed is succeeding in its fight to normalize consumer inflation — as began to appear heading into 2023 — bond market investors accept lower yields, and FRM rates taper slightly, as they have.
While mortgage rates skyrocketed in the first three quarters of 2022, they were slashing buyer purchasing power. This brought on a cascade of altered behaviors which resulted in a low level of need for those providing real estate services. This attitude will remain until agents discover that an endless variety of reports with disclosures about all aspects of a property are the norm for attracting buyers in a recession.
However, as the consumer inflation rate trends back toward 2% expect the 10-year T-Note and mortgage rates to edge downward slightly in 2023, expect the BPPI to return toward zero in Q3 2023.
Still, the long-term outlook for the BPPI is a decades’ long period of remaining below zero, as mortgage rates resume their rise with the economic recovery, likely to gain strength around 2026. Until then, sellers can expect continued downward pressure on home prices.
The housing market will see declining sales volume and prices in 2023-2024, with prices bottoming as early as 2025. Watch for a return of real estate speculators by 2025 to stop the price decline and provide a “dead cat” bounce during the coming slump, with a sustainable recovery taking off with the return of end user homebuyers around 2026-2027. Planning for the next several years in real estate transactions will require patience and a very different approach to the past decade of recovery economics.
About the BPPI
The Buyer Purchasing Power Index (BPPI) is calculated using the average 30-year fixed rate mortgage (FRM) rate from Freddie Mac (Western region) and the median income in California.
A positive index number means buyers can borrow more money this year than one year earlier.
A negative index figure translates to a reduced amount of mortgage funds available.
An index of zero means there was no year-over-year change in the amount a buyer can borrow with the same income. At a BPPI of zero, homebuyers cannot purchase at higher prices than one year before unless they resort to adjustable rate mortgages (ARMs) to extend their borrowing reach or greater down payment amounts.
As long-term BPPI trend declines, the capacity of buyers to borrow purchase-assist funds is reduced. In turn, buyers needing purchase-assist financing on average can only pay a lesser price for a home. To keep the inventory of homes for sale moving at the same pace, sellers will need to lower prices to accommodate buyer purchasing power or pull their properties off the market.
—
first tuesday journal online is a real estate news source. It provides analyses and forecasts for the California real estate market, and has done so since 1978.


Great to know those numbers here. Keep it up