
Orange County’s housing market remains frozen in 2026, lacking the buyer decisiveness and economic support needed to grow.
The pandemic economy of 2020-2021 briefly distorted sales transactions, further inflating both sales volume and pricing for sales and leasing of all types of property until peaking in mid-2022. To abate pandemic damage to the real estate sector of the economy, mortgage rates during the pandemic were set at historic lows backed up with readily abundant funding.
The high-octane, low-cost mortgage funds were rocket fuel for home sales volume — and prices — until the pandemic economy abruptly ended. By early 2022, mortgage rates more than doubled from the prior year as the Fed returned the source of funding to the private Wall Street bond market managers.
The low mortgage rates and fast rising prices in 2020 and 2021 did induce homeowners to refinance, but not to sell, a trend persisting today which reduces normal turnover in ownership. A legitimate caution swept through the county’s homeowners out of concern for finding a replacement home with mortgage rates at pandemic lows. Caution and uncertainty caused turnover of ownership and tenancies to dwindle, which in turn caused new home construction sales to lag badly.
Now in 2026, the prior years of low levels of inventory for sale or rent is steadily rising — more days, weeks and months on the market — while buyer demand is flat at best. In tacit acknowledgement, seller pricing leveled out in what has become four post-covid years .
Today’s trends in economic conditions for real estate are deeply rooted in worldwide confusion. The trend is not abating which suggest prices in the next couple of years will continue to remain flat, or drop when owners must sell.
Going forward, expect sales volume in all types of property to continue to slip annually, the enduring but never permanent downward trend in sales volume since the peak in mid-2022. As prices flattened and are likely to stay flat as long as job levels hold, prices probably will drop to form a trench in pricing around 2028. When prices eventually start to rise consistently over several months, buyer-occupants will return and buy, as they do in every recovery following a recession like real estate is now experiencing.
As sales volume and leasing decreases, inventory for sale or for lease starts to pile up. After several months of decreasing sales volume, asking and sales prices start to decline in tandem, separated by several months to a year.
View the Orange County regional charts below for details on current activity in its local SFR sales market.
Updated June 24, 2026. Original copy posted March 2013.
Home sales volume dips

Chart update 04/12/26
| 2025 | 2024 | 2019 | 2003: Peak Year | |
| Orange County home sales volume | 21,300 | 21,300 | 29,700 | 53,900 |
Home sales volume in Orange County is now seriously weakening, driven by the post-pandemic economic fallout. Today’s level of sales is stuck at about half the heights for sales during the recent recovery following the Great Recession period ending by 2012.
The rising sales action of the pandemic years ended with a sales volume crash in 2023. In total, 20% fewer sales closed escrow in Orange County during 2023 compared to 2022. Since then, sales volume has remained flat. Expect a flat to declining sales volume for 2026.
Dragged down by the double whammy of rapidly rising mortgage rates and fast rising property prices during the pandemic, homebuyer enthusiasm has waned significantly.
That said, home sales volume for 2025 was level with the prior year. Year-to-date, 2026 is 5% lower than the prior year as of February 2026. Until builders get sufficient incentive to build and release residential units at an increased rate, SFR sales volume is likely to remain in its downward trend.
A complete recovery with annual sales volume of around 46,000 in Orange County needs the buttressing of end user demand by increased labor force participation — more people employed. Expect a 2028-2029 recovery target from the California real estate recession that commenced mid-2022.
Inventory climbs
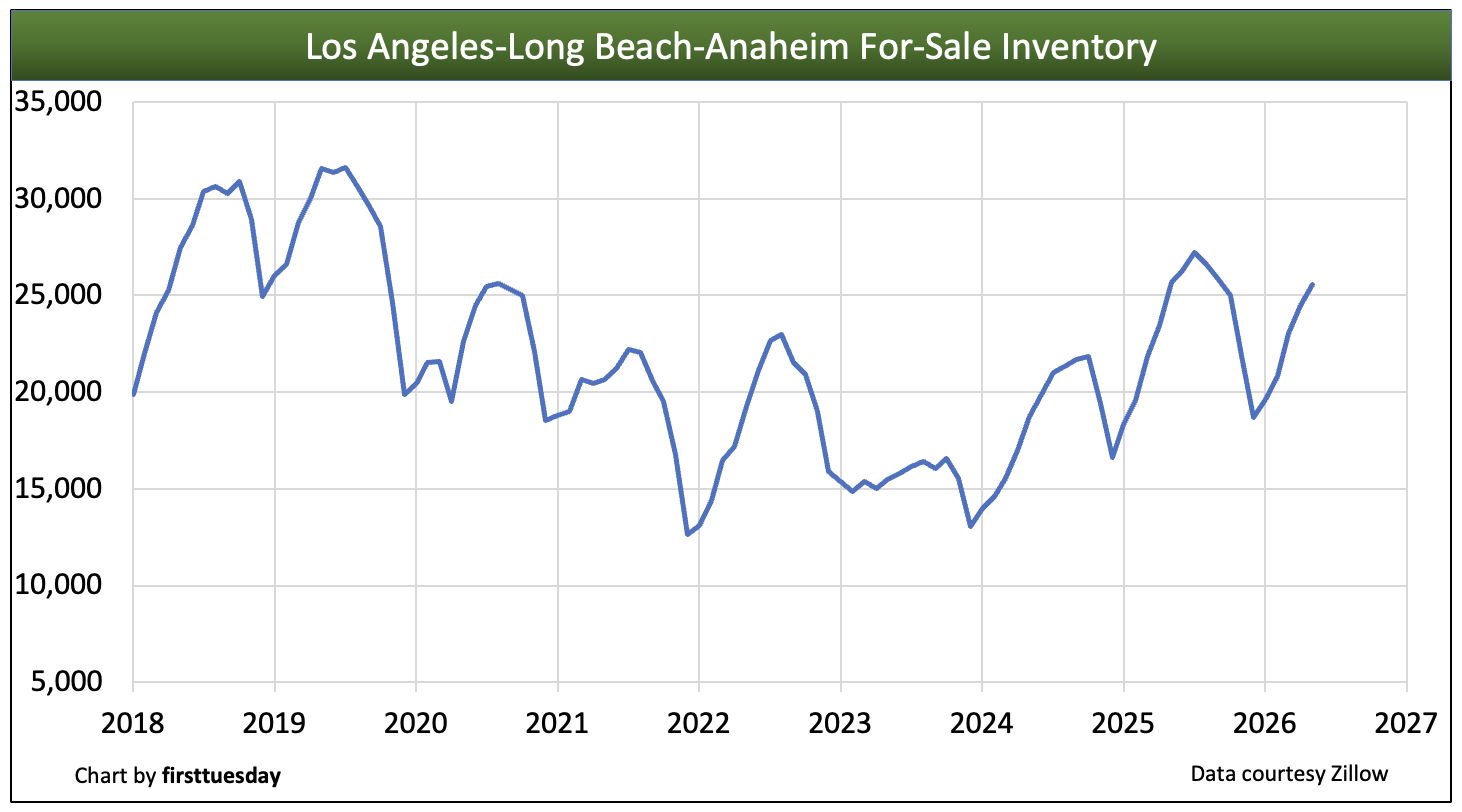 Chart update 06/24/26
| May 2026 | May 2025 | Annual change | |
| LA-OC County for-sale inventory | 25,600 | 25,700 | -0.2% |
Inventory of homes available for sale rose from the historic low reached at the end of 2021. After plateauing in 2023, for-sale inventory during 2025 in the Los Angeles-Orange metro areas averaged an increase of 12% more properties over the prior year.
The steady buildup in inventory has helped cause prices to become flat, an annual pricing status underway which will eventually offset the higher cost of mortgage funds. The winter months typically see the lowest inventory of homes for sale, peaking around mid-year as the annual cycle of returning buyers takes place.
Looking forward into the remainder of 2026, expect for sale inventory to grow and force sellers to make critical pricing decisions. As for-sale inventories grow and the average length of time on the market is extended, sellers must either:
- withdraw their property from the market as no longer available for sale; or
- reduce their asking price to induce mortgage-funded homebuyers to contact their buyer agents and acquire ownership of a home.
The Federal Reserve’s fight to reduce consumer inflation while maintaining current employment levels is progressing irregularly. Fed activity also points to a continuing downturn in housing market transactions until the 2028 period. Quantitative Tightening (QT) as a mantra for the incoming Fed Chairman can only, if implemented, result in higher mortgage rates. Privatizing Freddie Mac and Fannie Mae will produce an increase in the risk premium built into SFR mortgage rates.
The gradual shift from a seller market to a buyer market was introduced in 2013 by the beginning of a roughly 30-year half cycle of generally rising mortgage rates.
As a result of higher mortgage rates, homebuyers who do not pay cash increasingly take a wait-and-see approach to buying. They have become more aware of the market conditions driving future price reduction. However, declining prices temporarily intensify the wait-and-watch routine for today’s ready and able buyer, until suddenly they all become willing to jump in as prices trough, hold and begin a slow, consistent increase.
Low turnover rate to continue
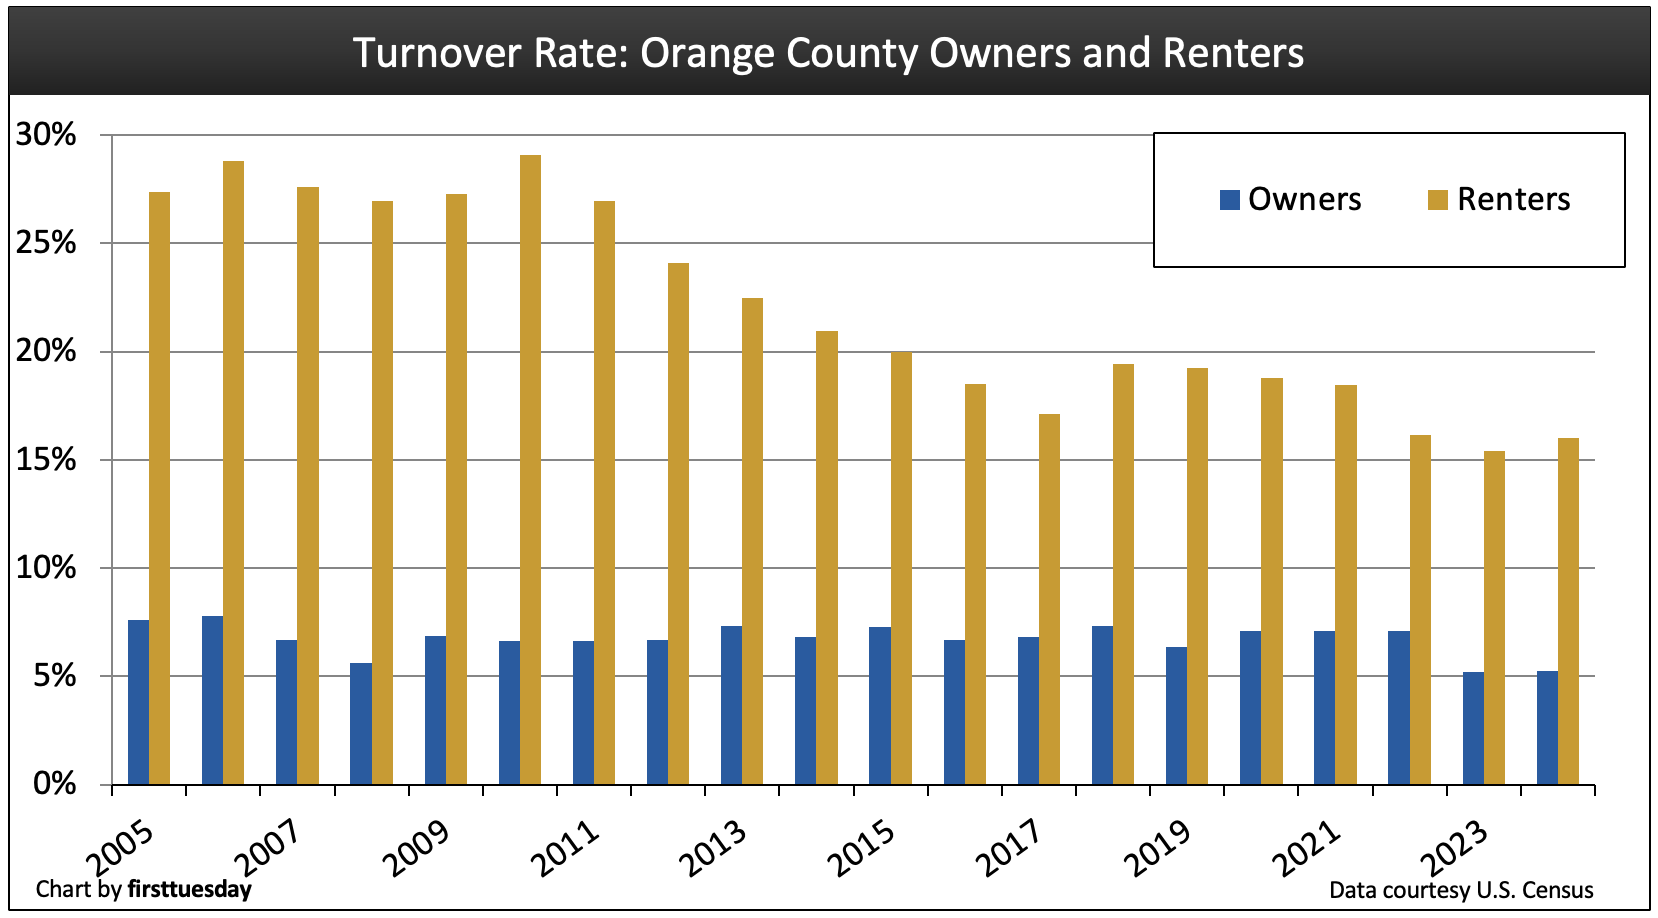
Chart update 12/26/25
| 2024 | 2023 | 2022 | |
| Orange County homeowner turnover rate | 5.3% | 5.2% | 7.1% |
Orange County renter turnover rate | 16.0% | 15.4% | 16.2% |
Without both ownership turnover and tenancy turnover, homes do not sell.
The homeowner turnover rate in Orange County remained mostly level during the 2020-2022 pandemic period, around 7%. However, the homeowner turnover rate then dropped to 5.3% in 2024, a difference of an average homeowner selling every 20 years, not every 14 years as is more favorable for brokers, their agents and builders as existed during the pandemic. But motives for turnover change, as triggered by changes in the economy.
Increased mortgage rates initiated most of the turnover attitude shift. Homeowners after 2022 with a low-rate mortgage found selling and acquiring an upgrade with new mortgage funding was way too expensive. The uncertainty of the general economy also triggered caution against taking on relatively expensive debt. However, as the recession sets in for the general economy, mortgage rates will decline, concurrent with price reductions now becoming apparent. Buyers alert to opportunities do step in and acquire property at some point in the decline of property prices.
The renter turnover rate has also generally declined since 2010, running at 16% of all residential tenants moving in 2024, the most recently reported Census year. Tenant turnover behavior indicates they are increasingly staying put, becoming content working with their present living quarters. Great for landlords as vacancy rates decline and operating costs are reduced; not good for agents dependent on leasing, sales and MLO fees.
Expect a consistent increase in the frequency of turnover to arrive when the present undeclared recession ends, likely in 2028. Legislative efforts to force cities and counties to greatly increase the permitting of residential construction will eventually increase housing starts. When sold by a builder, their buyer directly contributes to increased turnover. The buyer is a household which upgraded from renting or owning a residential property they now leave vacant — a turnover of property now available for sale or for lease.
Further, California will pass through the remainder of the current real estate recession, which started in mid-2022, persists in 2026 and likely run into 2028. Orange County will then experience an economic recovery for real estate sales and leasing transactions for all types of property.
This upturn will also be fueled by a Great Convergence of:
- first-time homebuyers (Millennials and members of Generation Z forming households):
- retiring Boomers buying replacement homes; and
- increased for-sale inventory generated primarily by construction starts.
Short sales and REO resales due to mortgage defaults will be in the mix to the extent job losses and mortgage forbearance agreement resets appear in 2026 through 2028.
Homeownership remains low
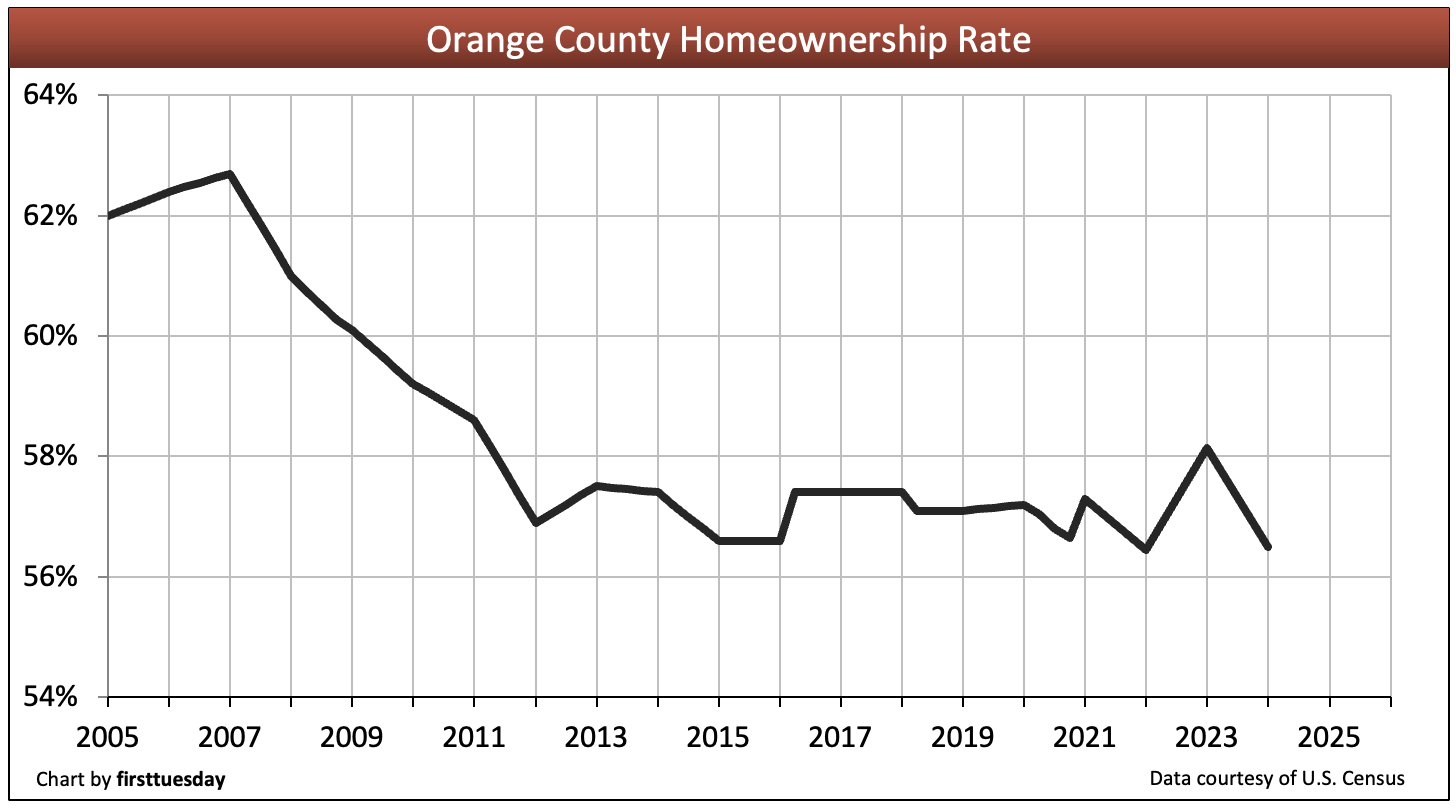
Chart update 12/26/25
| 2024 | 2023 | 2022 | |
| Orange County homeownership | 56.5% | 58.1% | 56.4% |
Orange County’s homeownership rate has fallen since its 2007 peak of 62.7%. The most recent homeownership data shows a 56.5% homeownership rate in Orange County. Statewide homeownership has historically been about two percentage points below Orange County’s, a condition related to a greater aging of the county’s population.
The state average is 55% as of Q4 2025, with recent local homeownership reports not yet available. It is most likely that Orange County’s homeownership rate in 2025 will remain around 57%. The future of homeownership rates — and sales and purchases — depends primarily on whether it is cheaper to rent or to own. Ownership is an issue controlled by the level of new residential housing, personal savings and mortgage rates from year to year.
Expect Orange County’s homeownership rate to remain near its present low level until around 2028. By then, the housing market will begin to bounce back from the strengthening real estate recession underway since 2022. A loss of jobs, retirements and the ownership of second homes are expected to put homes on the market through the 2026-2027 period, a plus for inquisitive seller agents using local data.
However, don’t expect the rate of homeownership to fully return to the inflated heights seen in 2007 anytime soon. The 2007 rate was greatly elevated by unfettered tenant access to easy money, much of it predatory, which mortgage regulators tamped down in 2010 with enforcement of ability-to-pay (ATP) rules and government mortgage guarantees only for ATP qualifying mortgages.
The underlying objective remains to protect society from financially destabilizing types of mortgage lending, though greatly weakened by the federal administration in 2025. The ATP rules still limit mortgage funding to homebuyers with the financial capacity to actually repay their debts in a recession.
ATP rules translate to a slightly lower homeownership rate in the near term. However, they foster long-term stability in the housing market in Orange County and the state to avoid a 2008 five-year foreclosure repeat.
The age-to-buy pattern of the first-time homebuying generation remains as an alternative to renting primarily for skilled and well employed households. As tenants, they now rent for longer periods of time and age more before buying a home than in past generations, due primarily to:
- excessive debt taken on at an early age for education and transportation;
- the lack of routine to build sufficient savings;
- high mortgage rates likely to trend higher for years; and
- no personal experience coping with a business recession which they anticipate.
Construction starts fall back due to shortages
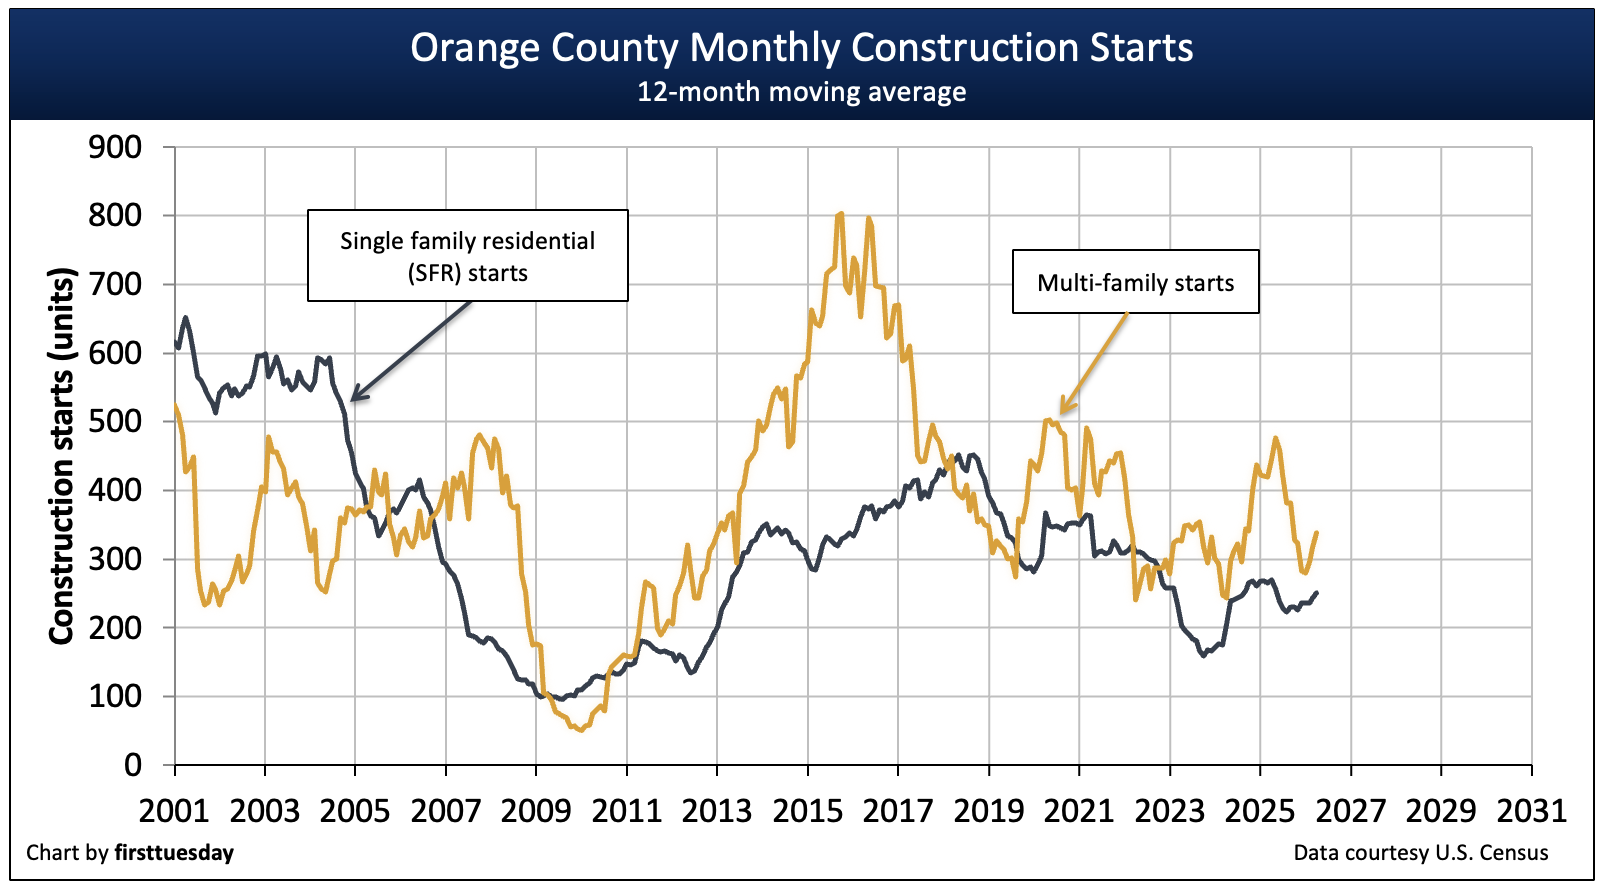
Chart update 06/24/26
| 2025 | 2024 | 2023 | |
| Orange County single family residential (SFR) starts | 2,600 | 3,000 | 2,900 |
Orange County multi-family starts | 2,900 | 4,700 | 3,500 |
An unstable increase took place across both SFR and multi-family construction starts in 2024. The increase came on after the years of decreased starts for multi-family construction and single family residential (SFR) since 2016 and 2018. Both saw a stimulus induced bounce during the two-year covid economy.
Multi-family starts in Orange County totaled just 2,900 in 2025, down 38% from the previous year. SFR starts were down 12% in 2025. The reduced construction starts in 2025 were partly the result of decreased confidence in the Orange County economy held by lenders and builders as tariff wars set in.
The next peak in multi-family and SFR construction starts will likely occur in the post-2028 period due to a boost from recent state legislation. Even then, SFR starts are unlikely to return to the mortgage-driven numbers seen in Orange County during the hyperactive Millennium Boom.
Jobs are recovering, too slowly
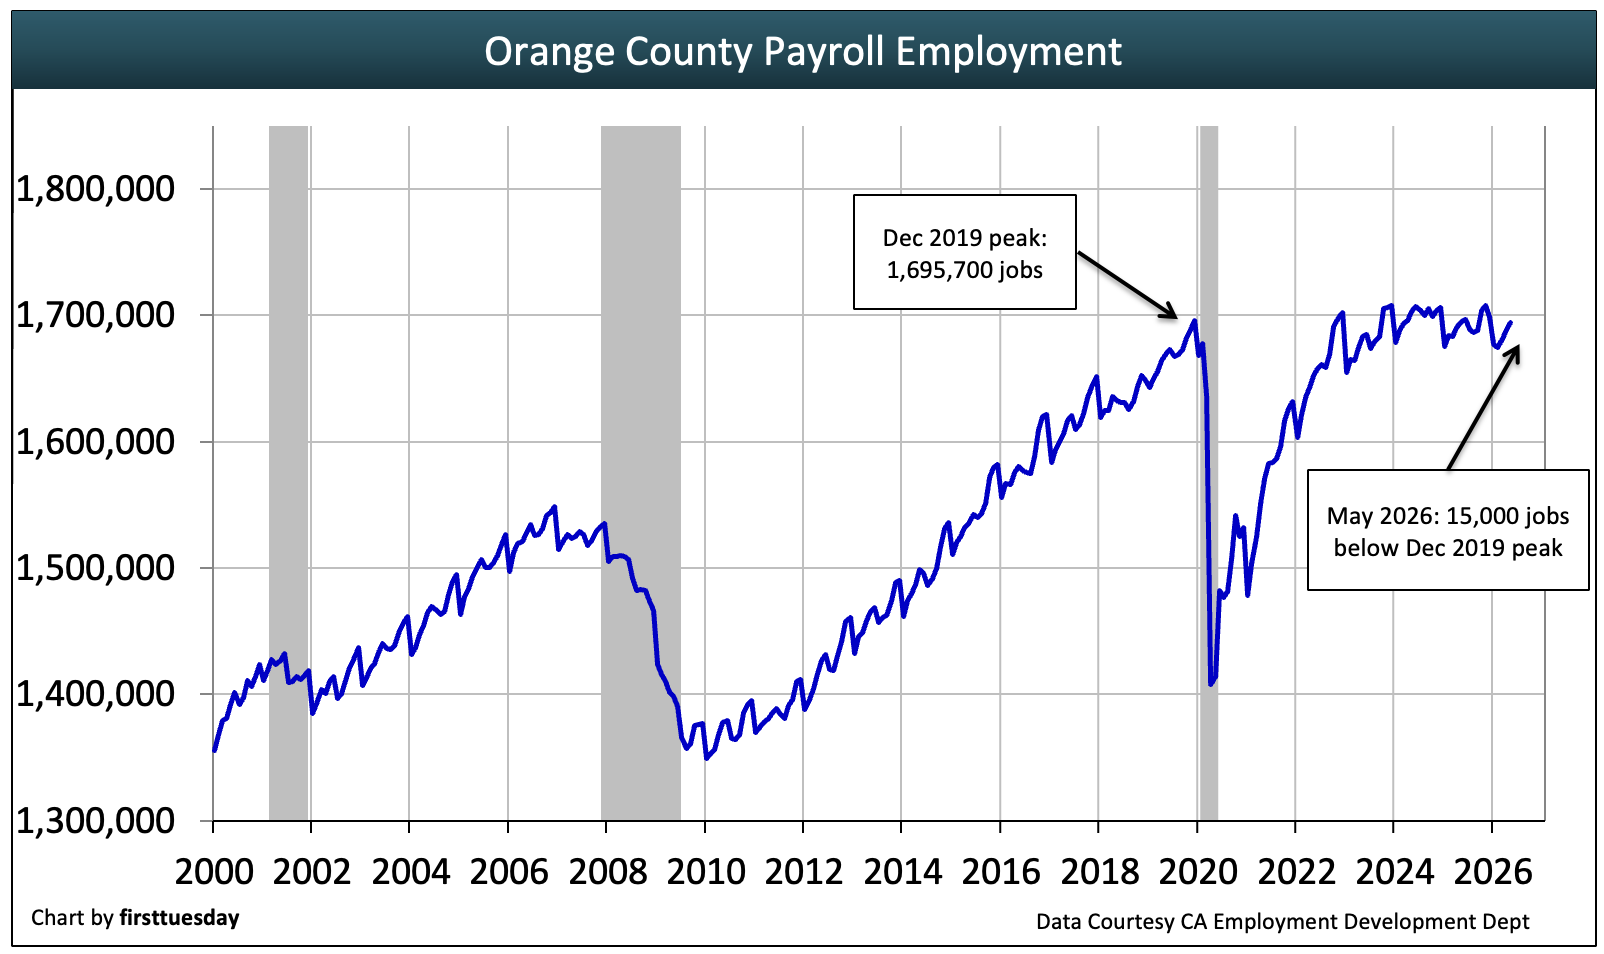
Chart update 06/24/26
| May 2026 | May 2025 | annual change | |
| Orange County jobs | 1,694,200 | 1,695,000 | -0.1% |
Orange County recovered 2020’s historic job losses by 2023, but has since failed to rise beyond that level despite strong job growth in the years leading up to the 2020 recession.
As of May 2026, job numbers remain slightly below one year earlier, continuing a years’ long trend of stagnation.
Jobs in the real estate industry
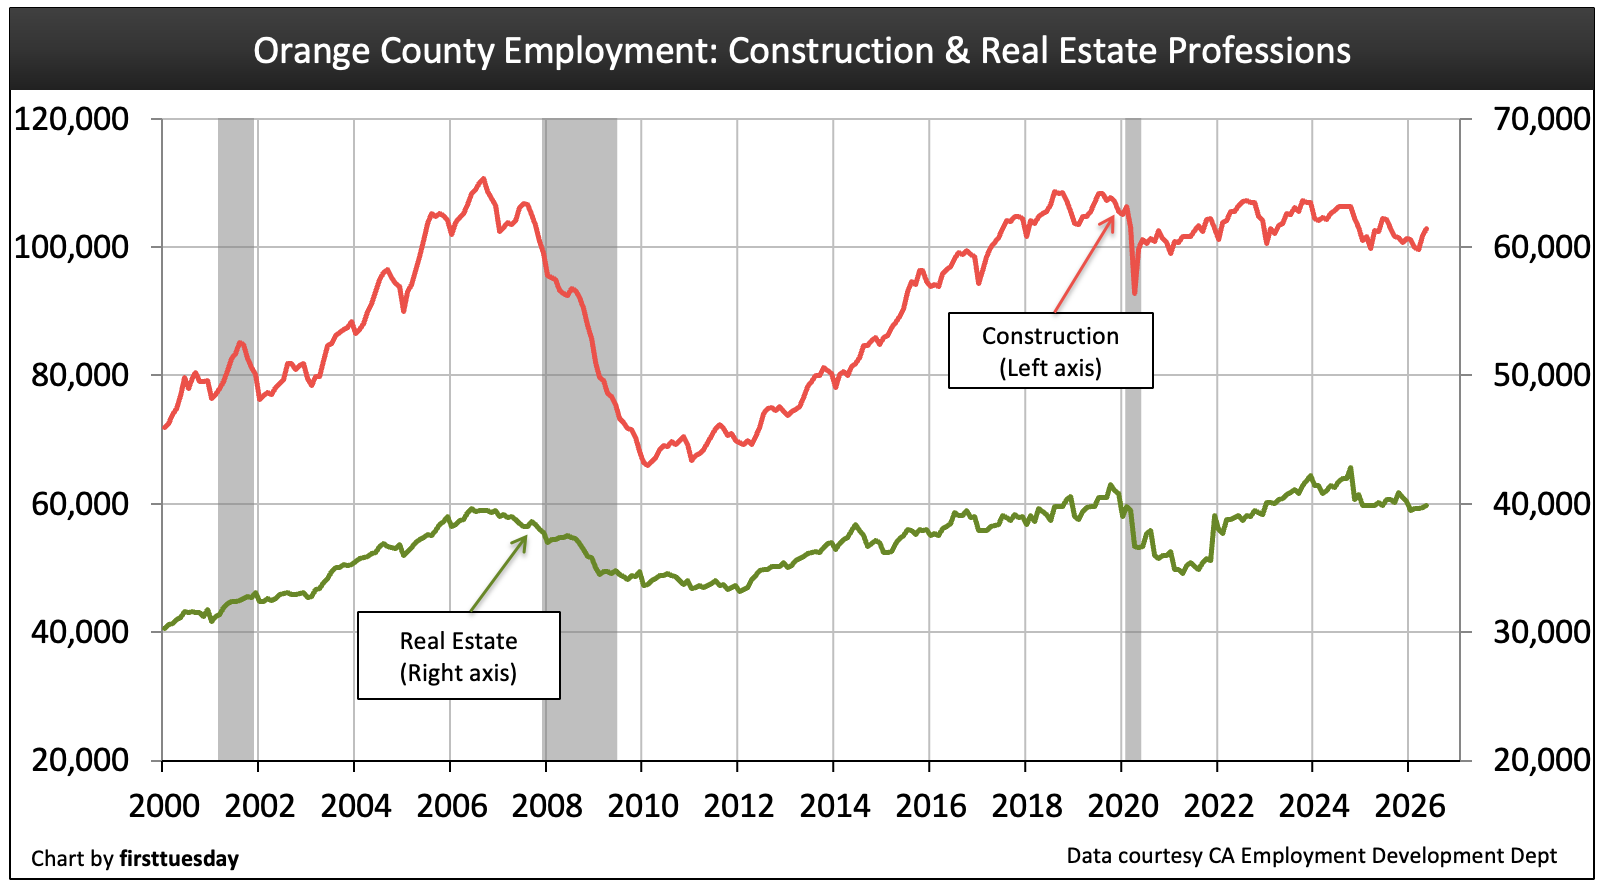
Chart update 06/24/26
| May 2026 | May 2025 | annual change | |
Construction | 102,900 | 102,500 | +0.4% |
Real Estate | 39,900 | 40,100 | -0.5% |
Job numbers for both of the Orange County real estate and construction industries peaked in 2019. However, the number of individuals employed in both the real estate and construction industries decreased in 2025 and are below the 2019 peaks. General caution about anything real estate, including mortgage funding, is driving the stagnation in employment in these industries.
However, over the next several years, Construction jobs are likely to rise, but not real estate jobs. State zoning and construction permit legislation, enforced by the OAG, has aggressively focused on adding more housing inventory in Orange County.
2025 legislation clarified rules of contract law for broker representation of buyers acquiring interests in all types of real estate. When implemented by brokers, the conduct will foster better bonding much needed with buyers. But compliance requires the big brokerage offices to advise their agents to comply. The hesitation is compliance cuts into profits for brokers with more than just a few agents and broker associates unless they restructure their brokerage services.
The real estate industry is expected to see jobs appreciably increase beginning in 2028, energized by a recovery from the very real (but unspoken) real estate recession currently underway.
Related article:
Buyer Representation Agreements: The end of the “gold standard”
Per capita income plays catch up

Chart update 3/24/25
| 2023 | 2022 | Annual change | |
| Orange County per capita income | $88,900 | $84,100 | +5.7% |
| California per capita income | $81,300 | $76,900 | +5.6% |
The average income earner in Orange County made $88,900 in 2023 (the most recent data from the federal Bureau of Economic Analysis).
Sustainable home price increases are limited to a ceiling set by growth in personal income. The annual rate of income increase in 2022 in this region was 5.7%. Buyer and tenants are only able to pay what their incomes allow them to spend. However, mortgage borrowing during the pandemic was leveraged by interest rates at one-half market rates. This covid economy stimulus caused buyer purchasing power to leap in 2020-2021, and with it home prices to absorb the increased borrowing.
Yet, as interest rates abruptly reversed course in 2022 — which have plateaued at double the covid level — buyer purchasing power fast lost steam needed to pay the asking price of homes.
Home sales now stand on their own absent the 2020-2021 government stimulus support in the form of cash and artificially low mortgage rates. Thus, going forward, real estate prices will remain flat as they have since the mid-2022 pricing peak and not move upward until jobs numbers increase or for sale inventory expand to nearly one year’s supply. Expect future increases in property pricing to run close to the annual rate of consumer inflation, until the flareup in sales during the next boom-time event.
Through the fog of international trade chaos, look to 2028 for the starting point of the next rise in property sales volume and prices. When world trade issues remain in conflict as initiated in 2025 and continue today, we will see job losses and in turn some forced sales of property to avoid foreclosures for lack of personal income.
The next recovery period for real estate sales, leasing and mortgage originations will be driven by the shifting demographic trends of retiring Baby Boomers and their Millennial and Gen Z counterparts who simultaneously become homebuyers. Investors will return when they sense they can fill their boots with cheaply priced income property, which is what real estate recessions are all about.


Great presentation, but how do the numbers play under our new Covid19 environment?
Curious if the slow down in China is factored into these numbers. There are huge swaths of Irvine that are nearly 100% Chinese nationals purchasing with cash. The slow down in China (along with the Russian sanctions), have already caused a huge price drop and slow down in NY City’s apartment sales. Not that I expect Irvine to suffer in the same way as NY City, but I would think it would shave a point or two off these projections. Irvine has been a huge factor in new and existing home sales for some time now. Any effect in that market would have an out sized effect on Orange County’s numbers overall.
Great charts and information.
We’ve had modest rises in home price appreciation so far. Jobs are strong, demand is strong. No crash coming as borrowers aren’t buying with fake income like back in 2007. It is verified.
Orange County market is going to see a big crash and minimum 30% drop in value in 2017. It will become a buyer’s market as it was in 2010. Builders are building and property owners are selling higher than the new homes sales! It is time for a big change.
Orange County will remain a heavily demanded destination for home buyers. There is not going to be any drop in prices or increases in inventory. Where else are Orange County residents going to move and have the same benefits, nowhere. Also, the boomers are retiring and are going to have the freedom to enjoy more fully all the amenities available to them this location offers. My tenants are asking for multi-year leases, the first time since the recovery and so far I am keeping them at 1 year only. My advice if you are in the market to purchase grab something and lock in the still historically low interest rates available now.
I hope it crashes and burns to the ground. After it does, im coming in strong and buying! Brun baby, burn!!!
Azar = wrong
$1,000,000 house in Orange County will drop to $700,000? Ok AZAR time to take your medication…
Turnover rates are likely to rise dramatically in the convergent 2019-2021 boomlet period raising rental vacancy rates. Then, members of Generation Y (Gen Y) will collectively first rush to buy but since their income and job security is considerably low they end up renting and housing market is going to crash sometimes between 2017-2020.
This author is using a lot of definitive verbiage on the future. As an example, “Sales volume will bottom again in 2017 before rising continuously into 2019-2020.” Shouldn’t the word “likely” be in there somewhere, since the author is making a prediction based upon a range of possible outcomes and the future is inherently uncertain?
Sam it’s. Common for analysts to use definitive language. It strengthens their prediction by showing they fully believe it and are not riding the fence by saying what it might do.
this article is post 2015…. yet above comments were make 2013?? there is research done by citi, regarding if central bank in china or Russia or Norway sell 2 trillion t bills that will make rate jump 4.4% adding current 3% to around 7.4%!!! if that happened imho…. we could c house prices 5 to 6 folds in a snap??? 2015-11
Good incos, Thank you.
Home prices aren’t limited because we have 30% cash buyers in the market with a low inventory hang over. The market is not the best indicator to correlation to DTI this time because to many cash buyers who don’t need income to buy and a major inventory crisis here
home price appreciation is limited to a ceiling set by personal income, the annual rate currently being 3.4%
Not correct. This is only one of many factors.
Housing Inventory Crisis is # 1 reason why home prices are rising. Prices are now rising faster than incomes and because CASH buyers are so prevalent it creates distortion in market prices. We will pay for this down the line. Mini Bubble 2.0 in full motion
http://loganmohtashami.com/2013/02/27/housing-inventory-hangover-will-continue-in-2013/