
Why this matters: When real estate agents hook up with readily available market data, their capacity to advise clients improves. Today’s uptick in deepening uncertainty about all factors driving property value is best tackled by continuously reviewing information for insight into the non-stop change in human behavior affecting real estate transactions.
The cyclical rise in mortgage rates bent by wars
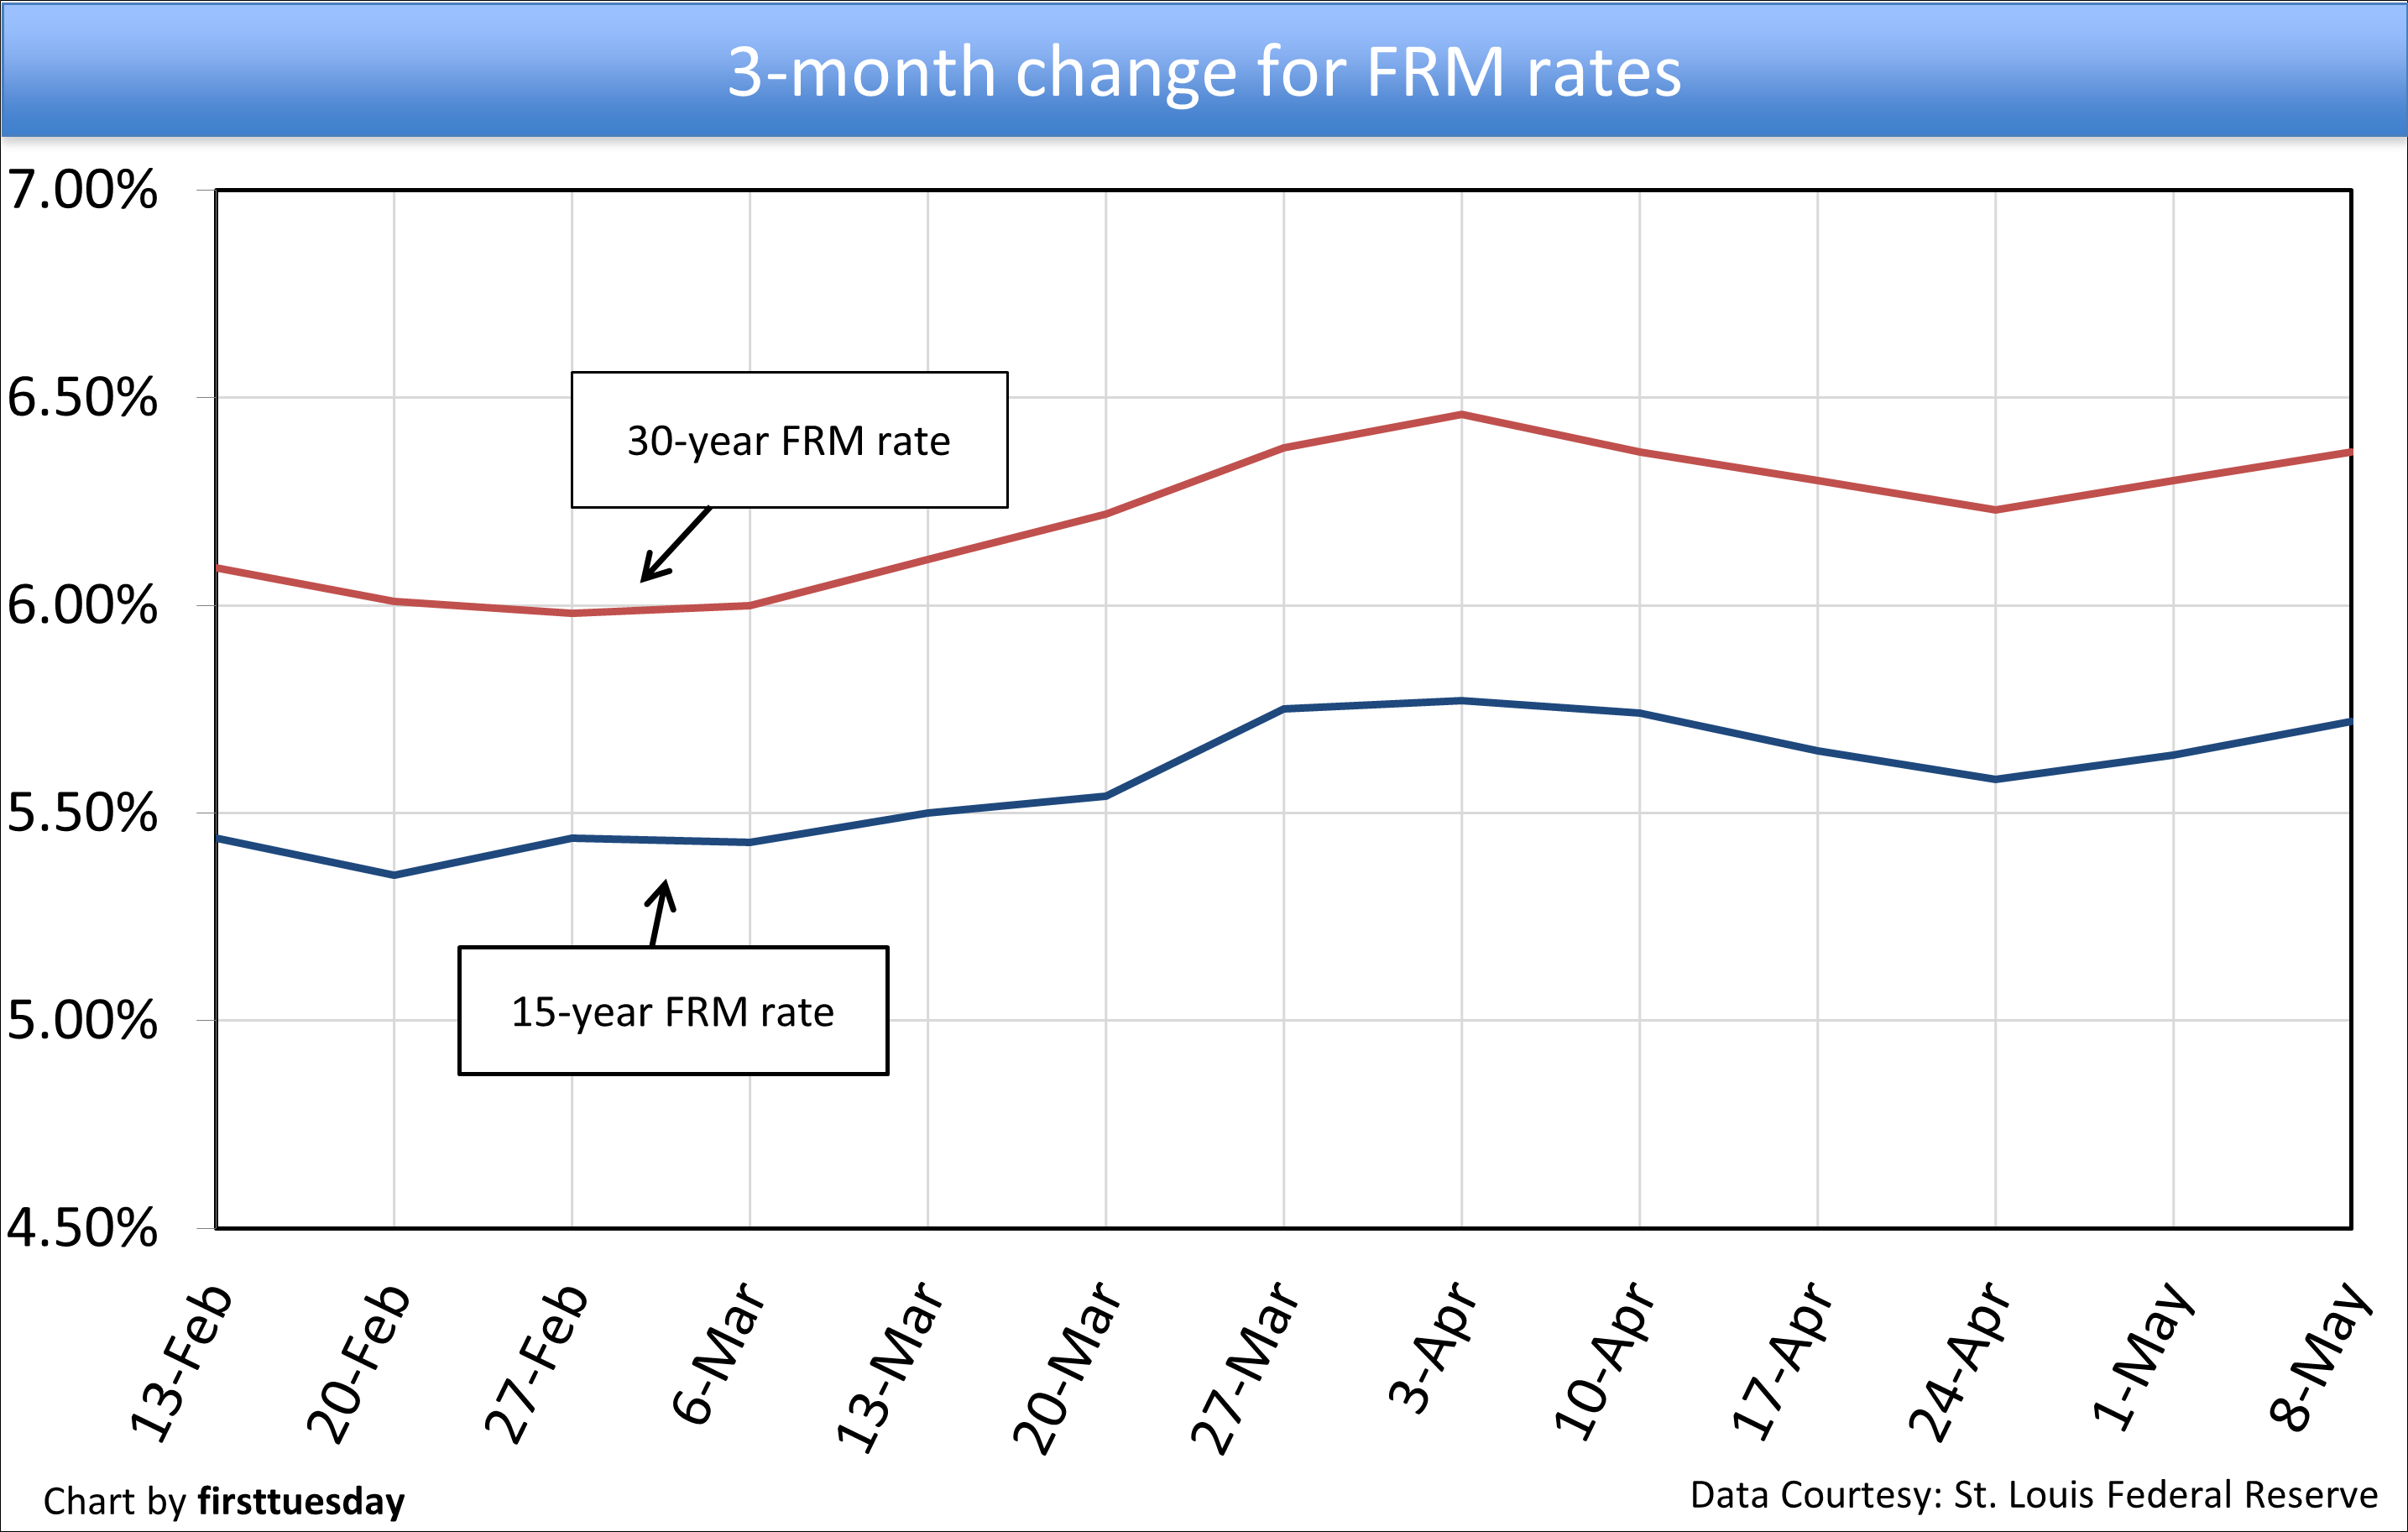
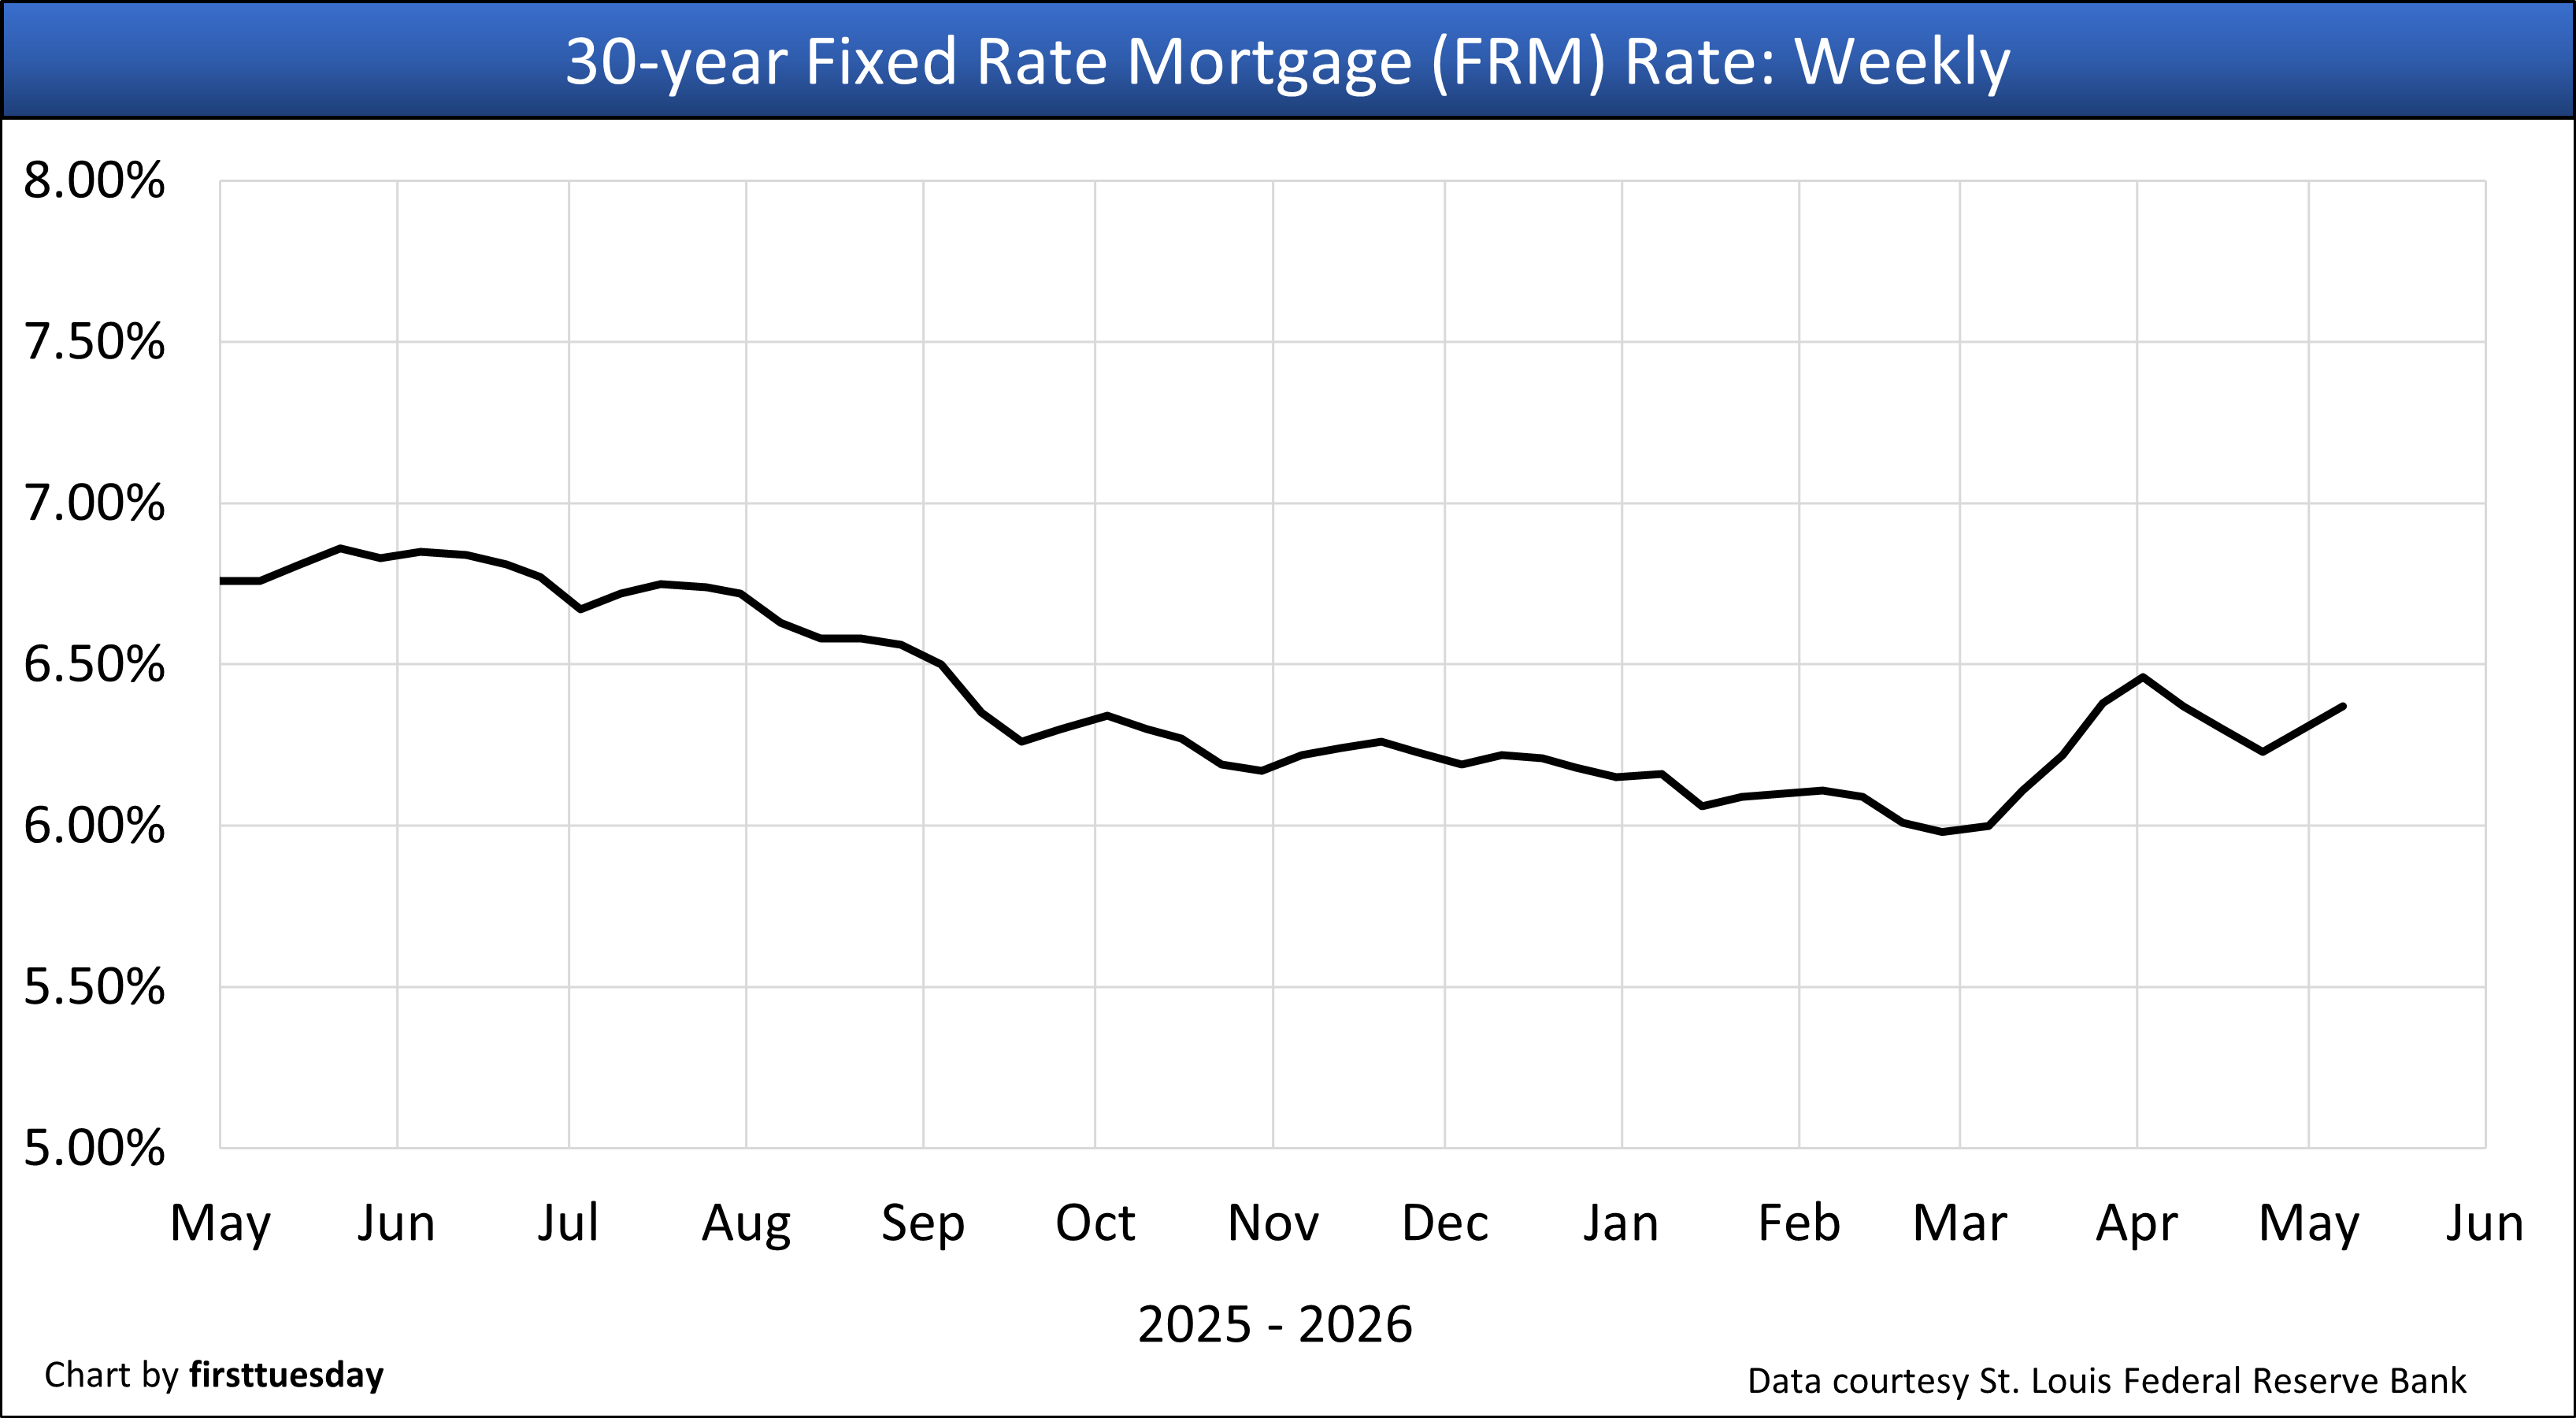
The rate on an average 30-year fixed rate mortgage (FRM) advanced to 6.37% in the week ending May 8, 2026. The average 15-year FRM lifted to 5.72%. For those able to switch, the lower 15-year FRM represents a significant decrease in the amount of interest paid over the life of the mortgage.
In addition to the annual interest rate being one-tenth less expensive than the 30-year FRM, the 15-year FRM also pays off the principal more quickly through amortization as monthly payments are larger. Originating a 15-year FRM, rather than a 30-year FRM, saves around 60% on the total interest paid on a 30-year FRM with a principal amount of $500,000. Meaning a 30-year mortgage requires payments of more than double the interest, an additional expense that drastically reduces the homeowner’s standard of living after 15 years.
The war in the Middle East initiated February 28, 2026, instantly and adversely altered real estate economics across the board. For 2026, you may well watch FRM rates gradually work their way lower as savings increase and real estate transactions decrease. Tariff wars in 2025 destabilized job growth and increased consumer inflation which will not end quickly.
The Fed task for setting short-term interest rates is today disrupted by the fast-rippling effects on all products made from oil — plastics for construction and consumer stuff, fertilizer for grocery products, fuel for transportation. And, meanwhile, the effects remain from the pandemic and current government-administrated interference with trade and migratory labor. The uncertainty of existing wars drives hording precious metals but not the acquisition of real estate interest.
Until upward consumer inflation is reversed, short-term interest rates — or a reduction in jobs, or both — will reduce consumer spending and household debt while increasing savings. As always, pricing of consumer goods rise but will do so at a slower rate. Meanwhile asset prices (read: real estate, etc.) decline and wages of the employed increase to cover recent consumer inflation.
However, it is the dramatic increase in long-term rates for mortgages, which have not yet peaked, that has brought mortgage-funded real estate transactions to a serious slowdown until the interferences recede. The 2026 annual cycle for the spring bounce in sales volume and pricing was going nowhere before the Iran War. Then the conflict put end to deal making for buyers dependent on mortgage funding — until the war ends and a calm certainty sets in.
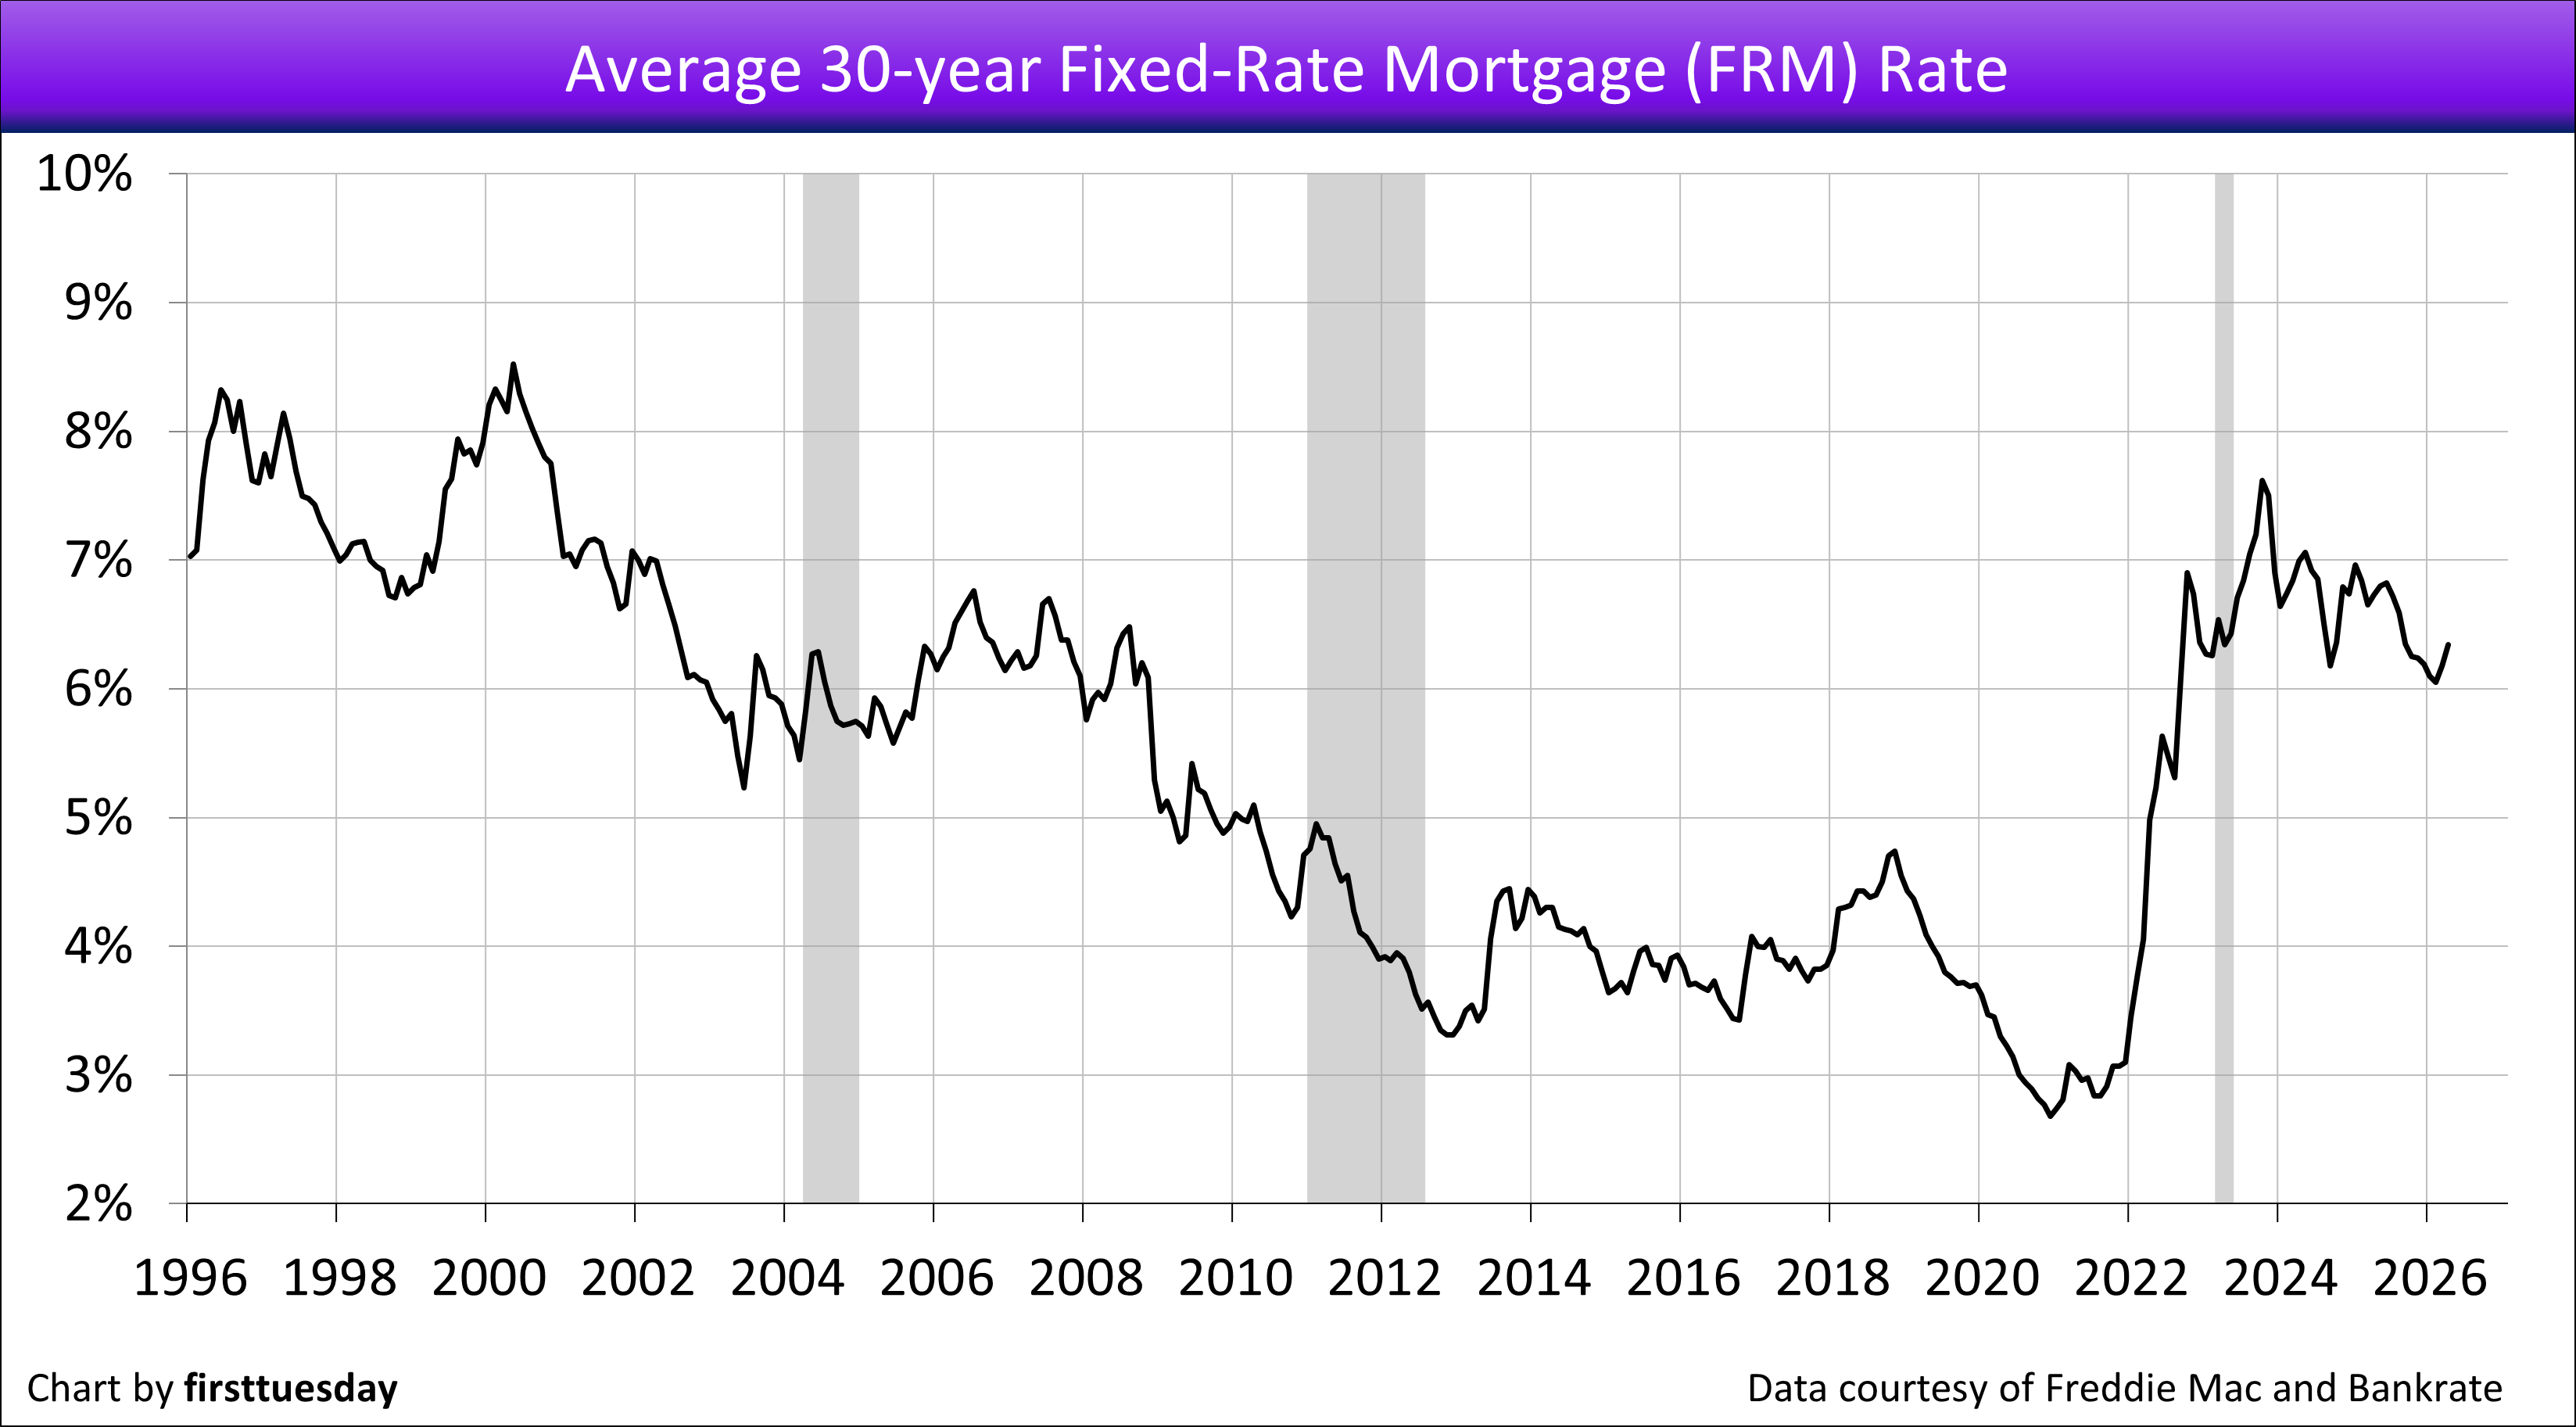
Regardless of FRM rate movement in the continuing real estate recessionary period through 2026, expect a long-term upward trend in mortgage rates to follow. The trend commenced in 2013 with the onset of a half-cycle of rising rates on all borrowing and is likely to run for around two more decades.
That said, current government interference with the economy is spilling over into real estate by adversely affecting homebuyer willingness, user turnover rate, and costs of residential construction. Thus, a real estate rigor mortis environment is settling in.
An increase in federal tax revenues — or Federal Reserve bond buying — will soon be needed to offset government demand for cash, unless the people who pay taxes pay more taxes. In turn, expect long-term interest rates to remain high, as will mortgage rates in sympathy.
Two further situations cause mortgage rates to stay high and tend to rise. Privatizing quasi-government mortgage agencies, like Freddie Mac, will enhance mortgage lender profit-sharing as reduced oversight increases mortgage lender risk of loss. The tandem follow on is that mortgage lender losses are socialized by government mortgage guarantees and not borne by the lenders.
Remember the rule: All financial deregulation goes up in flames. Our last reminder was 2005 which did not go well, but we forget.
Buyers increasingly stay away, until when?
In the longer term, today’s property prices are undermined by high FRM rates. Likewise, all income property values decline as capitalization rates do rise in sympathy with long-term interest rates, a yield-spread cost borne by the current owners of real estate assets, not buyers. High FRM rates and cap rates reflect the pattern of rising long-term interest rates that took root in 2013.
In application, property pricing is primarily supported by the amount a buyer can borrow to fund a purchase. Higher and higher mortgage rates translate into reduced ability to pay yesterday’s prices.
The annual increases in FRM rates experienced since 2013 force sellers to eventually drop prices or exit the for-sale market as for-sale and for-lease inventories rise. An exception is the annual spring bounce in sales volume, which weakened each year since 2021.
As for homebuyers dependent on purchase-money mortgage funding, and particularly first-time buyers under the age of 35, they either:
- reduce their standard of living and acquire property priced in a lower tier, a less likely choice going forward; or
- wait out dropping or static property prices until pricing matches the reduced buyer purchasing power brought on by high mortgage rates, a match now well on its way since property pricing peaked in mid-2022 and flattened.
Buyers dependent on mortgage funding increasingly sense property acquisition today is incompatible with the double whammy of purchasing an over-priced property with mortgage funding at high FRM rates. Rational prospective buyers increasingly remain on the sidelines — ready and able, but less willing to borrow and buy.
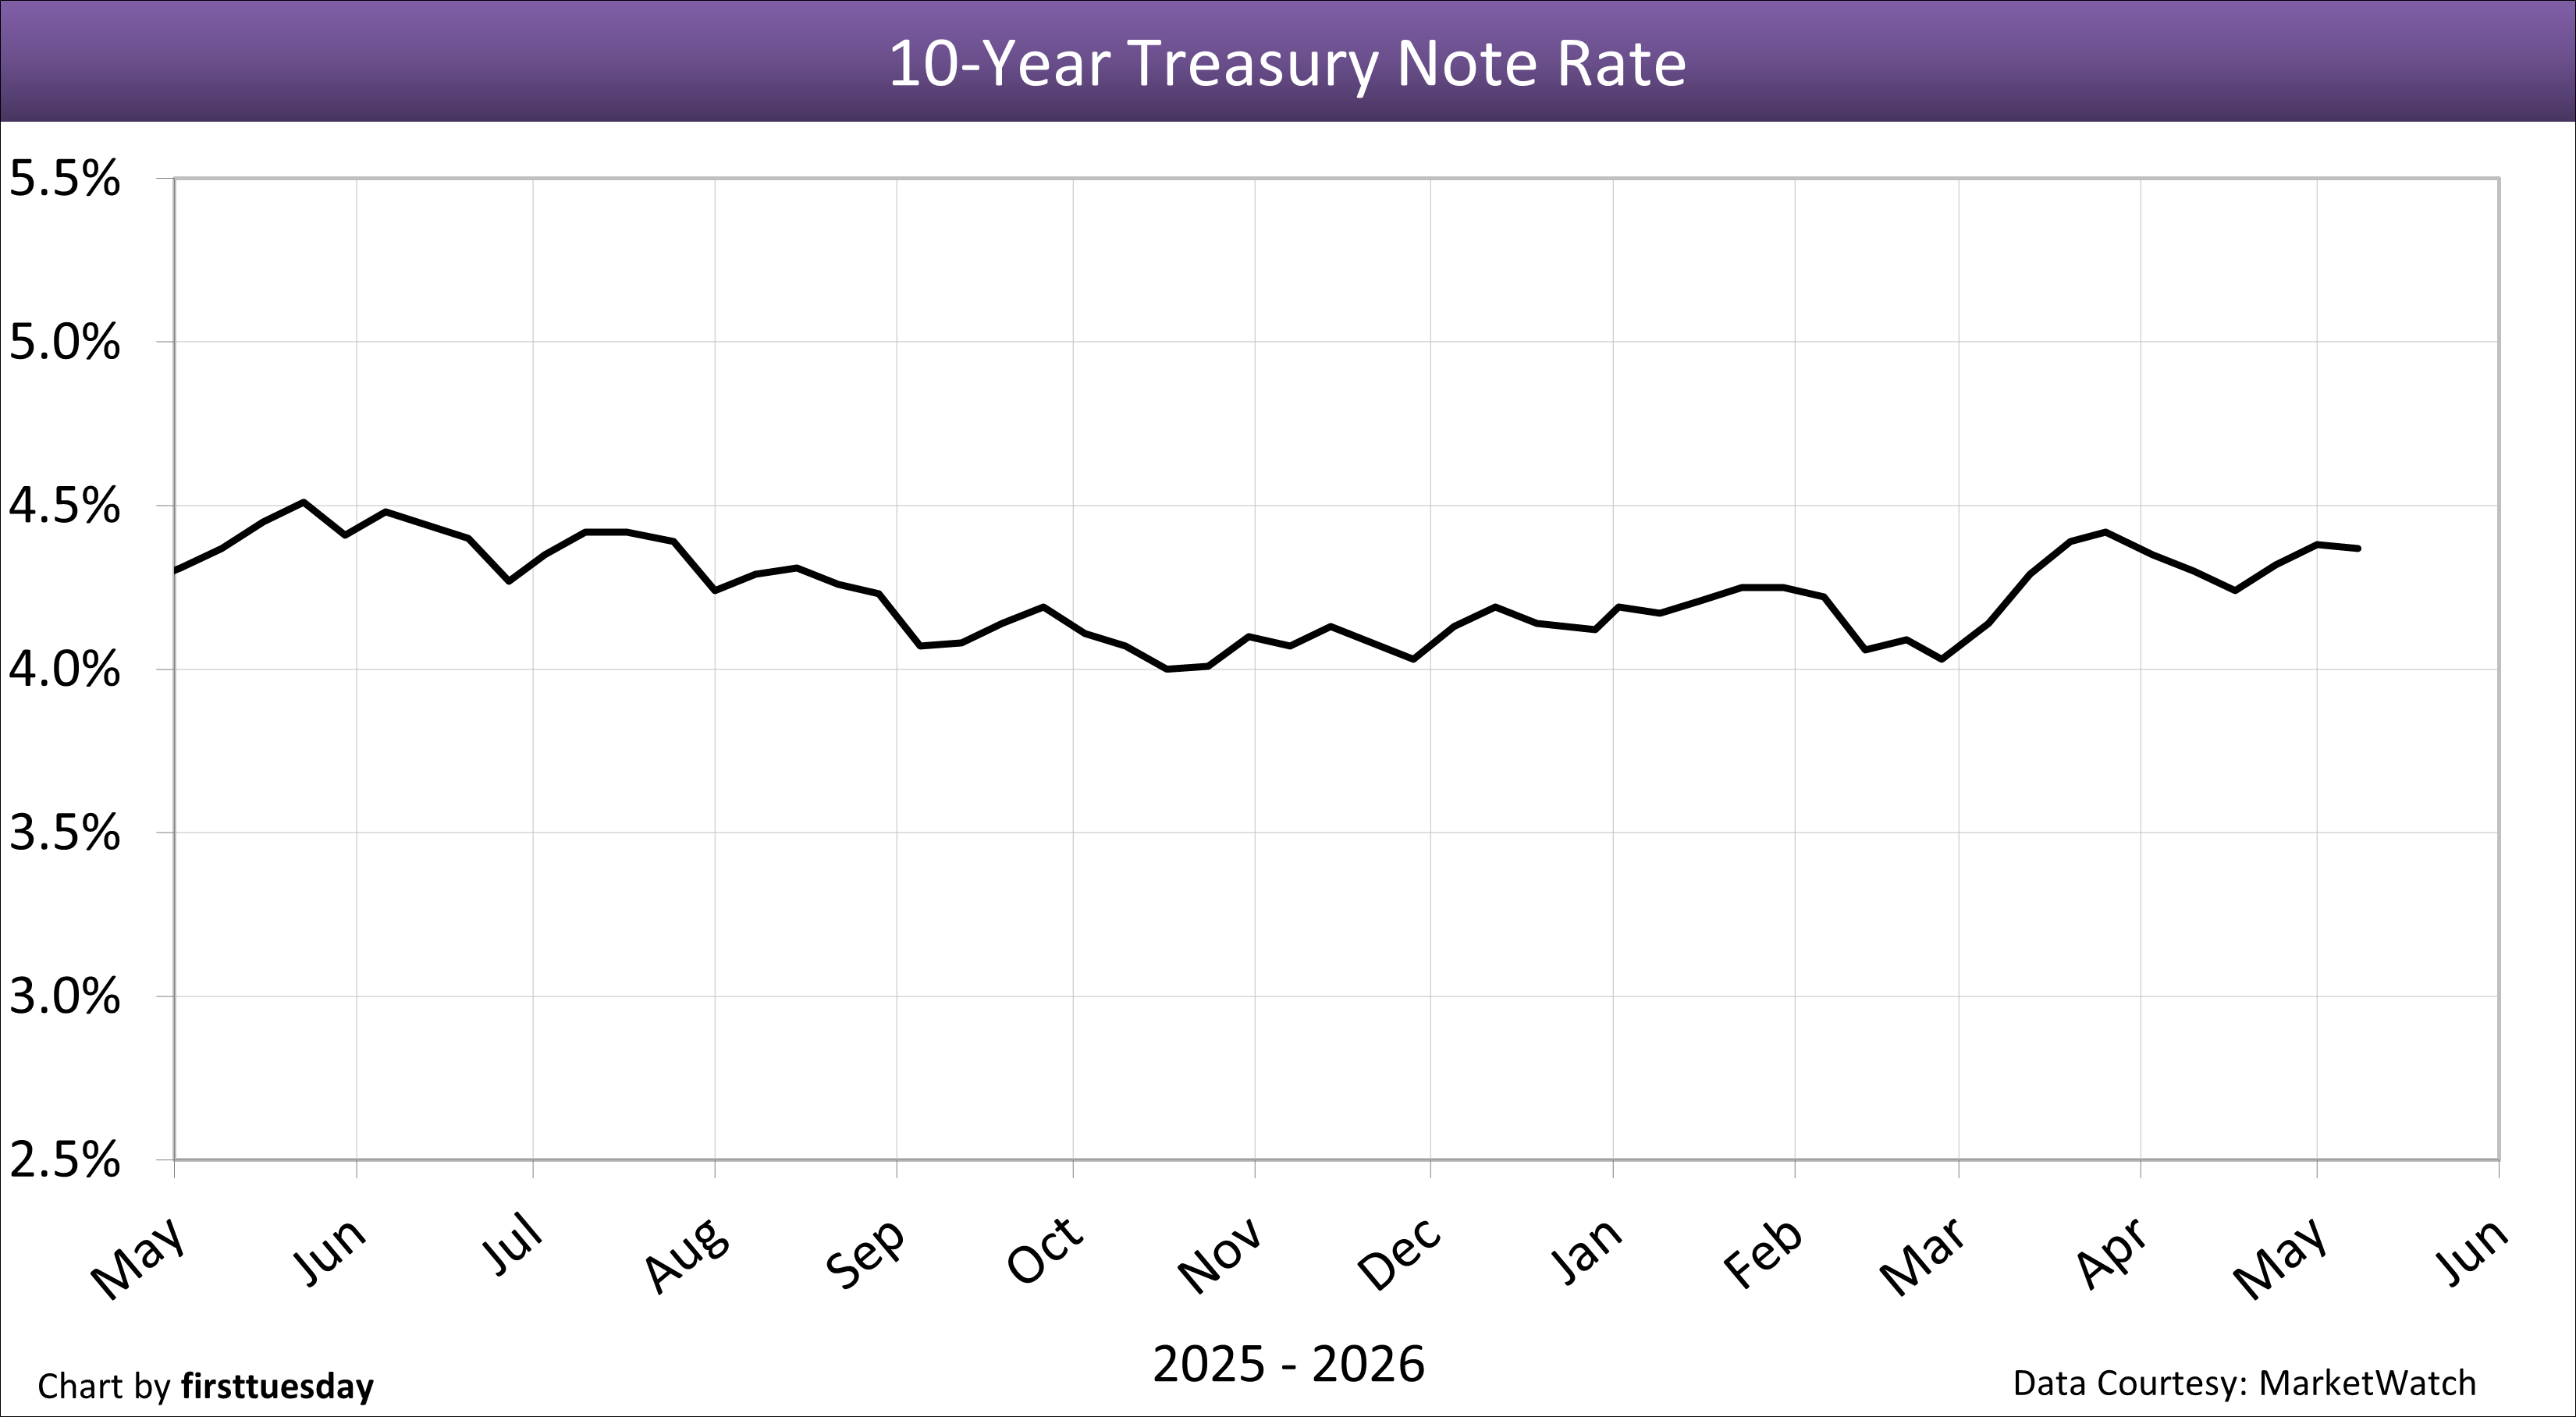
Fundamentally, FRM rates are tied to the 10-year Treasury note market, as are capitalization (cap) rates for setting income property prices. The 30-year FRM rate moves in tandem with the 10-year Treasury note rate, to which MLOs add a risk premium of between 1.5% and 3.0% based on a perceived risk of loss on mortgage defaults. Historically, the risk premium spread between the 10-year T-Note rate and the 30-year FRM rate in normal times is 1.5%. The spread is far greater for property investor cap rates to set property value.
The 10-year T-Note dipped to 4.37% on May 8, 2026. The spread between the 10-year T-Note and 30-year FRM rate is 2.0%, gradually returning to the historical risk premium spread of 1.5%.
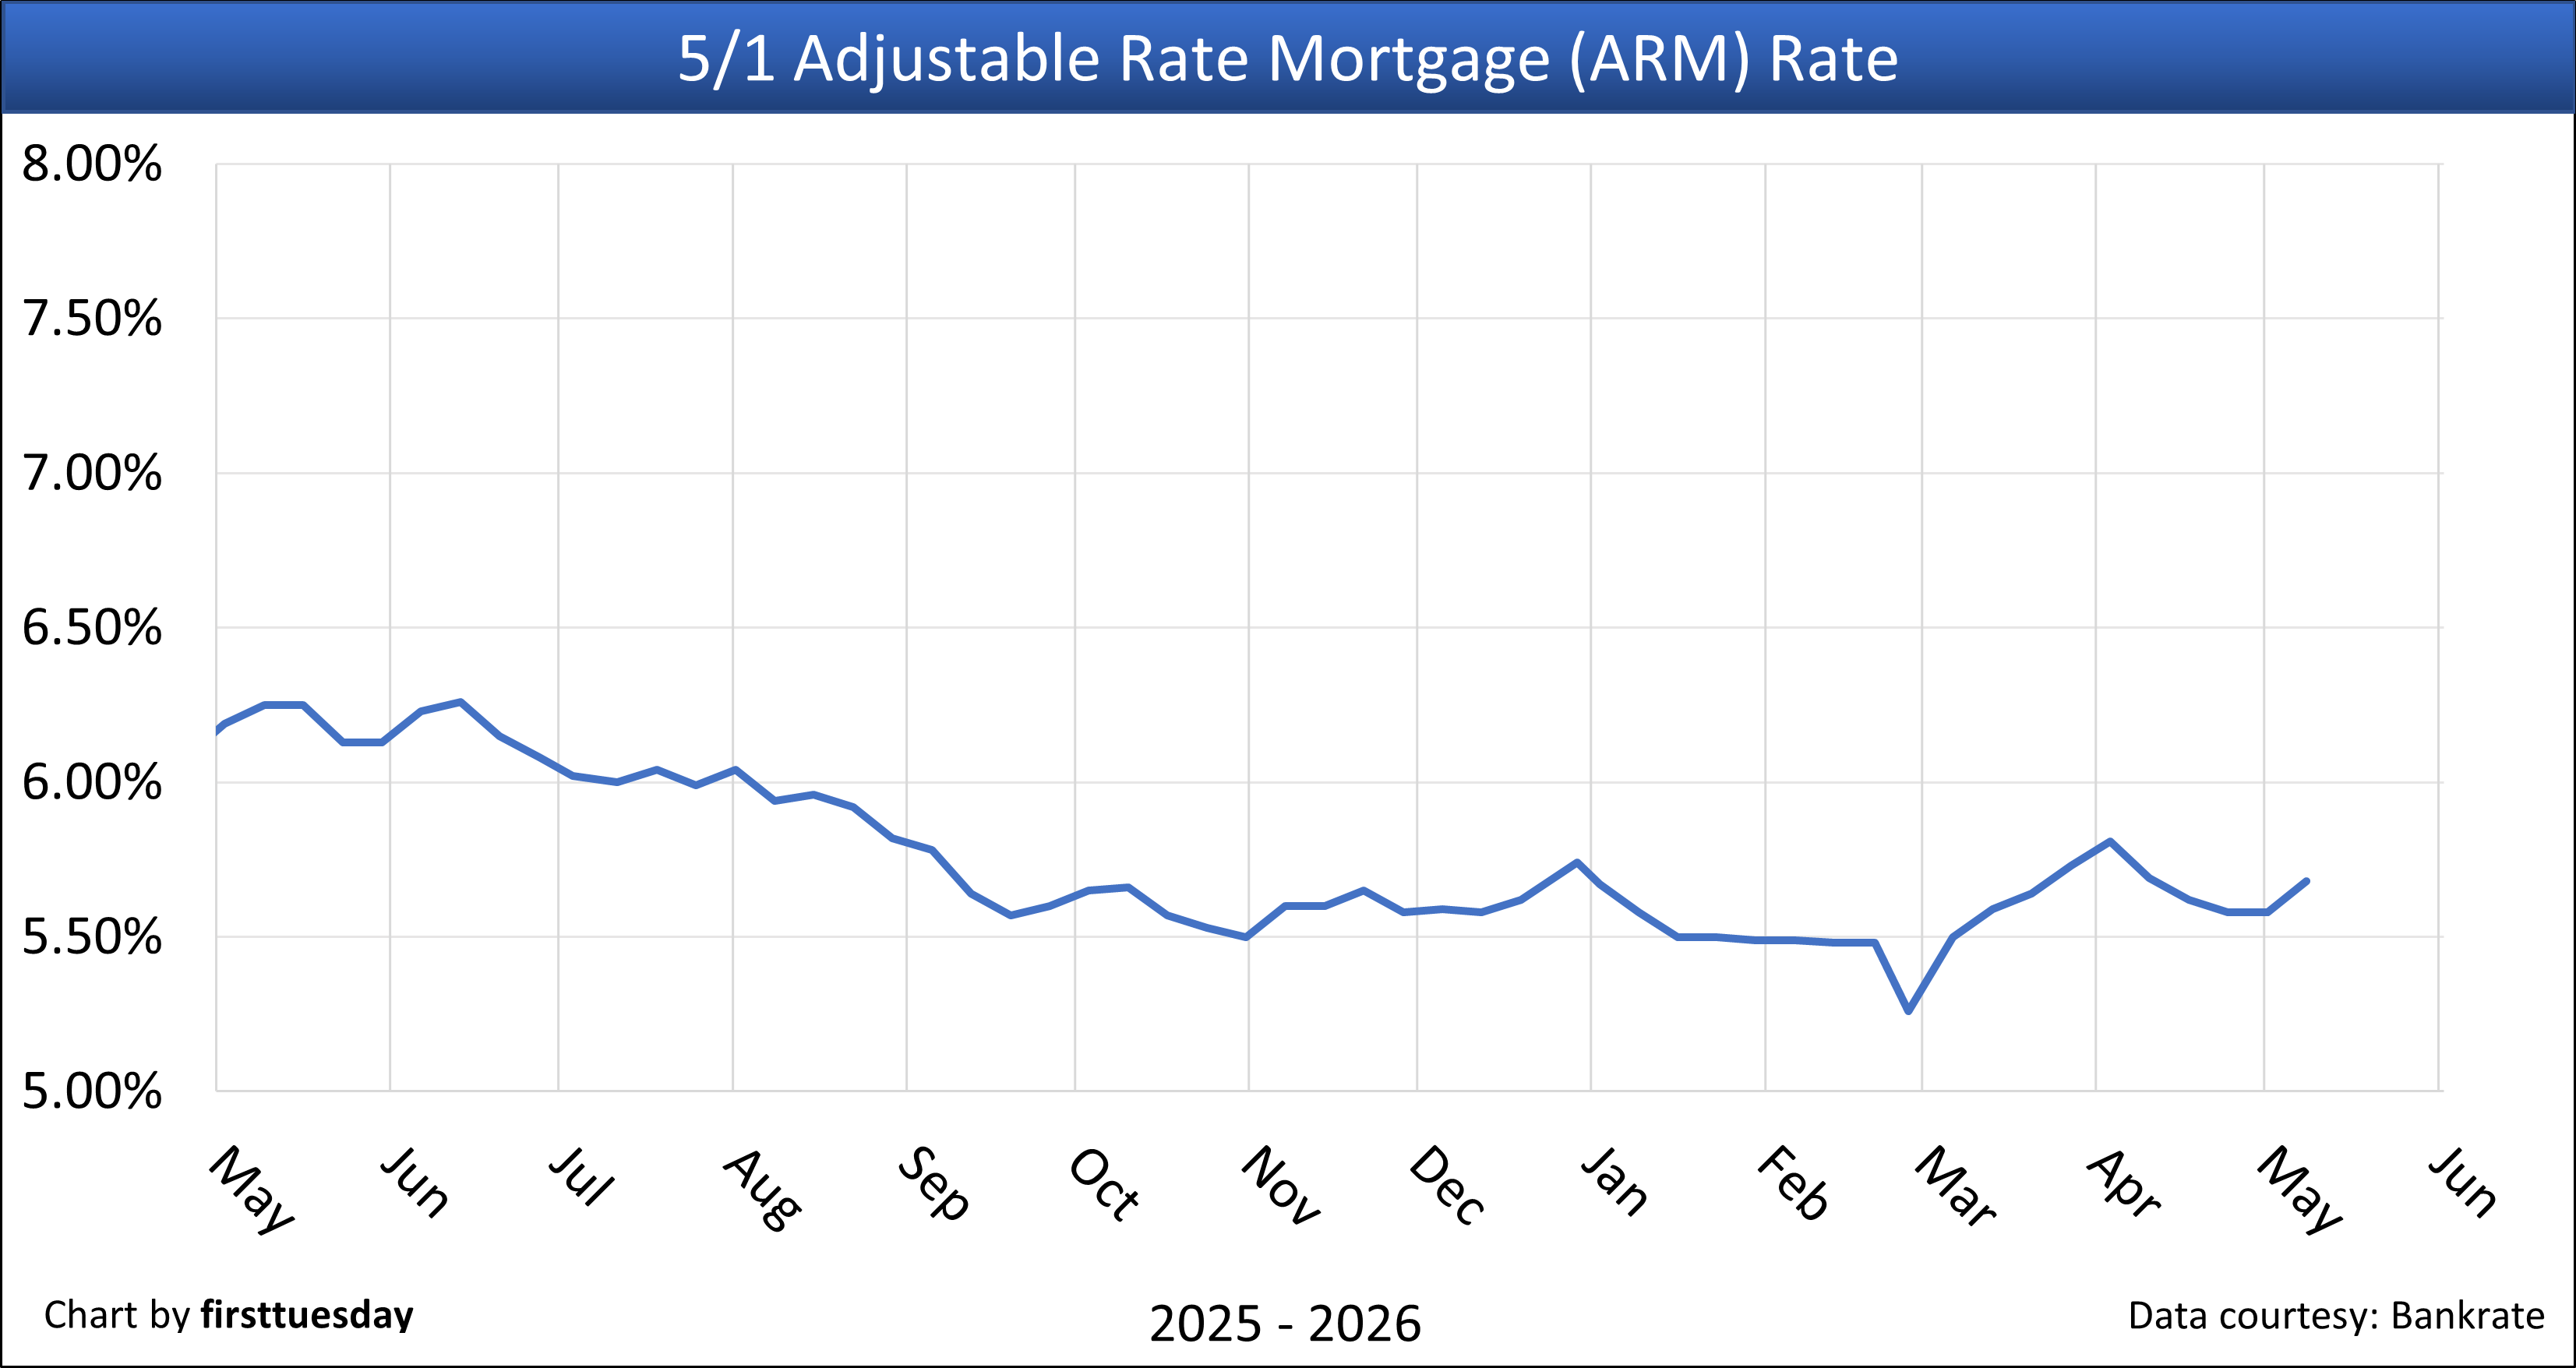
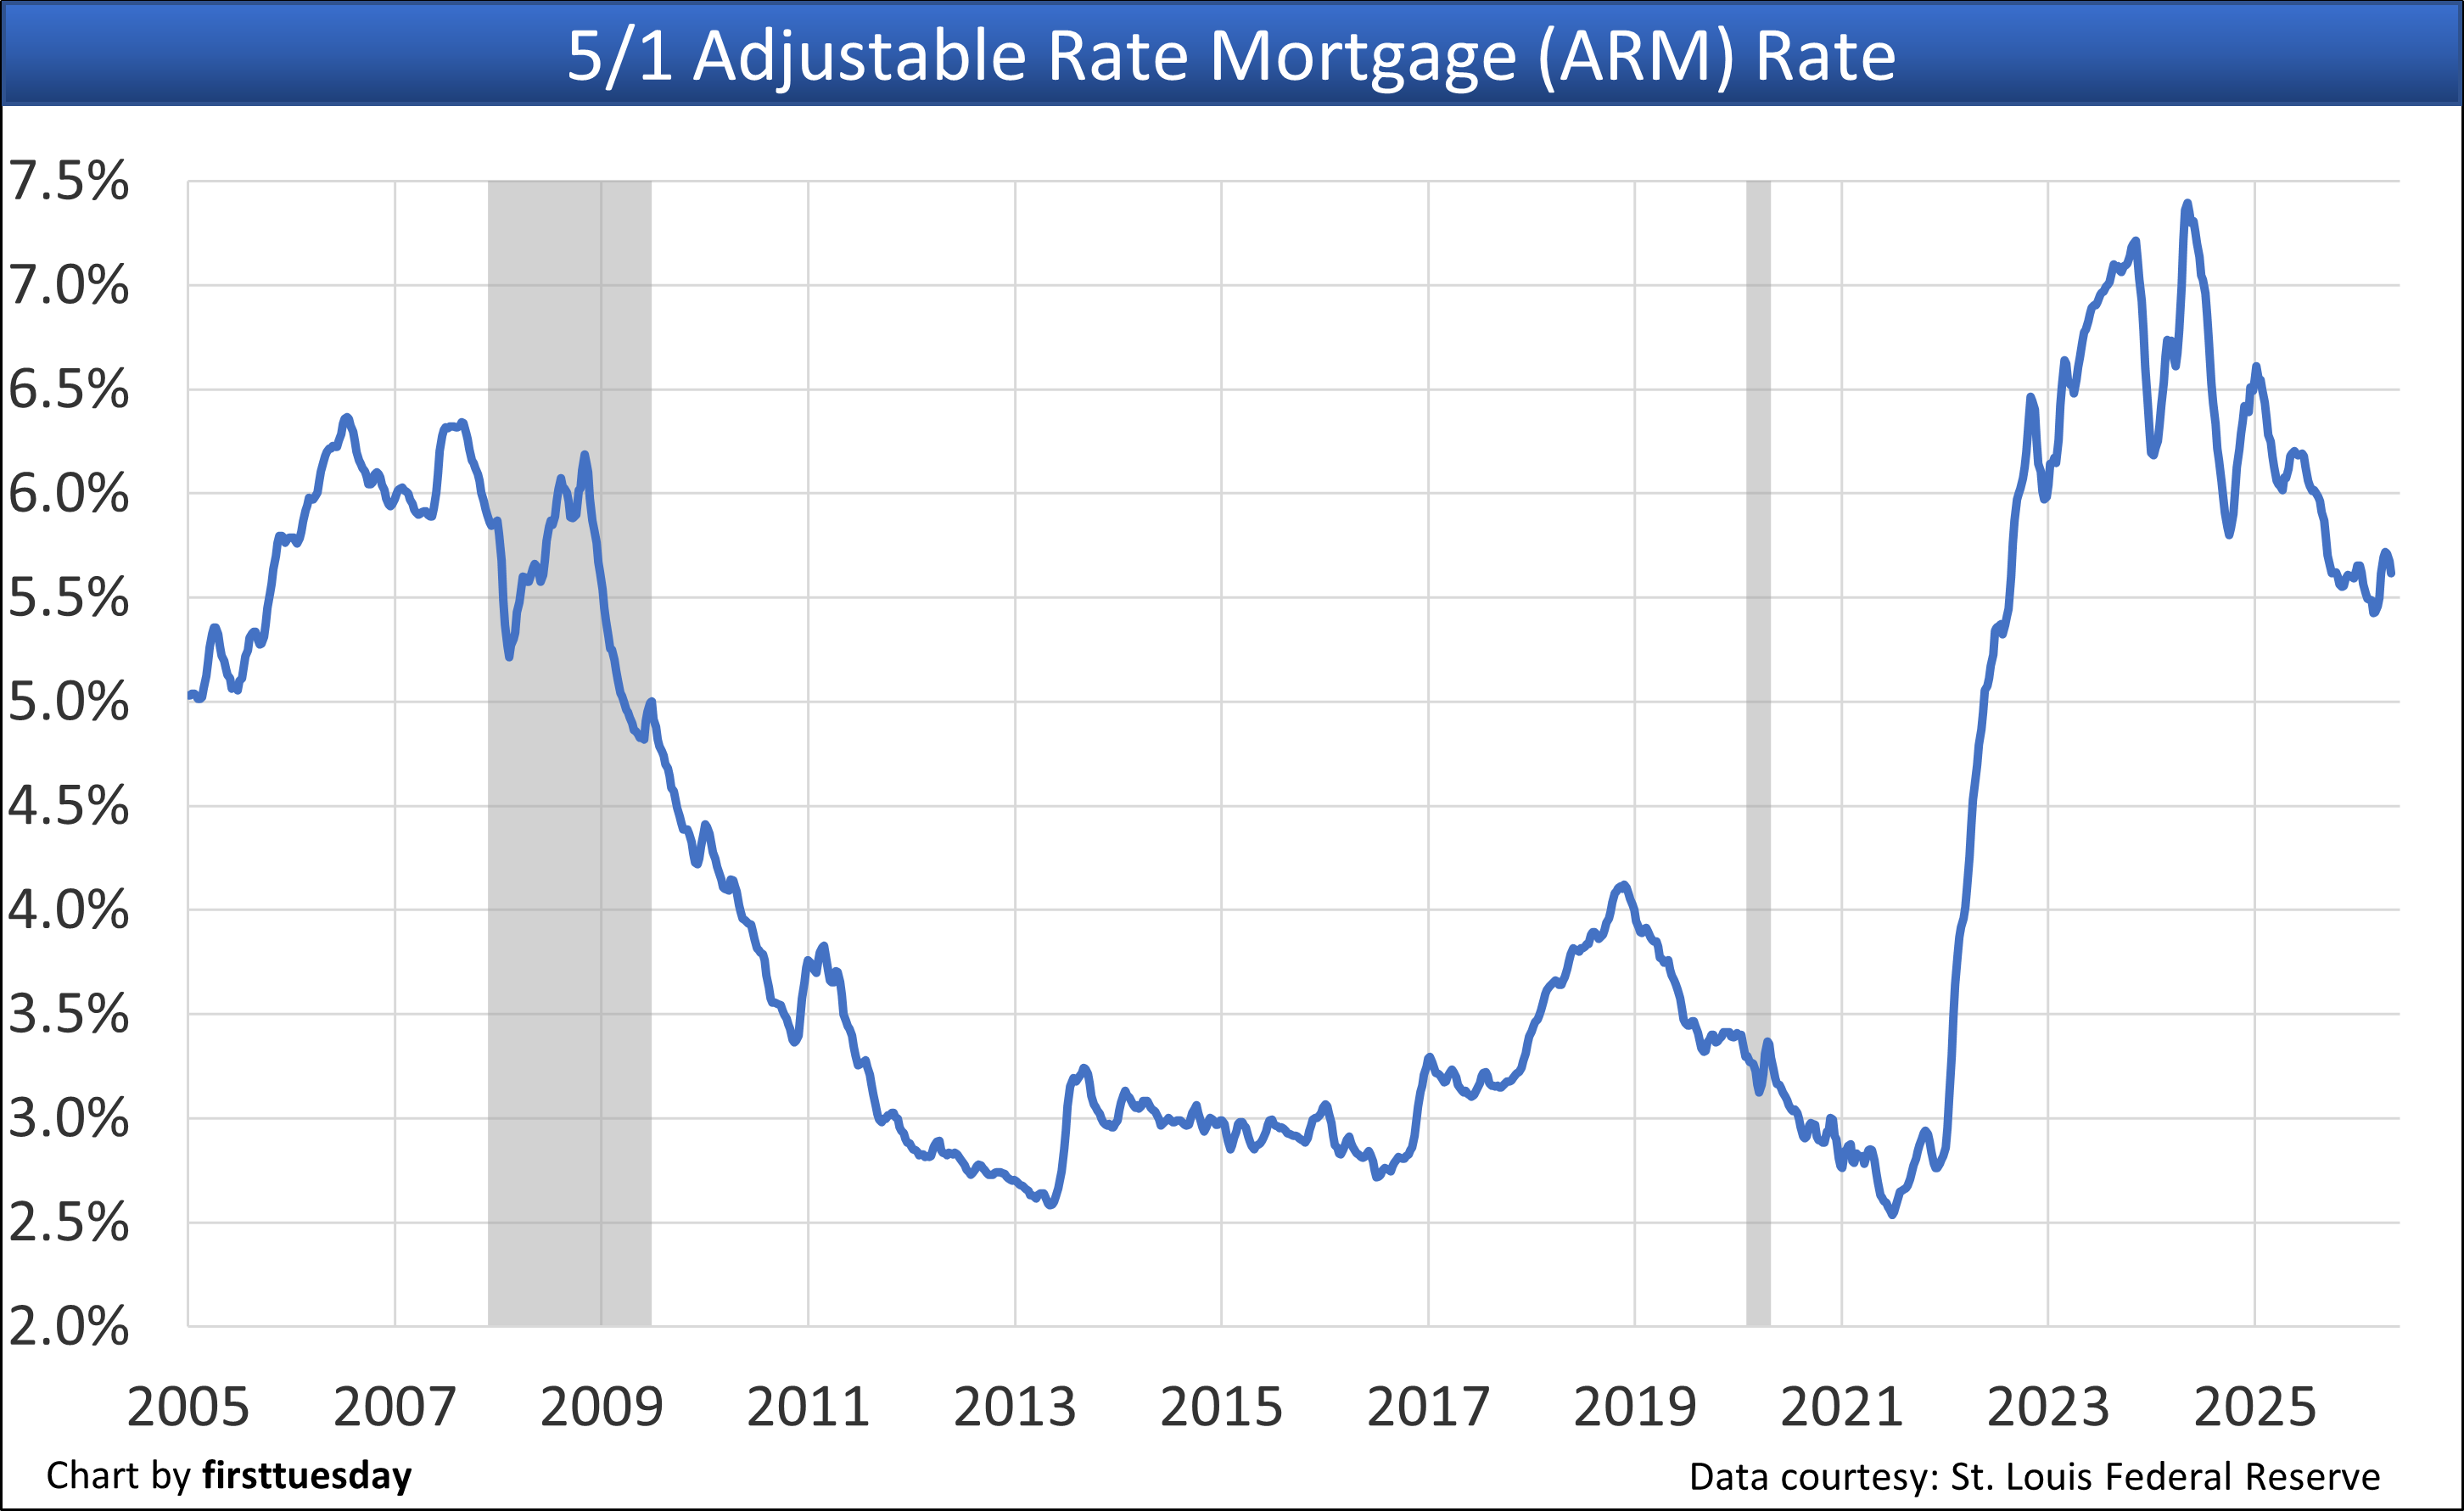
The average monthly rate on adjustable rate mortgages (ARMs) jumped to 5.68% on May 8, 2026.
The interest rate on the ARM is above the 15-year FRM and 69 percentage points lower than the 30-year FRM rate. A positive 30-year ARM-to-FRM spread gives a homebuyer or owner a bump in the amount they can borrow by taking out an ARM.
The downside in this reach for more funding is the significant forward risks of loss-by-foreclosure inherent in ARMs when rates trend higher or an employment recession sets in. Unchanged, an ARM is the mortgage available to finance high-tier housing and commercial property.
The following was updated May 8, 2026.
Click the link to go directly to a chart, or browse the charts by scrolling below.
1. 30-year fixed rate mortgage (FRM) rate, weekly— Chart update 5/8/2026
2. 30-year FRM rate, monthly — Chart update 5/1/2026
3. 15-year FRM rate — Chart update 5/8/2026
4. 5/1 adjustable rate mortgage (ARM) rate, monthly — Chart update 5/1/2026
5. 10-year Treasury note rate — Chart update 5/8/2026
6. Combined FRM and 10-year Treasury note rates — Chart update 5/1/2026
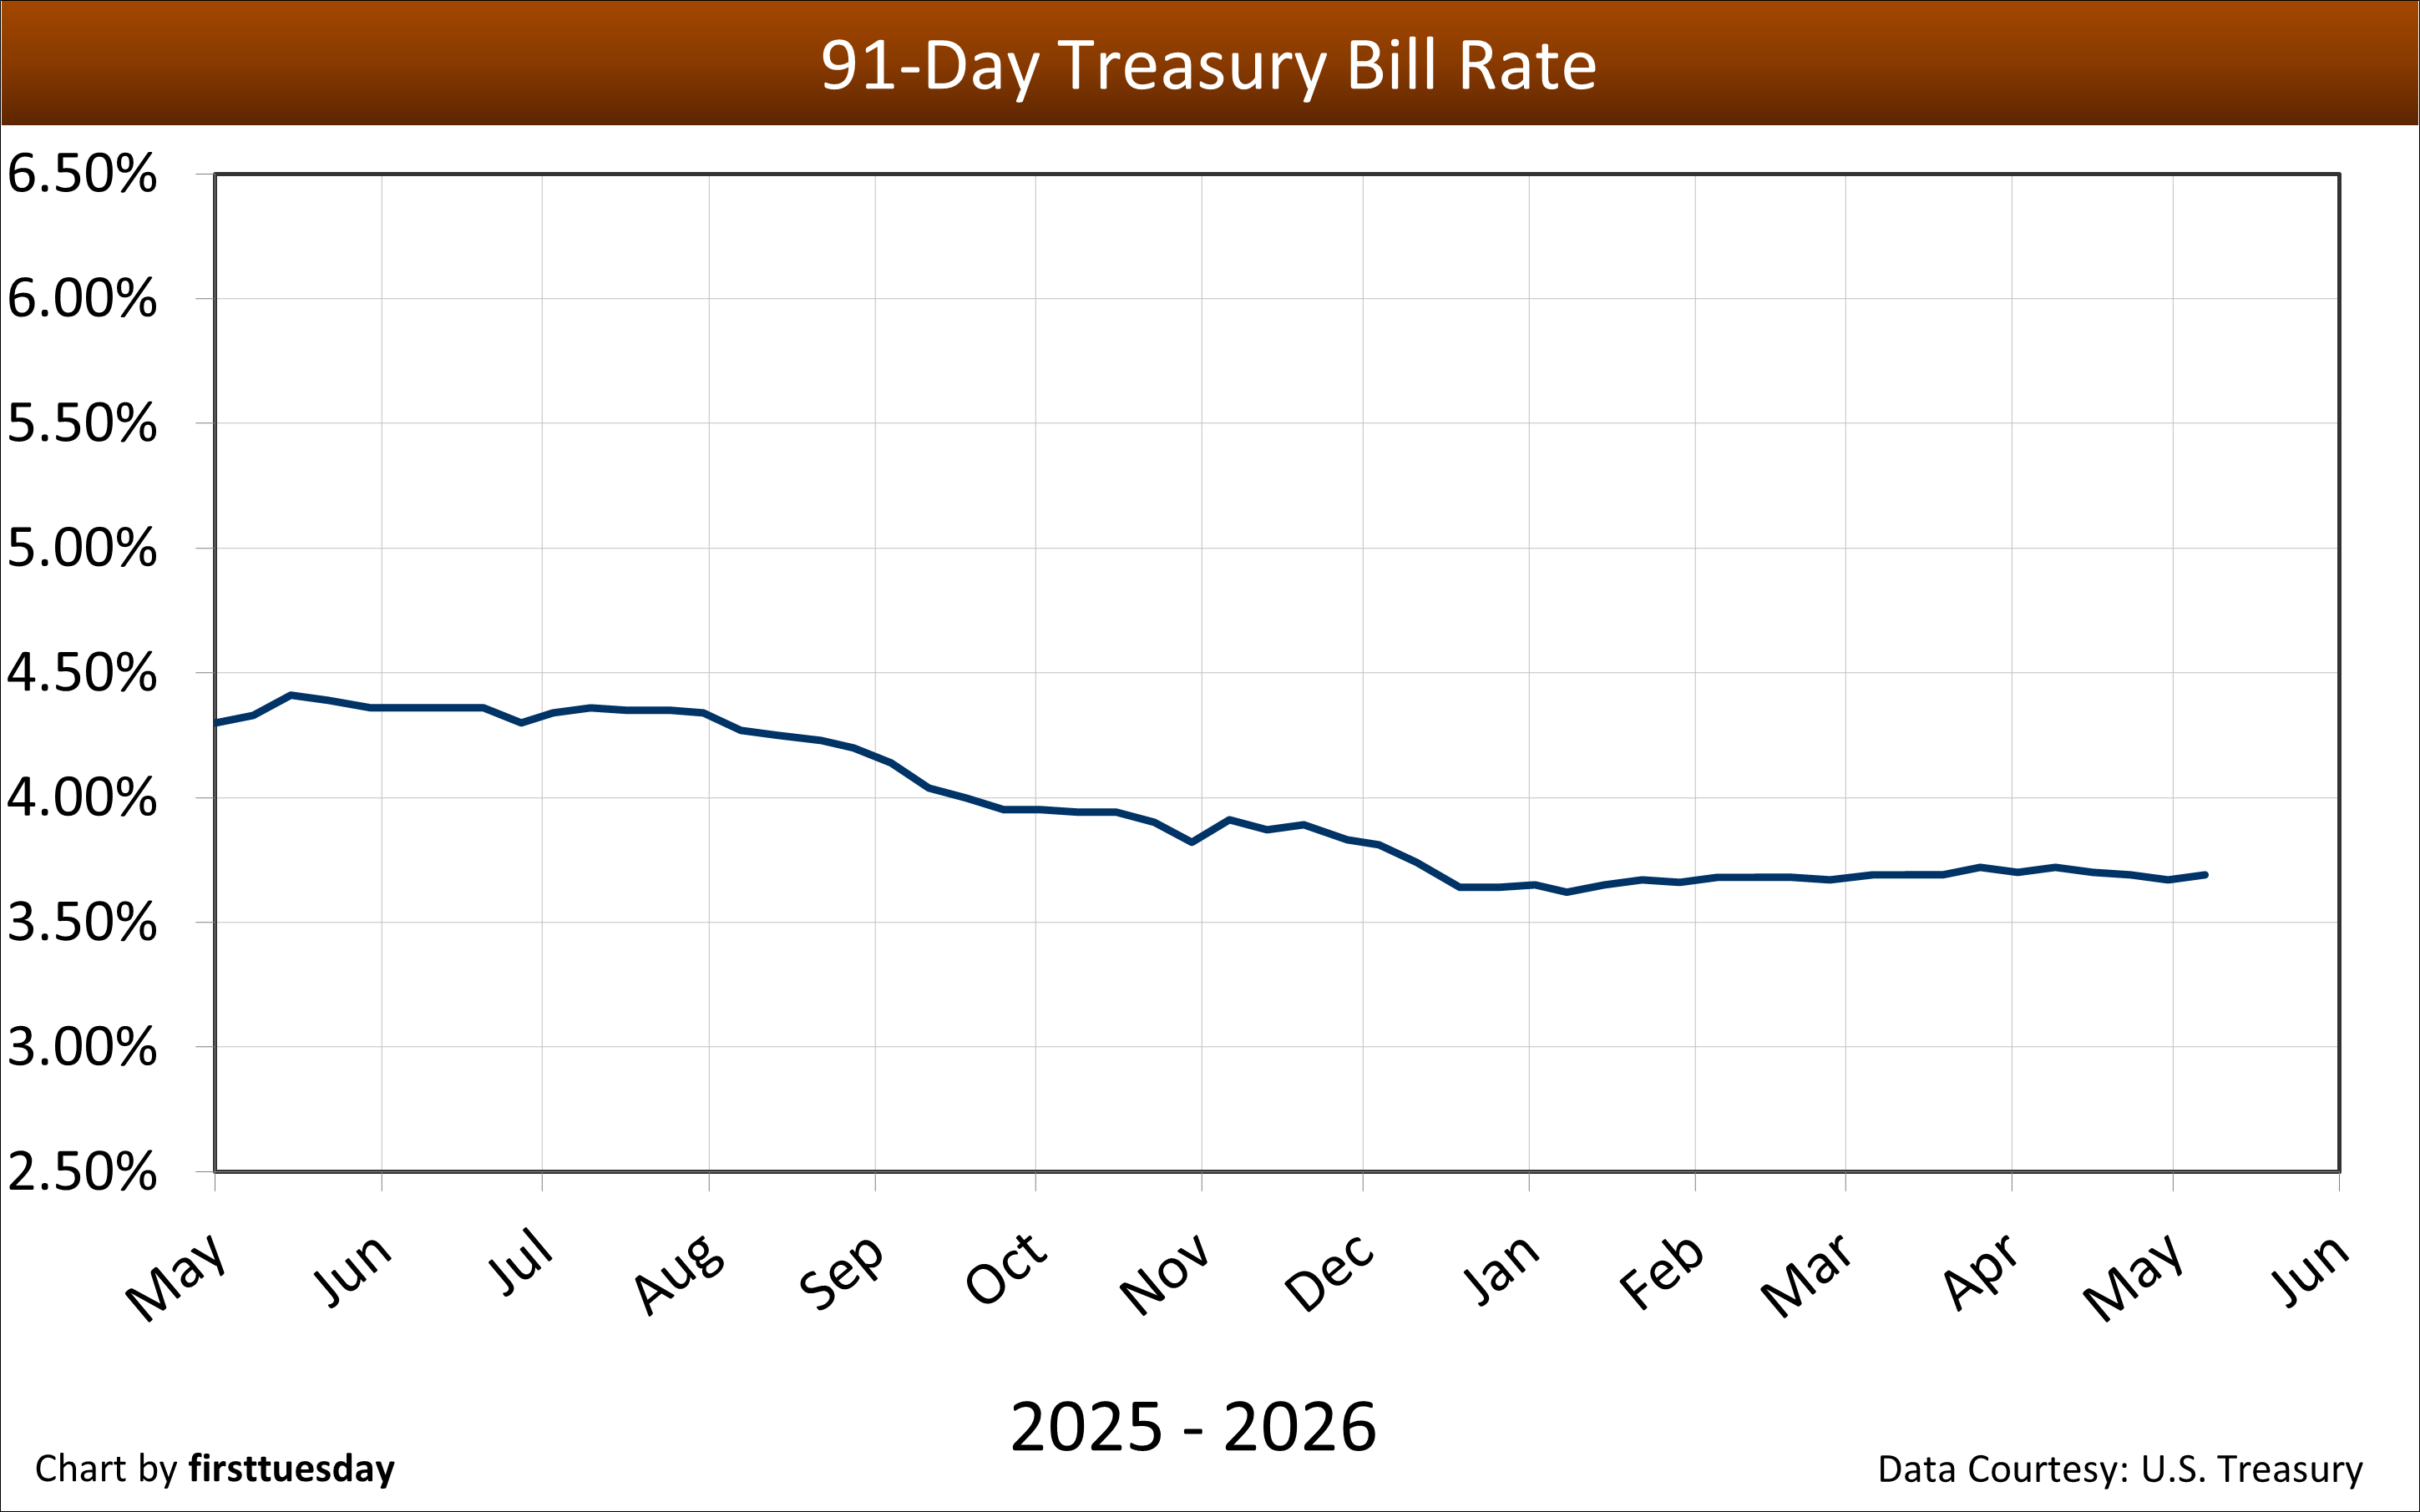
7. 91-day Treasury bill rate — Chart update 5/8/2026
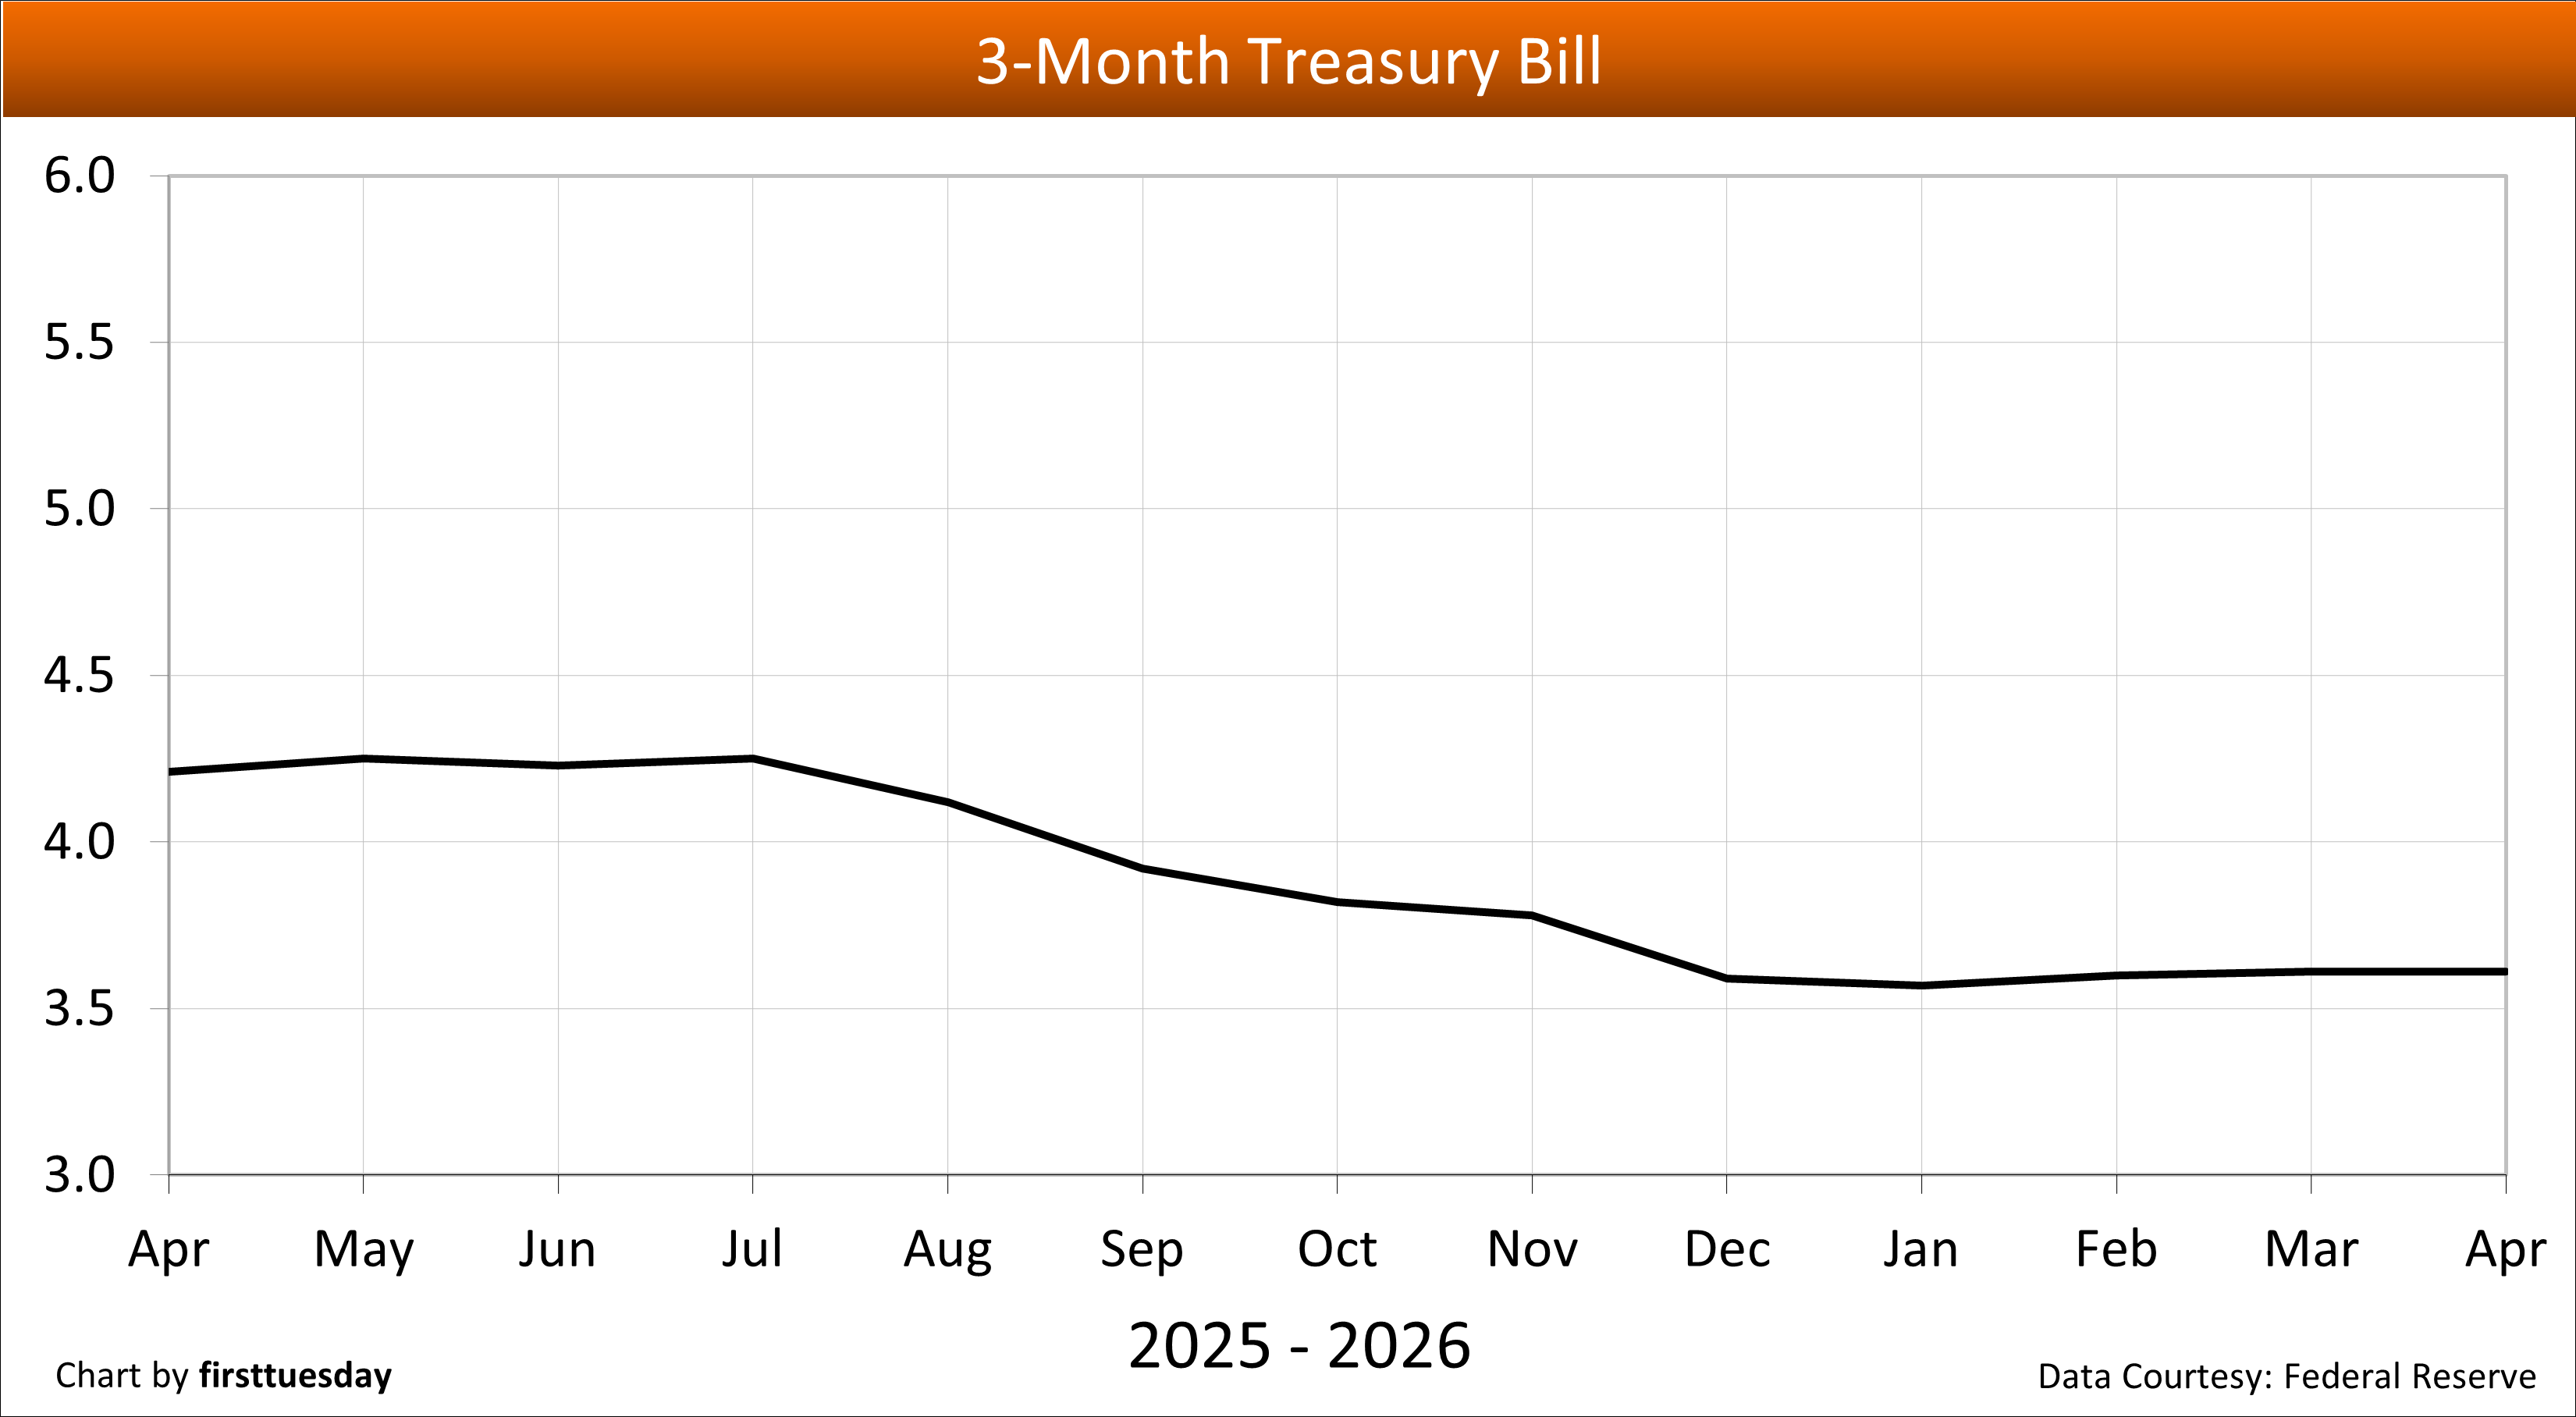
8. 3-month Treasury bill — Chart update 5/8/2026
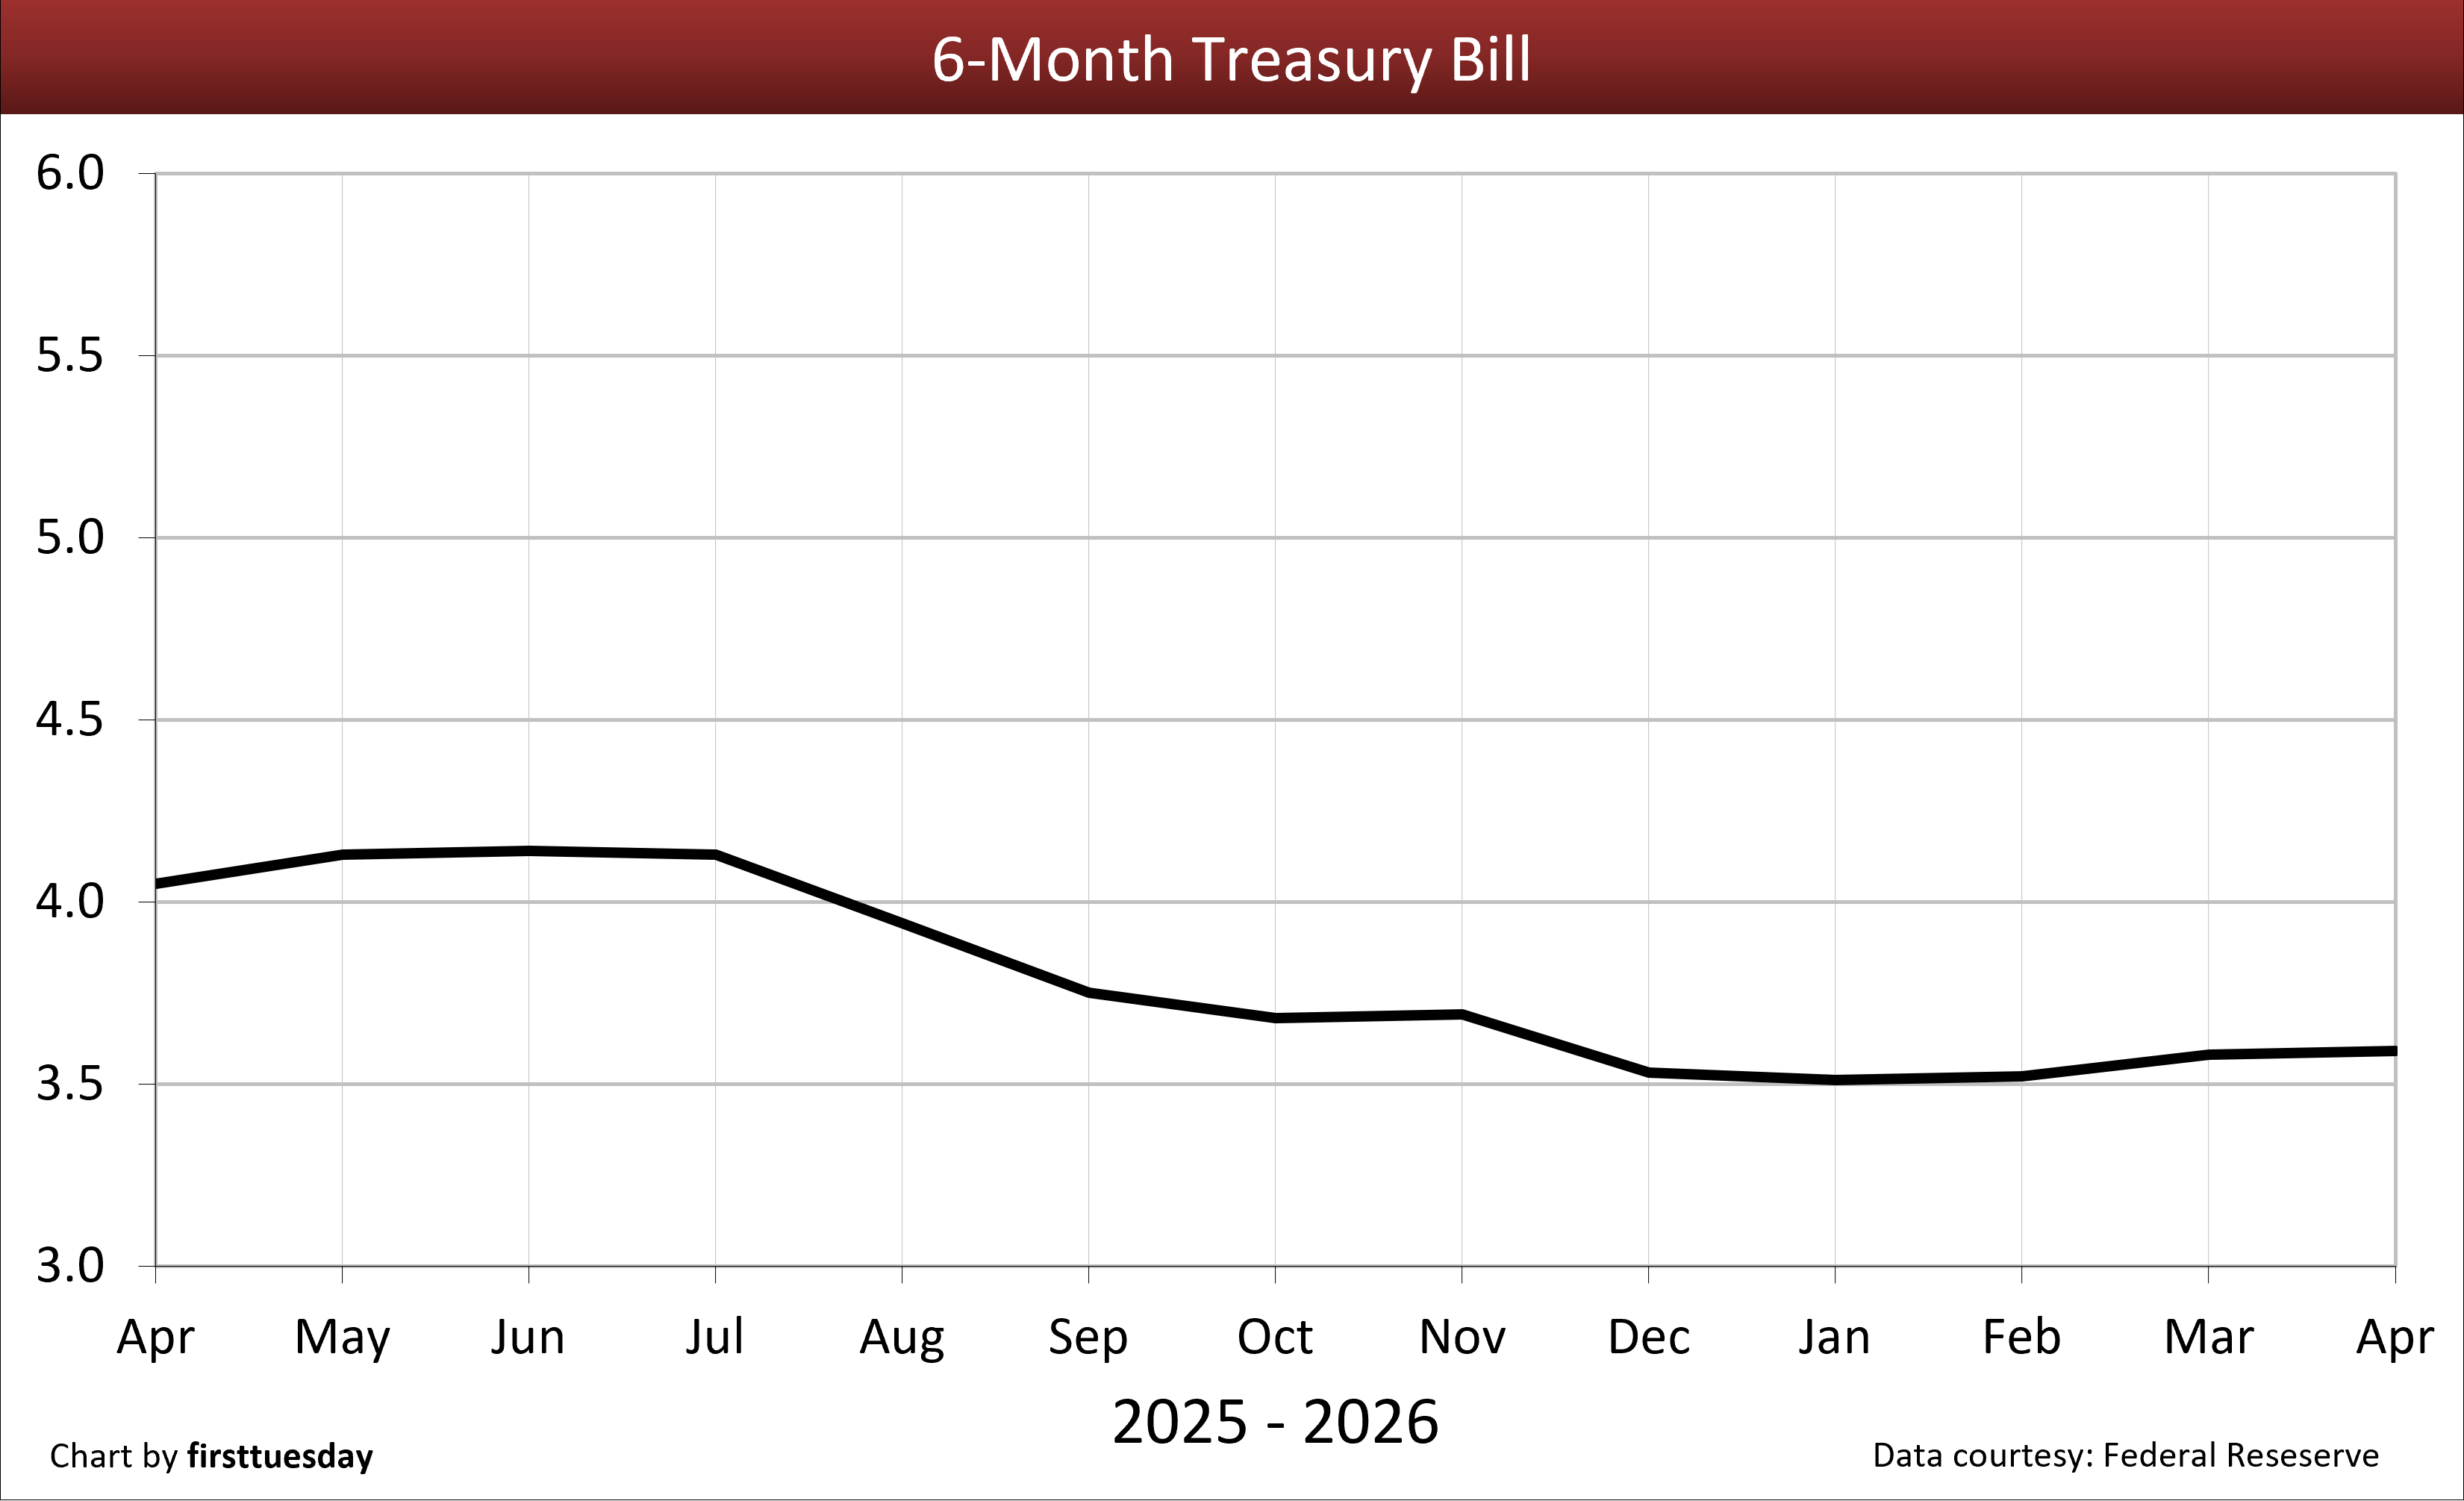
9. 6-month Treasury bill — Chart update 5/8/2026
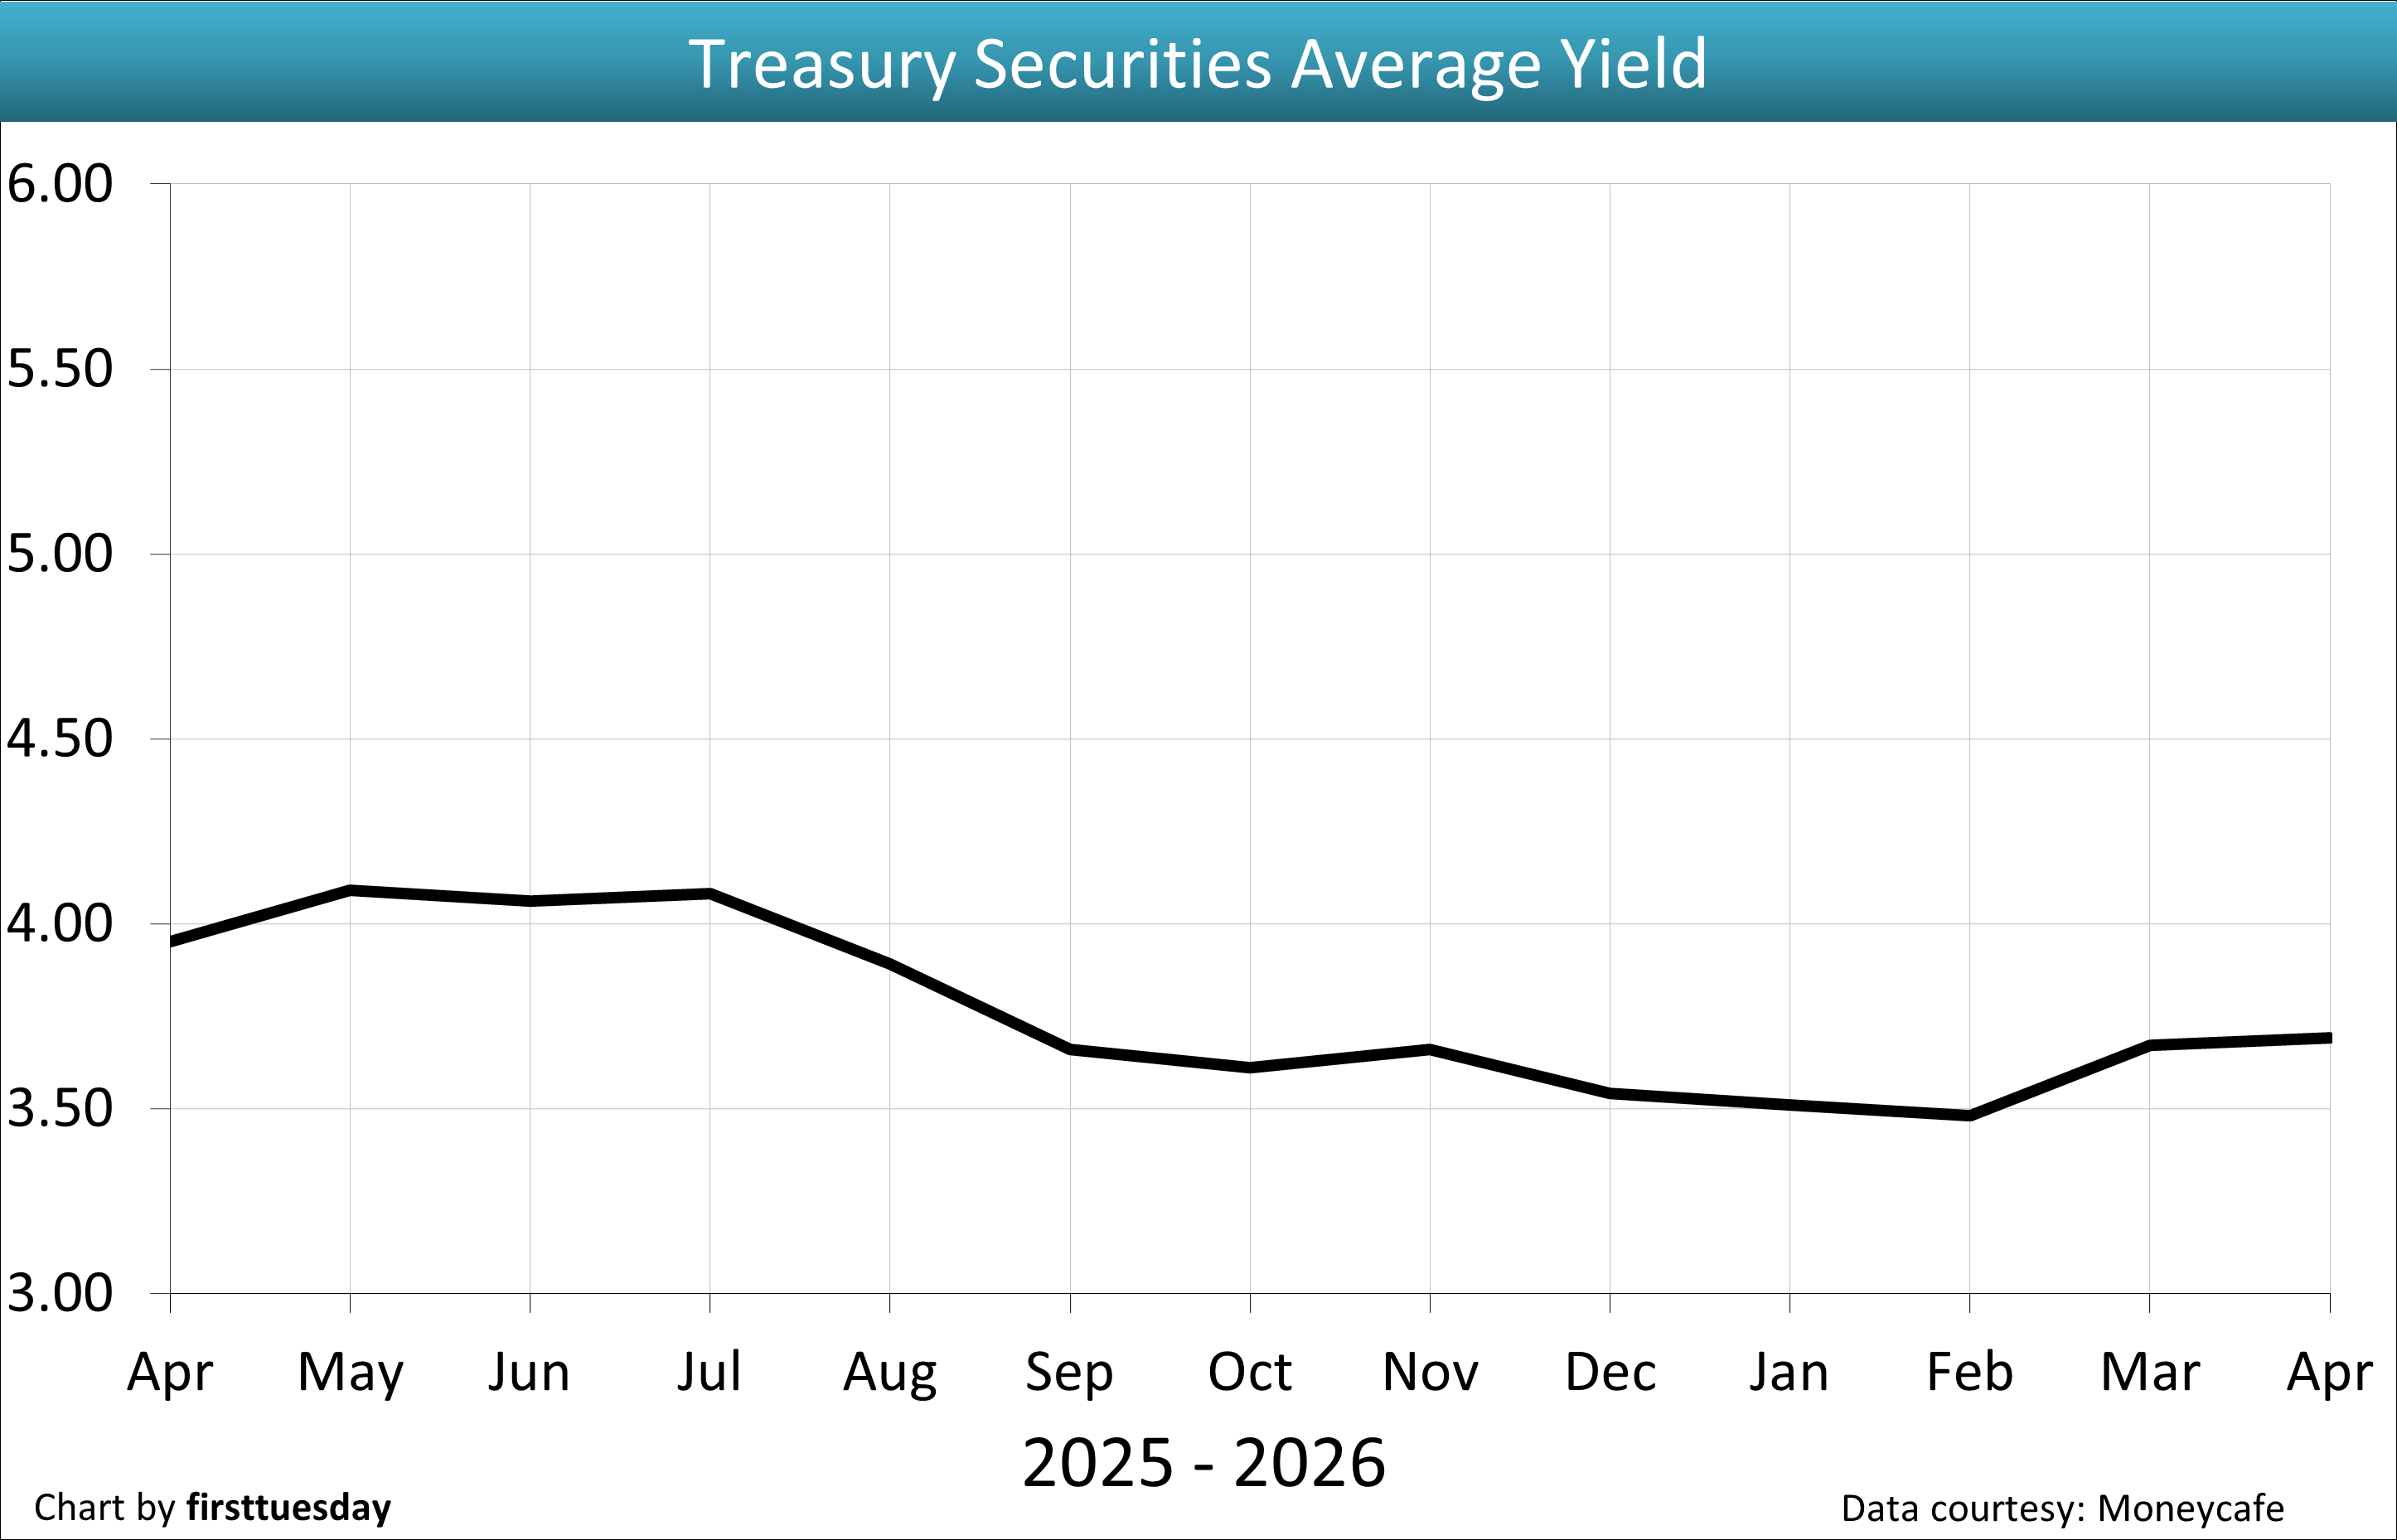
10. Treasury Securities average yield (CMT) — Chart update 5/8/2026
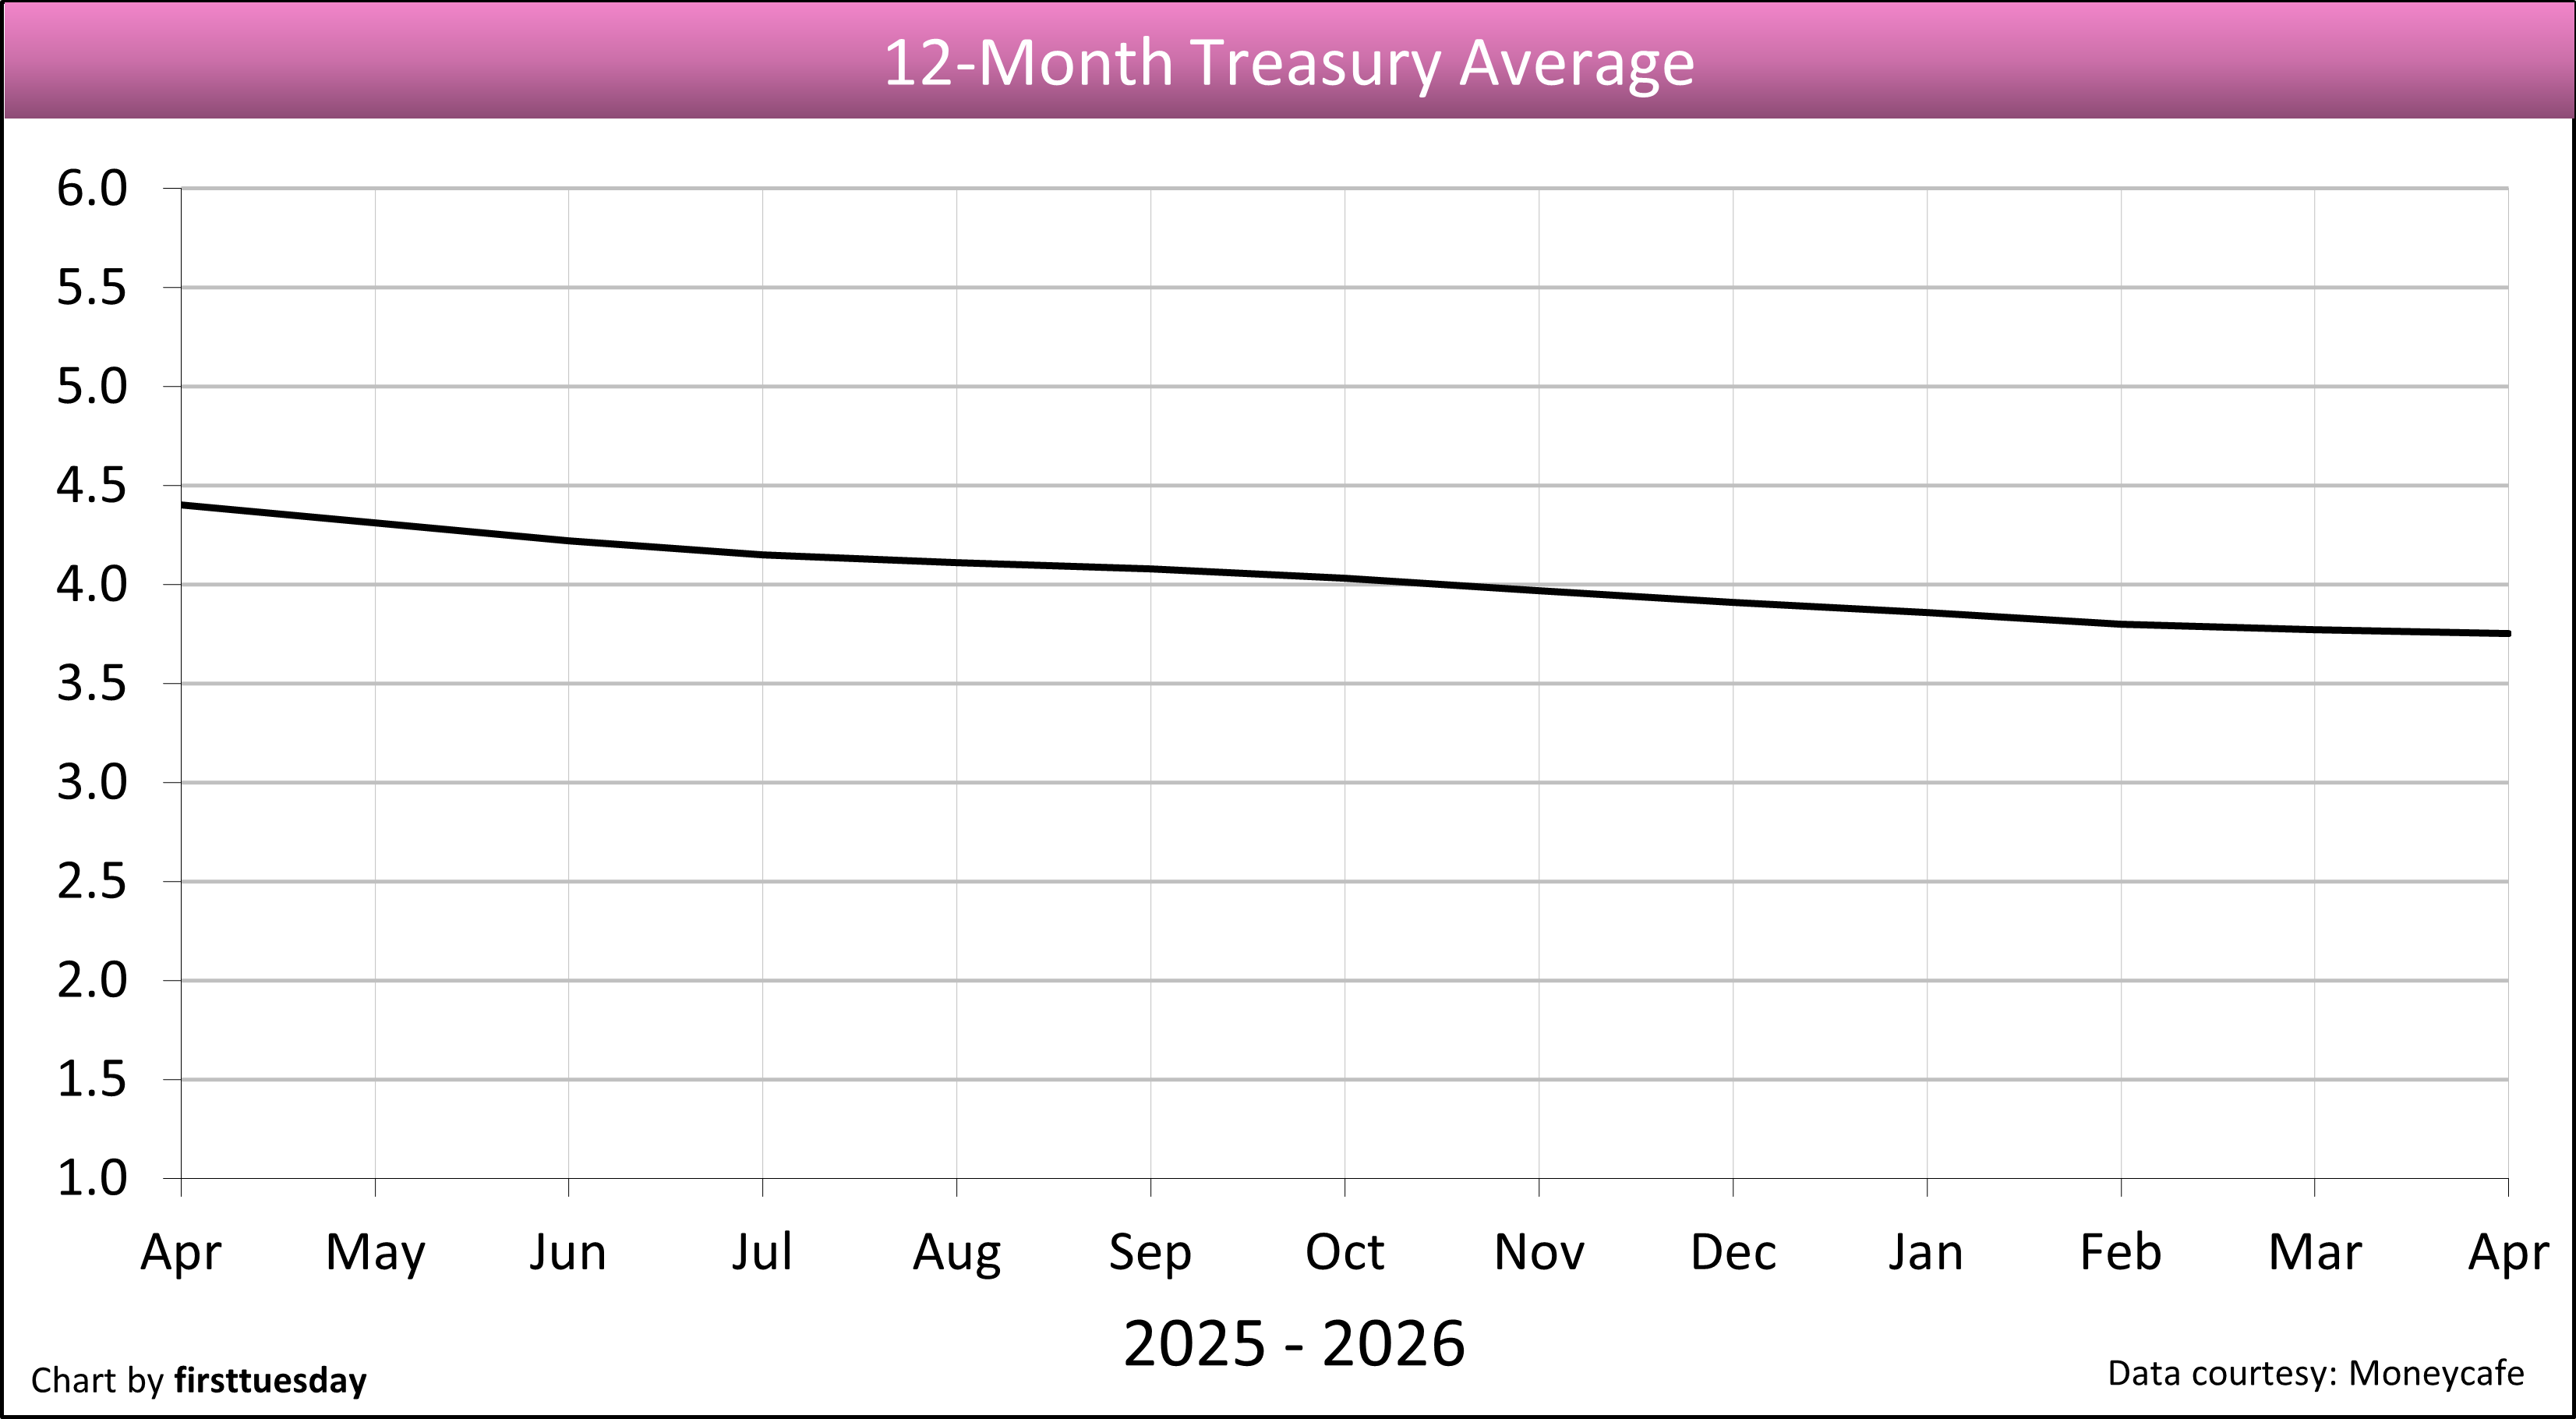
11. 12-month Treasury average — Chart update 5/8/2026
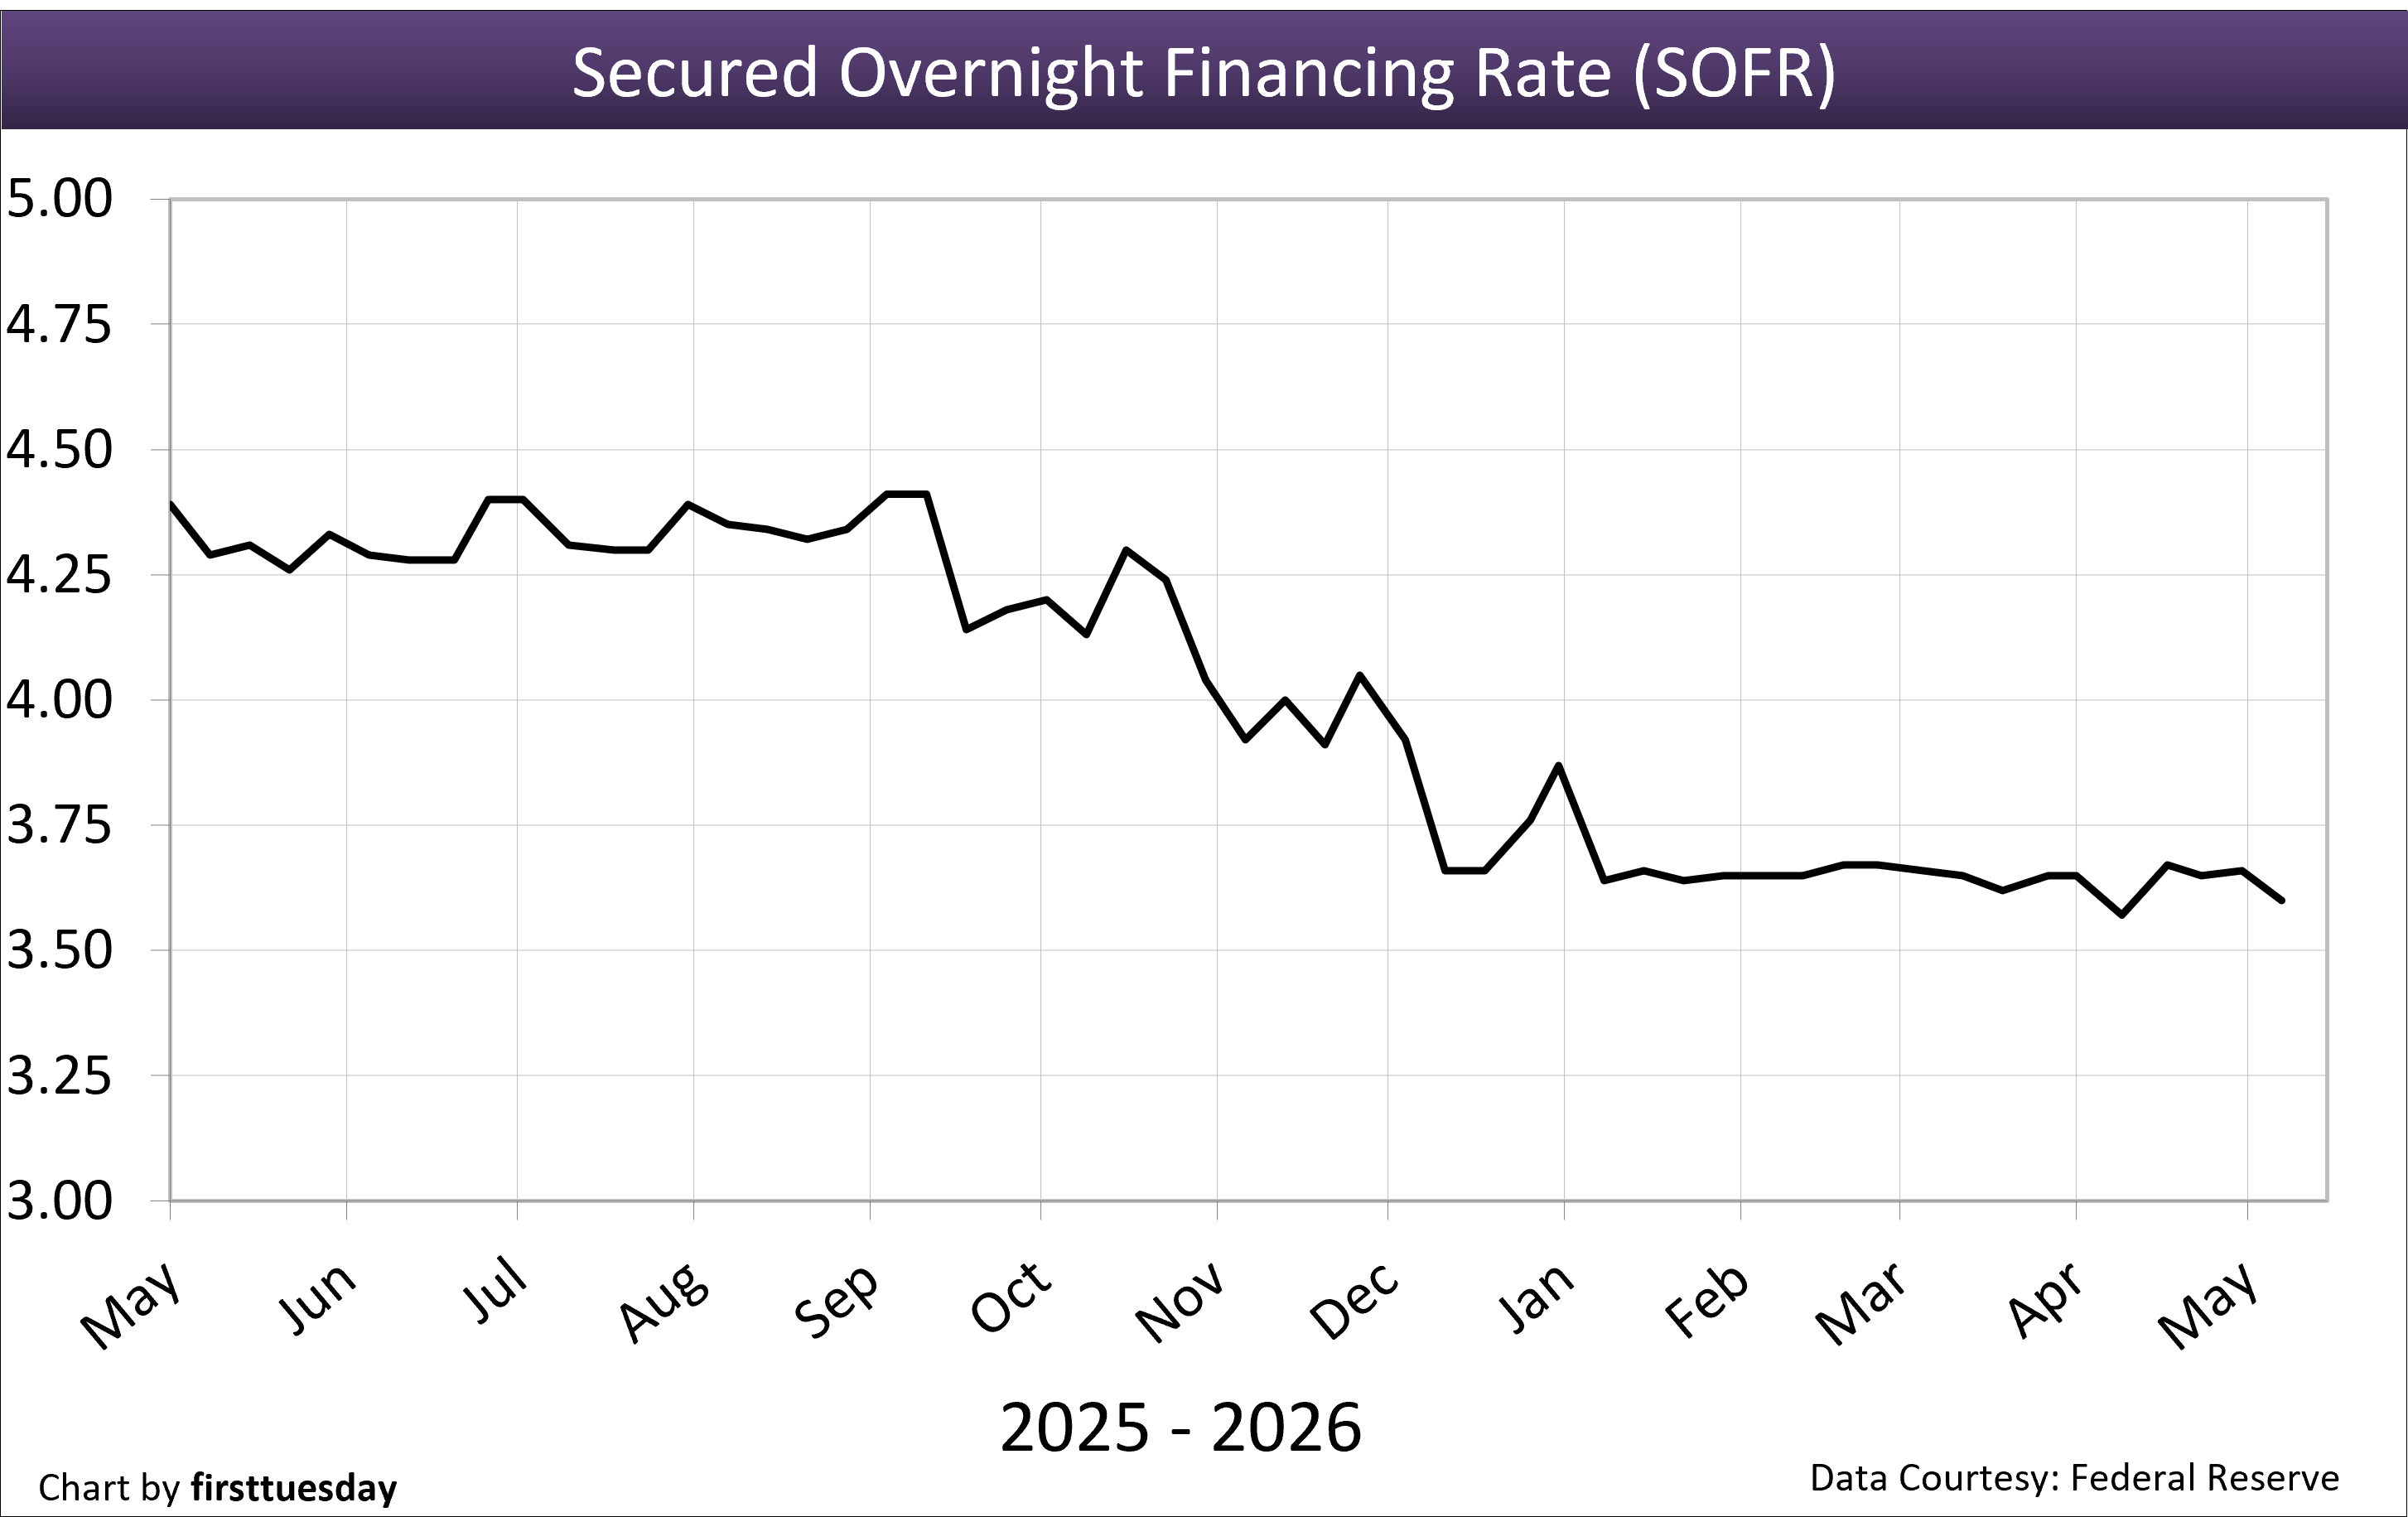
12. Secured Overnight Financing Rate (SOFR) — Chart update 5/8/2026
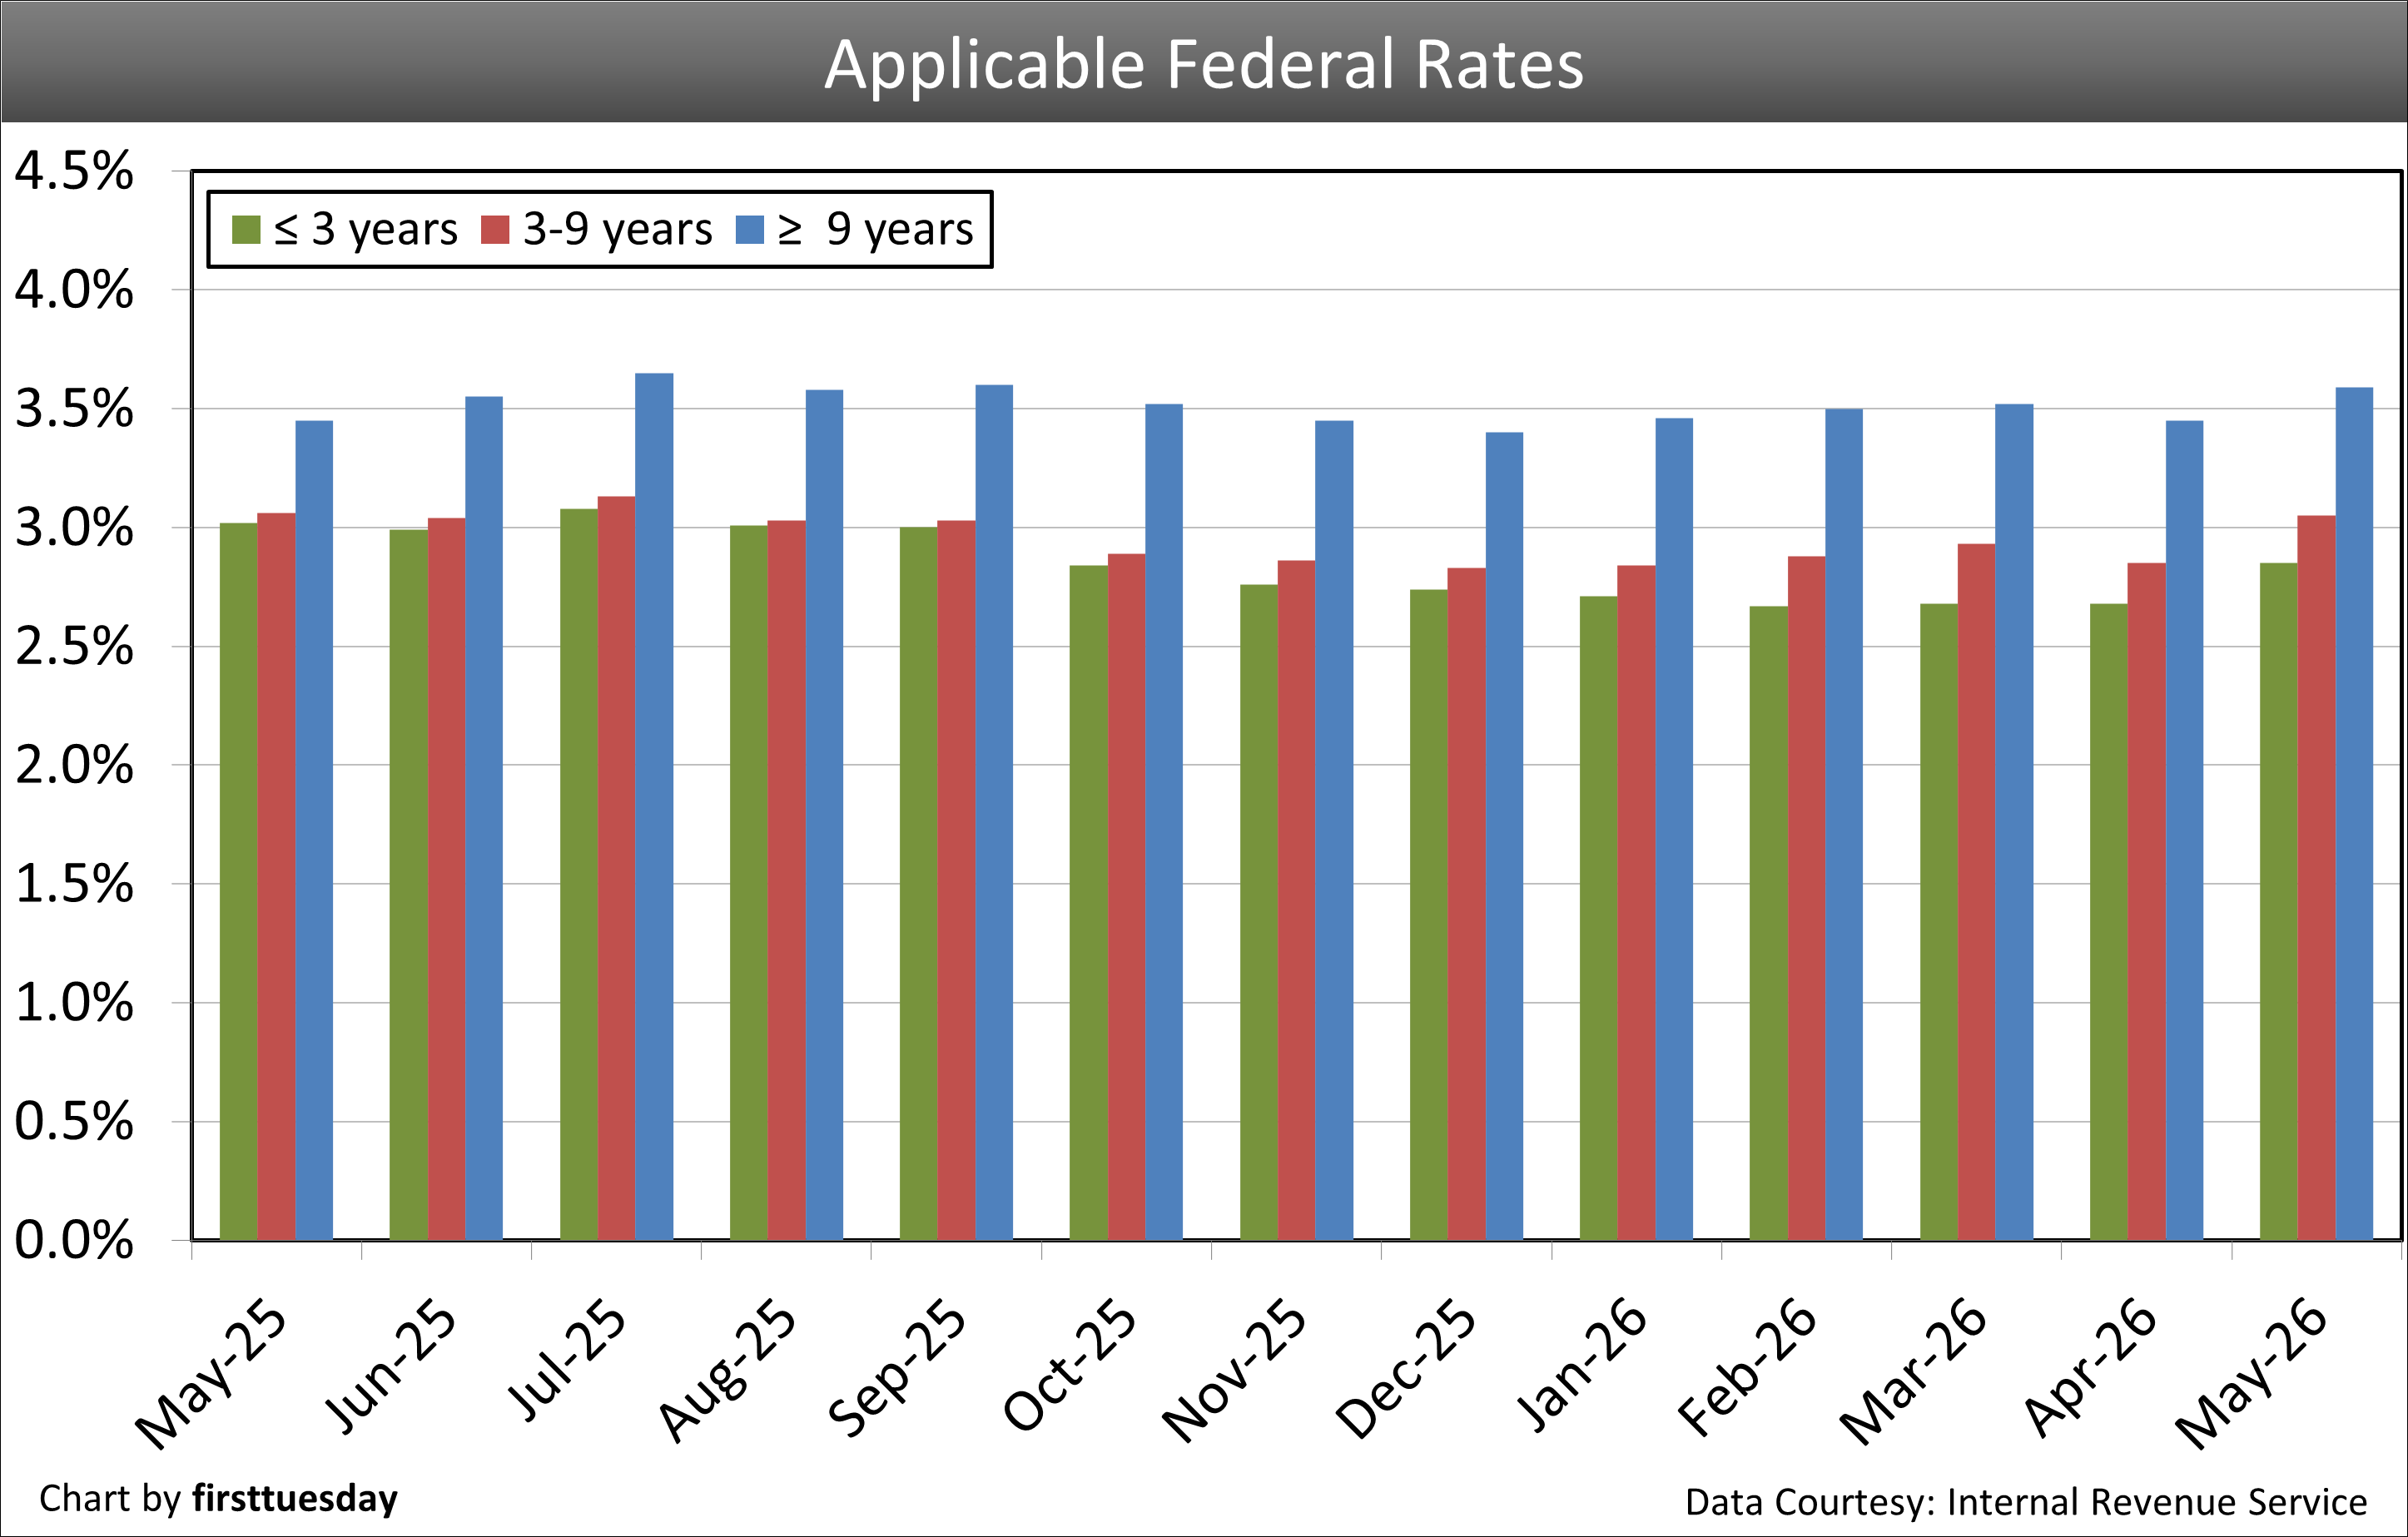
13. Applicable federal rates — Chart update 5/8/2026
 | ||
| Chart update 5/8/26 | ||
Current | Month ago 4/9/26 6.37% | Year ago 5/8/25 6.76% |
The average 30-year FRM rate in California is provided by the St. Louis Federal Reserve Bank.
| ||
 | ||
| Chart update 5/1/26 | ||
April 2026 Average 6.34% | March 2026 Average 6.18% | April 2025 Average 6.73% |
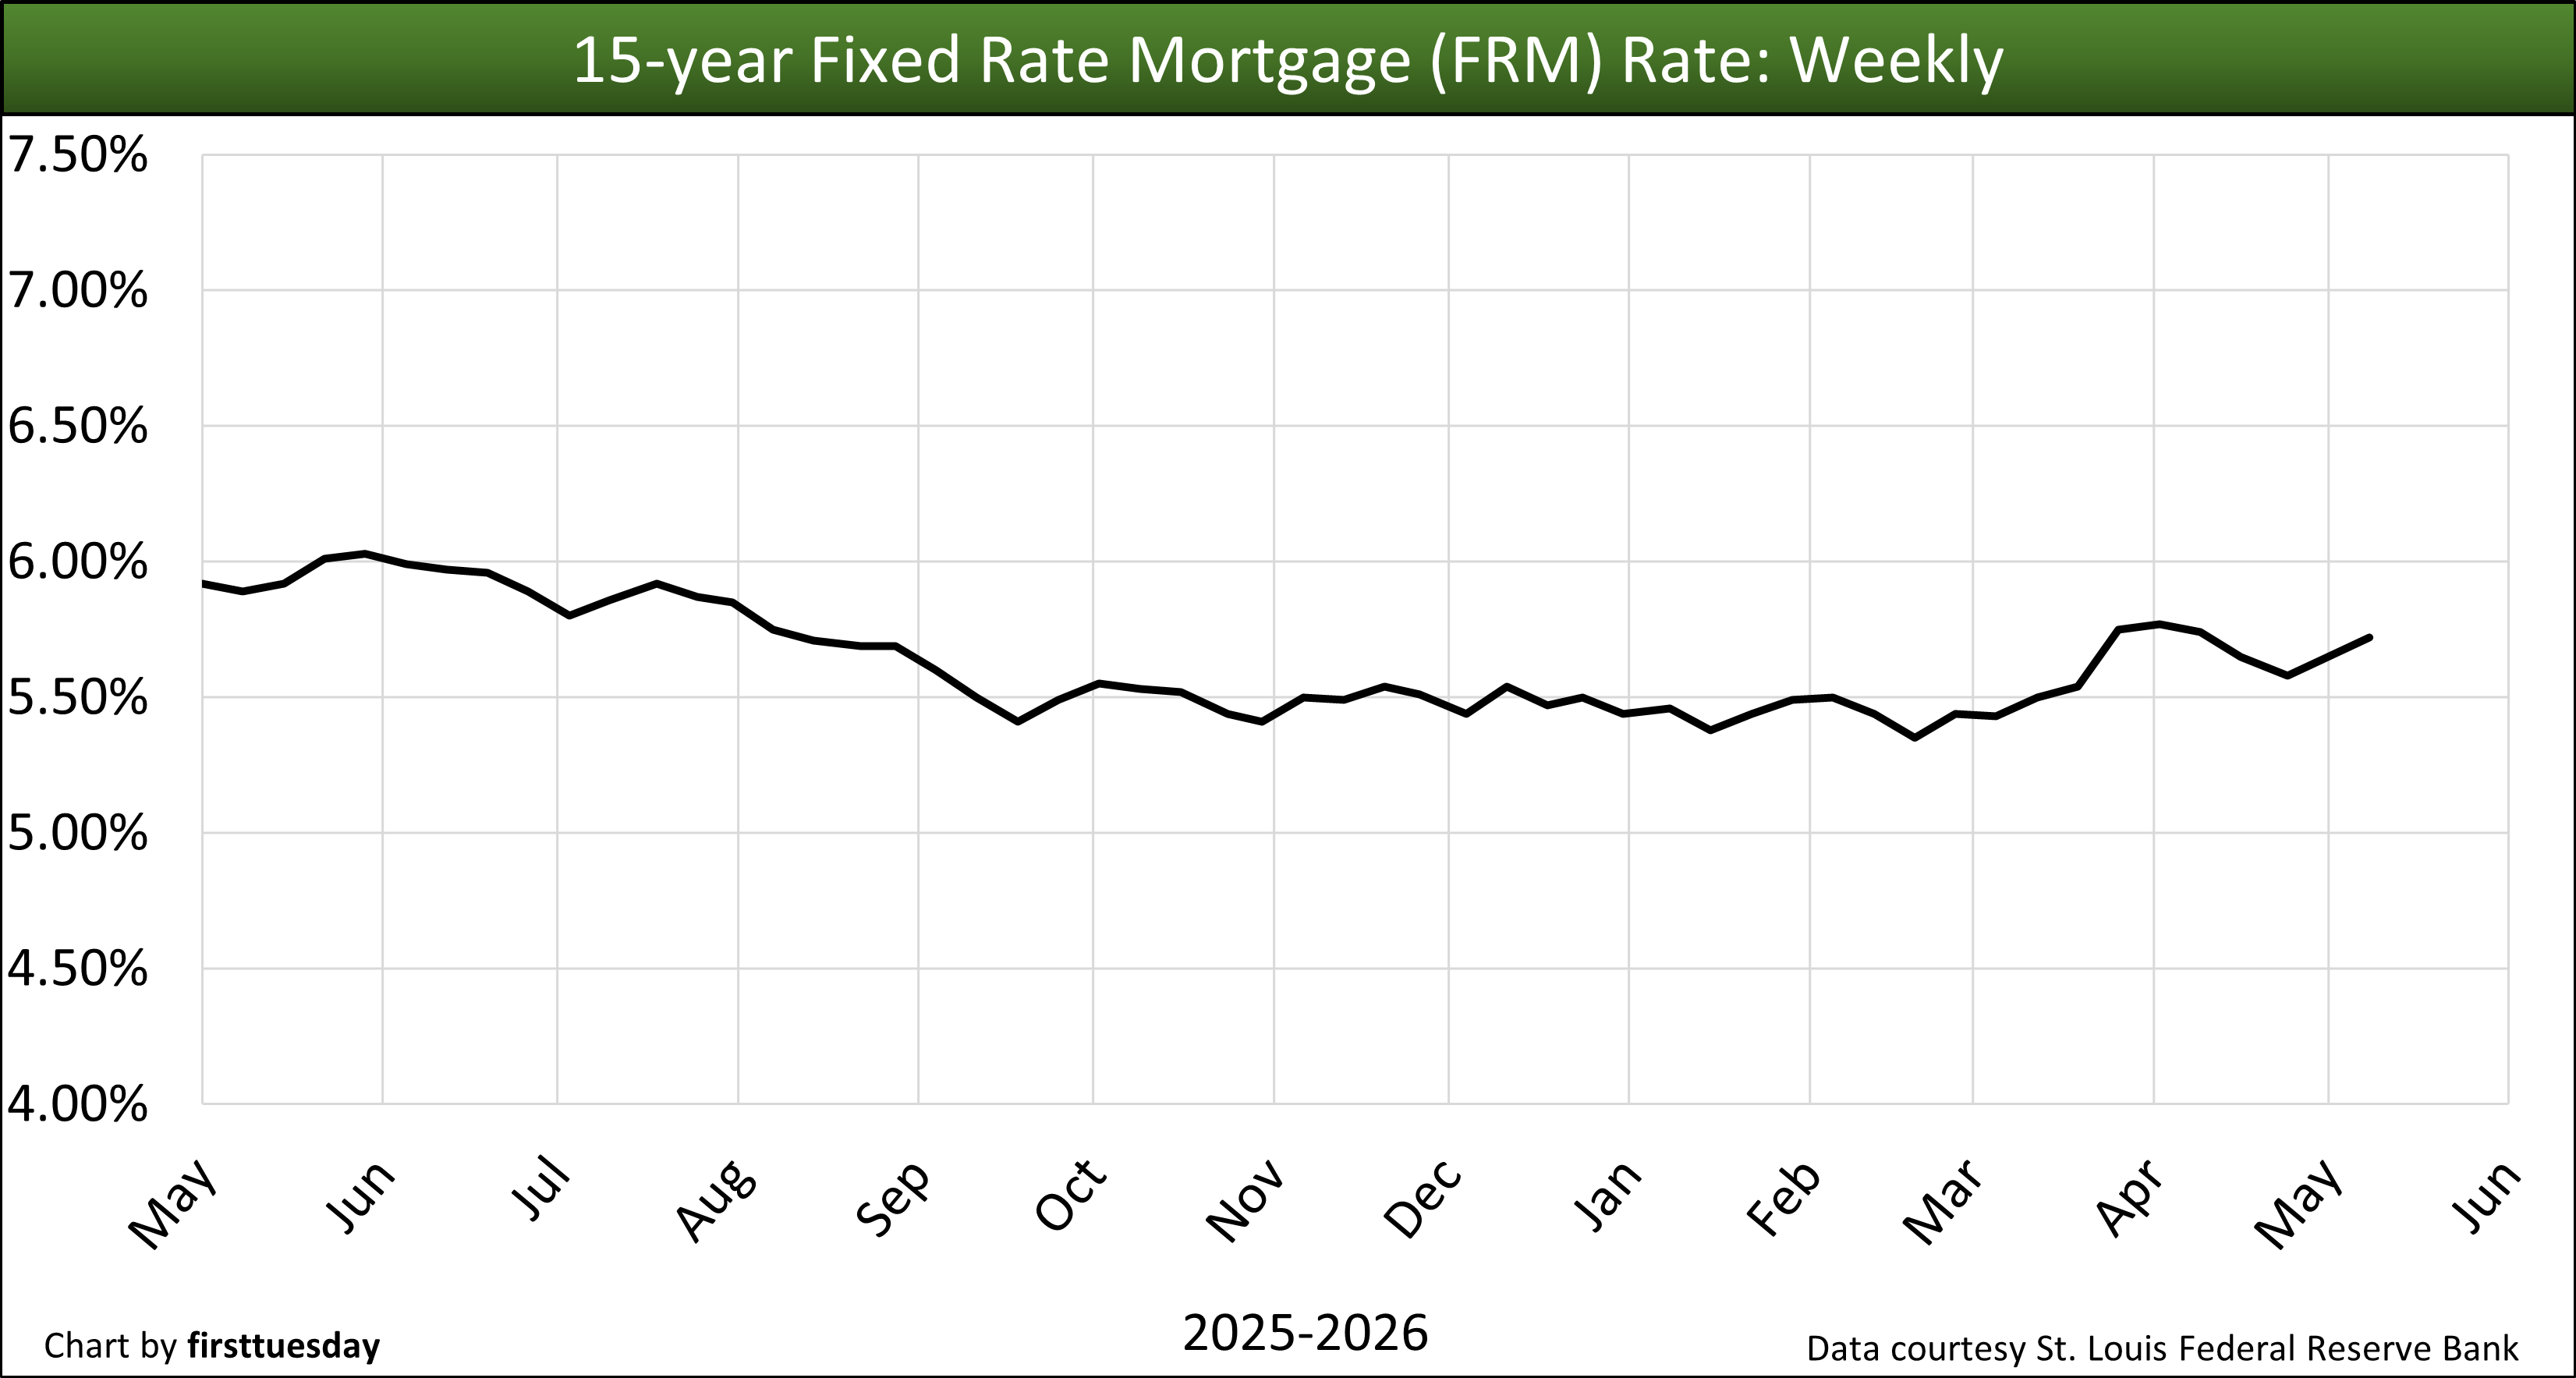 | ||
| Chart update 5/8/26 | ||
Current 5/7/26 5.72% | Month ago 4/9/26 5.74% | Year ago 5/8/25 5.89% |
The average 15-year FRM rate in California is provided by the St. Louis Federal Reserve Bank.
| ||
 | ||
| Chart update 5/1/26 | ||
April 2026 5.68% | March 2026 5.62% | April 2025 6.07% |
The 5/1 average adjustable rate mortgage (ARM) rate shows the average rate for the first five years after origination. After the initial five-year period, the ARM rate is adjusted annually based on an index figure, such as a certain Treasury Bill rate (which reflects Federal Reserve rate movements) or the Secure Overnight Financing Rate (SOFR). The average ARM rate is provided by Freddie Mac’s survey of the U.S. | ||
 | ||
| Chart update 5/8/26 | ||
Current 5/8/26 4.37% | Month ago 4/10/26 4.30% | Year ago 5/9/25 4.37% |
This rate is a leading indicator of the direction of future Freddie Mac rates. The 10-year rate historically runs closer to 4% during a stable money market. The rate is influenced by worldwide demand for the dollar and anticipated future domestic inflation. | ||
 | ||
| Chart update 5/1/26 | ||
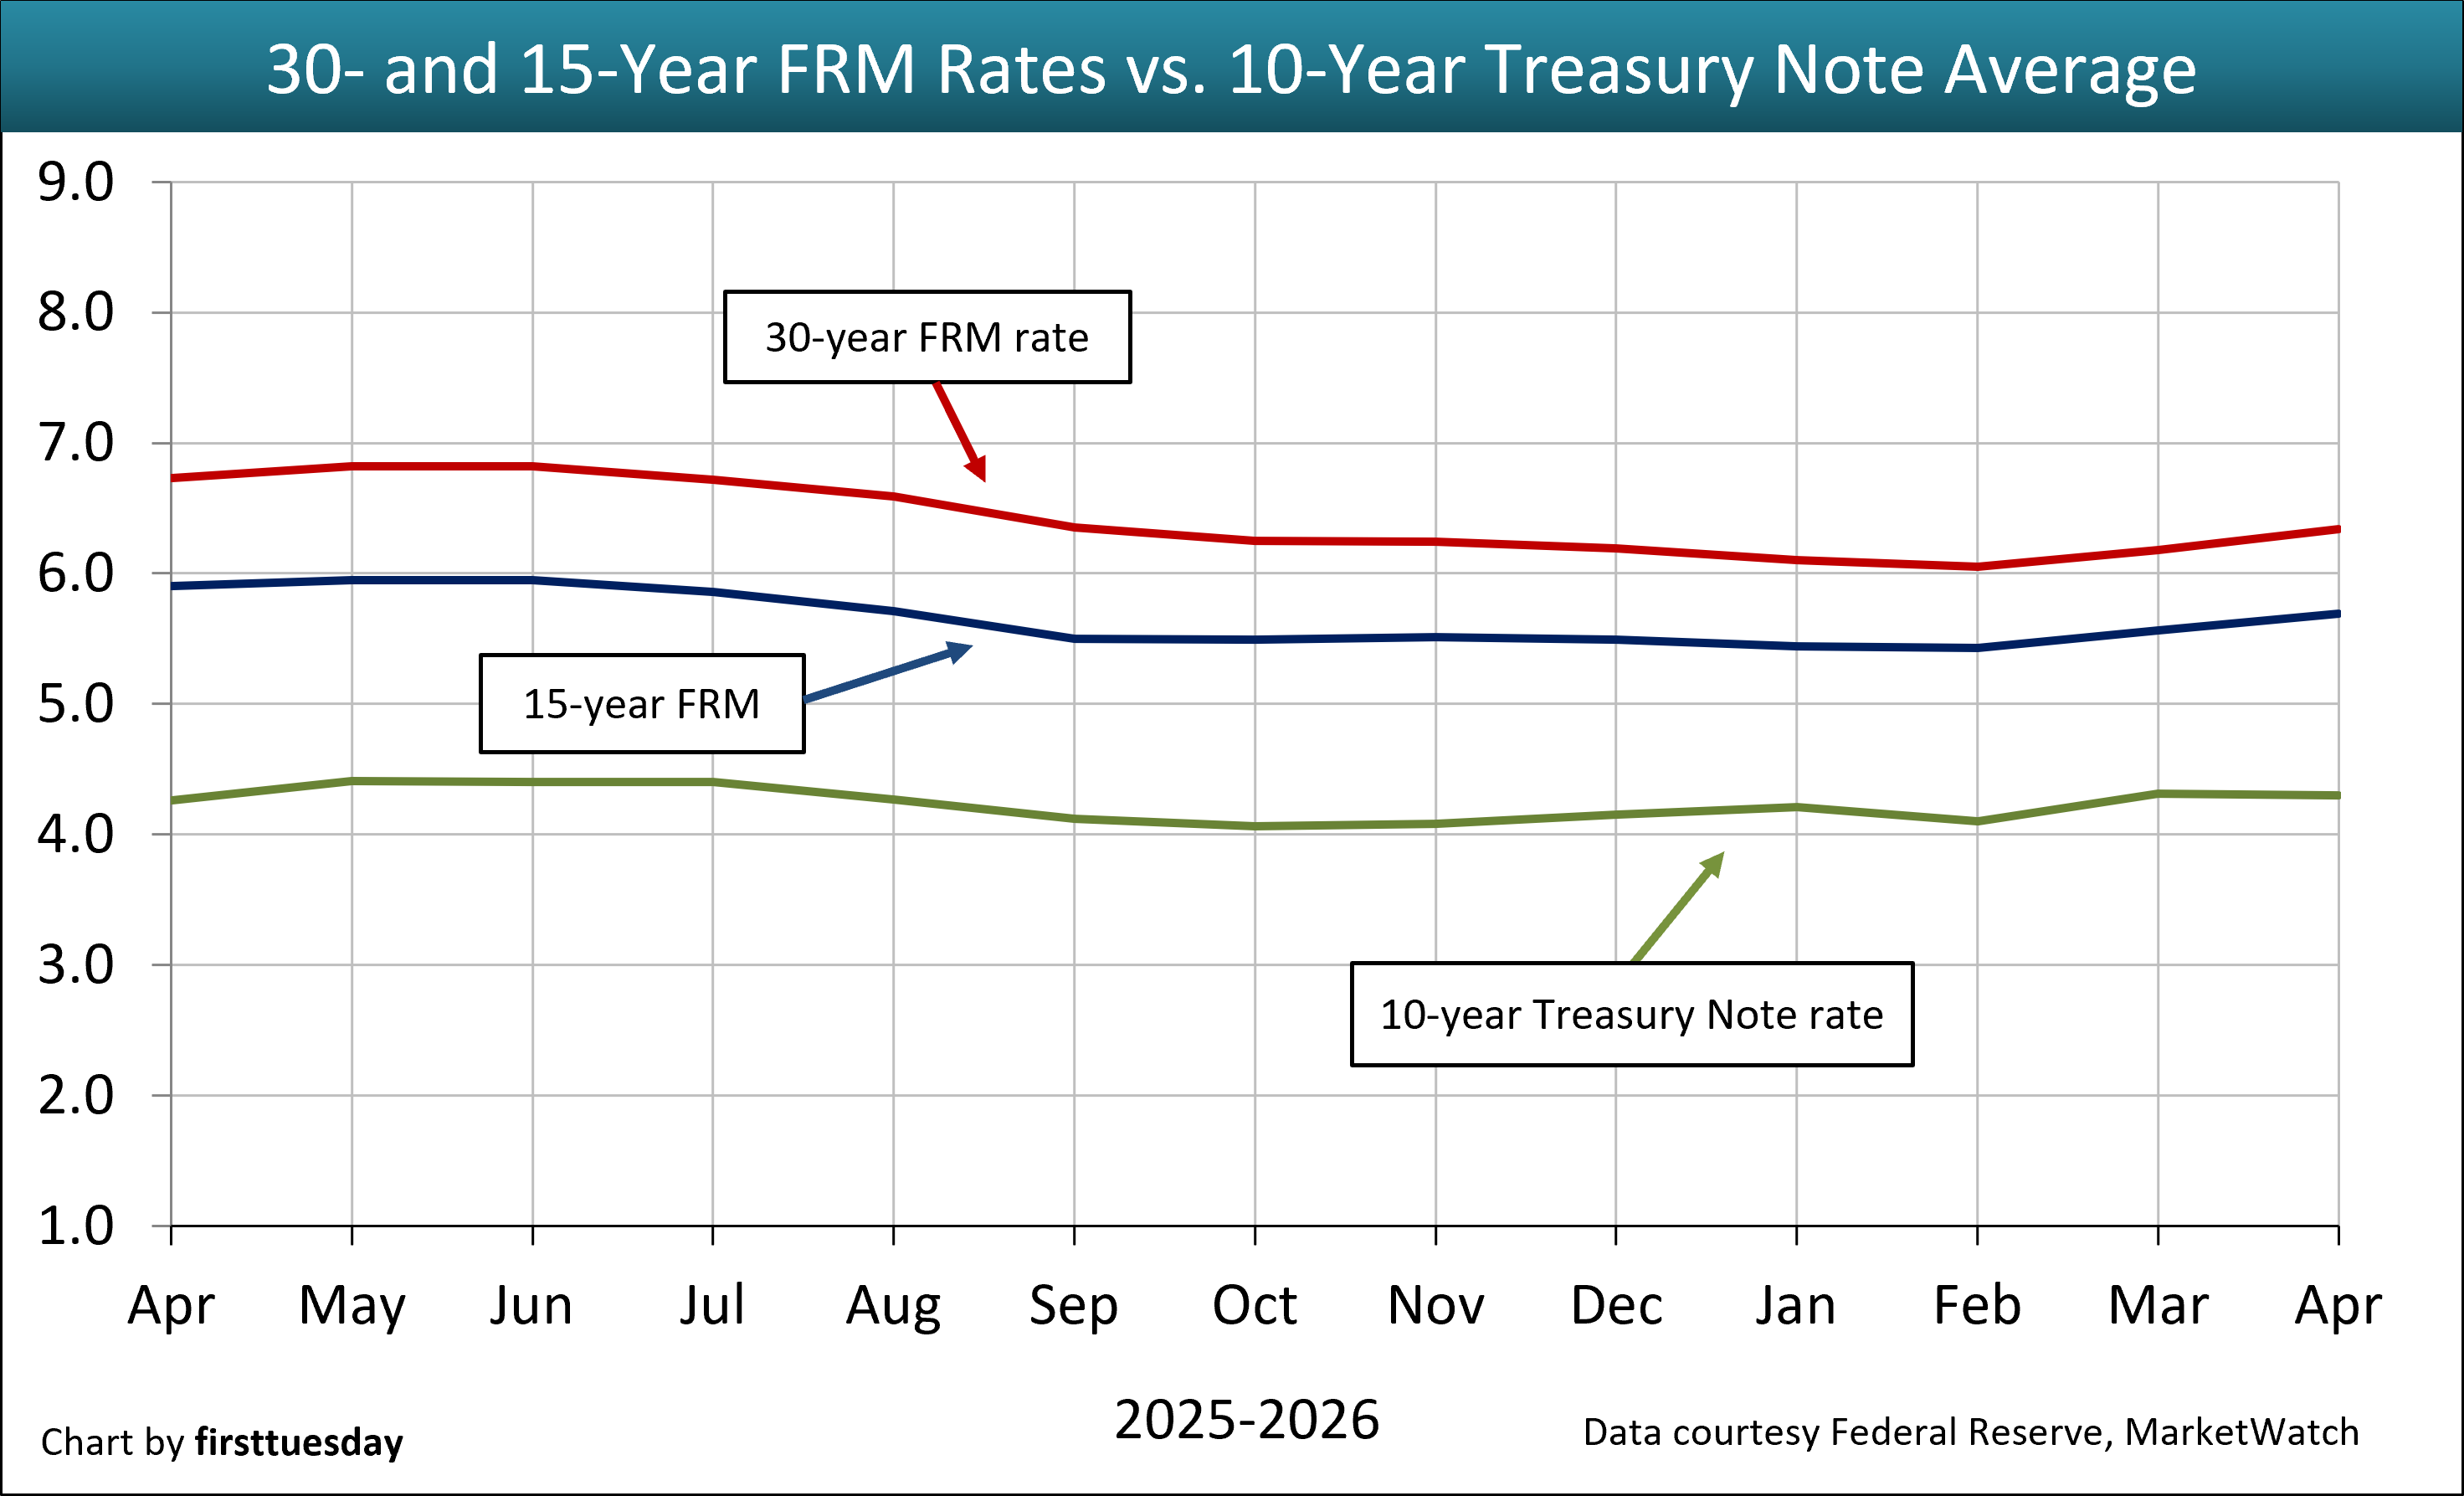
Avg 15-year April 2026 5.69% | Avg 30-year April 2026 6.34% | Avg 10-year T-Note April 2026 4.30% |
The average 15- and 30-year conventional commitment rates are the rates at which a lender commits to lend mortgage money in the United States-West/California for the duration of the life of each respective mortgage as reported by Freddie Mac. The green line reflects the 10-year Treasury Note Average, a leading indicator of the direction of future Freddie Mac rates. It is composed of the level of worldwide demand for the dollar and anticipated future domestic inflation.
| ||
 | ||
| Chart update 5/8/26 | ||
Current 5/7/26 3.69% | Month Ago 4/9/26 3.72% | Year Ago 5/8/25 4.33% |
This rate determines the minimum interest rate the seller must use in a delayed §1031 transaction and report when not receiving interest on §1031 monies held by a facilitator/accommodator. This rate also sets the amount of the ordinary income the facilitator/accommodator must report. | ||
 | ||
| Chart update 5/8/26 | ||
April 2026 3.61% | March 2026 3.61% | April 2025 4.21% |
The 3-Month Treasury Bill rate is heavily influenced by the Federal Reserve through the Fed Funds Rate as the base price of borrowing money in the short-term. It is used in determining the 3-month:10-year yield spread used to predict the likelihood of a recession one year forward. The posted rate is the monthly average for the listed month. Rates are released with a one-to-two month reporting delay.
| ||
 | ||
| Chart update 5/8/2026 | ||
April 2026 3.59% | March 2026 3.58% | April 2025 4.05% |
The six-month T-Bill rate is one of several indices used by lenders to periodically adjust the adjustable rate mortgage (ARM) rate. The adjusted rate equals the indexed rate (at the time of adjustment or an average of several prior rates) plus the lender’s profit margin. The posted rate is the monthly average for the listed month. Rates are released with a one-to-two month reporting delay. | ||
 | ||
| Chart update 5/8/26 | ||
April 2026 3.69% | March 2026 3.67% | April 2025 3.95% |
This index is one of several indexes used by lenders as stated in their ARM note to periodically adjust the note’s interest rate. The ARM interest rate equals T-Bill yield, plus the lender’s profit margin. The index is an average of T-Bill yields with maturities adjusted to one year. | ||
 | ||
| Chart update 5/8/26 | ||
Current April 2026 3.75% | Month ago March 2026 3.77% | Year ago April 2025 4.40% |
This index is one of several indices used by lenders as stated in their ARM note to periodically adjust the note’s interest rate. This figure is an average of the one-year T-Bill rates for the past 12 months. The ARM interest rate equals the 12-Month Treasury Average yield plus the lender’s profit margin. There is a one-to-two month lag in data reporting for the 12-Month Treasury Average. | ||
 | ||
| Chart update 5/8/26 | ||
Current 5/7/26 3.60% | Month ago 4/9/26 3.57% | Year ago 5/8/25 4.29% |
This index is one of several indices used by lenders as stated in their ARM note to periodically adjust the note’s interest rate. It replaced the LIBOR in 2021, which was found to be manipulated in the years leading up to the 2008 recession and financial crisis. The ARM interest rate equals the SOFR rate plus the lender’s profit margin. The rate is based on overnight borrowing in the U.S. Treasury repo market. The SOFR is produced in a transparent manner and is based on observable transactions, rather than models, and, unlike the LIBOR, is not dependent on bank estimates. | ||
 | ||
| Chart update 5/8/26 | ||
Short (3 years or less) May 2026 2.85% | Medium (3 to 9 years) May 2026 3.05% | Long (9+ years) May 2026 3.59% |
These rates determine minimum interest yield reportable on carryback financing. The applicable federal rate (AFR) category is determined by the carryback due date. Rates are for monthly payments, reported for the coming month.
| ||


Excellent read! This was informative, engaging, and easy to follow. Appreciate the effort you put into this. Keep up the great work!
Thanks for sharing this. I learned something new today from your blog.
Lots of charts and graphs with little meaning beyond that rates are and have been historically low . They provide Zero proof that a recession is imminent. Even the time frame is incorrect for predictive analysis. News Flash: CA is not the canary in the coal mine for the US Economy. Your problems there are unique to CA and how it has been mismanaged for decades.
Interest rates will remain relatively low for MANY years to come. The United States has such a large amount of debt that a significant increase in interest rates would leave the US government unable to make the payments on our debt. Defaulting on the deficit is not an option. Therefore rates will remain low.
Jeff Gundlach (the new bond king) says otherwise. IMO we will see 6% rates on 30yr mortgages in the next few years. The national economy is spiking now since money is still cheap to borrow but rates ARE going up so it makes sense to do some things now with cheaper money. Overbuilding due to speculation is a constant theme in our economy and recessions do happen. IMO mid 2019 will be the start of our next recession and the question is how shallow or severe it will be. To soon to tell due to to many factors, trade war, election results, foreign entities buying USA debt (or not).
Thank you. I love this article. Complex issues presented with clarity..
This is an awesome site with great information…
KISS – Keep it Simple & Stupid. Before, I sell almost everything: pots & pans, Insurance: property & Casualty; life & disability. All kinds of licenses; broker & agent licenses, even dog’s & cat’s license, I let them expired. Are we trying to be expert on extraneous matters of limited application; or to concentrate on practical & substantive issues of social engineering, better understanding, & dedicated service to clients? Let computer-brain-knowledge be ready for, far & between instant use, when needed. But, emphasis should be on KISS. After all, we are only salesmen; although, treated as professionals.
Very useful and concise information. It really tells the story very well.
I’ll have to admit the information overload is a factor in understanding, however it is good to know that First Tuesday continues to track these indices. Each chart references a brief explanation of its meaning. With continued support like this, outside of the Lending Industry interpretations, I’m starting to catch-on. First Tuesday,
you rock!