
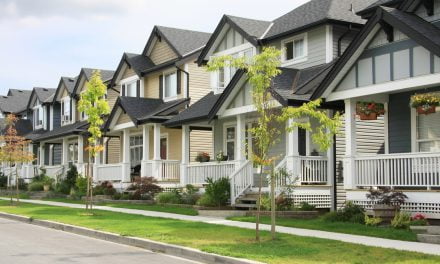
San Francisco is infamous for its housing shortage and dire need for more residential construction. In 2017, it finally began to answer that need.
San Francisco construction starts were double the historical average in 2017, according to Trulia. To get the historical average, Trulia averaged the number of housing starts each year between 1980 and 2016.
This steep growth in housing permits amounts to 6,270 new housing starts in the San Francisco metropolitan area during 2017. Of these permits, 92% were for high-density units, found in buildings containing five or more units.
Very few single family residences (SFRs) are built in San Francisco, with most months seeing approved permits in the single digits. That’s because the city is already built to capacity, and investors who purchase any tear downs or infill land are likely to make the most profit by building up rather than out.
Builders used to face more zoning encumbrances limiting density and building height — but these zoning restrictions are slowly being pulled back as lawmakers react to the area’s housing shortage.
Related article:
The rest of California is watching San Francisco
San Francisco is home to 2.2% of the state’s population and a little less than 400,000 housing units. Therefore, most of our readers will feel no direct impact from San Francisco’s housing situation.
But agents and brokers with an eye on the future need to pay attention. That’s because San Francisco’s housing market consistently runs a step ahead of the rest of the state.
So what did San Francisco’s housing market look like in 2017? Or, to ask the same question another way, what will California’s housing market look like in 2018?
Construction in 2017 did not actually rise too much in San Francisco over the previous year, but this follows a rapid year of growth in 2016. San Francisco is one of the only places in California where new building currently outpaces the construction numbers experienced during the Millennium Boom.
Home sales volume in 2017 was down 17% from 2016, devastating for local sales agents. This occurred as inventory declined rapidly, 25% below a year earlier in 2017.
Still, home prices continued to rise quickly in San Francisco. At the end of 2017, home prices were 11% above a year earlier in the low tier, 10% higher in the mid tier and 8% higher in the high tier. It’s likely 2018 will see these price increases cool off somewhat, as more construction translates to increased inventory and rising interest rates reduce buyer purchasing power.
More importantly for you, dear readers, San Francisco’s 2017 will look a lot like the rest of the state’s 2018.
Construction across California is poised to gain a boost from 2017’s passage of affordable housing bills. This much-needed new housing will begin to be delivered near the end of the year, and will be quickly gobbled up by hungry homebuyers.
California home sales volume was flat in 2017 (just like San Francisco’s 2016 sales volume). In 2018, declining inventory and rising mortgage interest rates will likely see California sales volume echo the decreased sales volume seen in San Francisco during 2017.
Still, home prices will continue to rise somewhat in 2018, as they did in San Francisco during 2017. That’s because homebuyers are willing to pay more to compete for the limited inventory available. But today’s higher interest rates will complicate price movement, as homebuyers’ buyer purchasing power is reduced. Thus, expect the price rise to slow across California in 2018 and flatten late in the year, into 2019.


