
Why this matters: Jobs bring income needed to rent or buy a property, and acquiring occupancy means a rental or sales transaction — for brokers that’s fees. The level of jobs throughout California’s population tracks with the rate of our labor force participation. The remainder of our population without jobs do not directly receive income as a participant producing the state’s gross domestic production.
The labor force participation (LFP) rate is the percentage of California’s population who are employed, or unemployed and actively seeking employment.
Presently, the LFP rate in California’s population is stabilizing following a period of downward trend after peaking at 67% in 2000. The aging of our population is pushing the decline, though damaging drops occurred in the recessions of 2008 and 2020. Further, the California population is slipping, as it always does as a cyclical matter in a recession.
During the years of recovery between downturns in the economy, California’s LFP rate remains roughly one percentage point below the U.S. average. In 2025, the two rates converged, as the U.S. LFP faltered while California’s slow LFP recovery continued. For December 2025, California and the nation are both about 62% LFP rate.
When individuals drop out of the workforce as no longer employed and are not seeking employment, a false impression of an improving jobs market is created. The unemployment number in the LFP drops, also a deceptive result as the number of jobs most often have not dropped.
Here, the operative statistic is what is happening to the number of individuals employed — did it drop, rise or hold steady. It is primarily the employed who rent and buy homes. In turn, their employers rent or buy commercial space needed for employees.
California employment — jobs — grew from a pre-pandemic peak in December 2019 of 17.7 million employed individuals, reaching an all-time high of 18.2 million in December 2024. However, in August 2025 our statewide employment figure sits at 18 million, and trending down. The present flow of data now is interrupted by federal disruption, but it is likely the decline in the employed is continuing.
Brokers who watch the jobs number for the employed along with the LFP rate find the trends useful for forecasting their future brokerage conditions — no need to concern yourself about the unemployment rate as the unemployed have no earnings from a job.
Updated January 30, 2026.
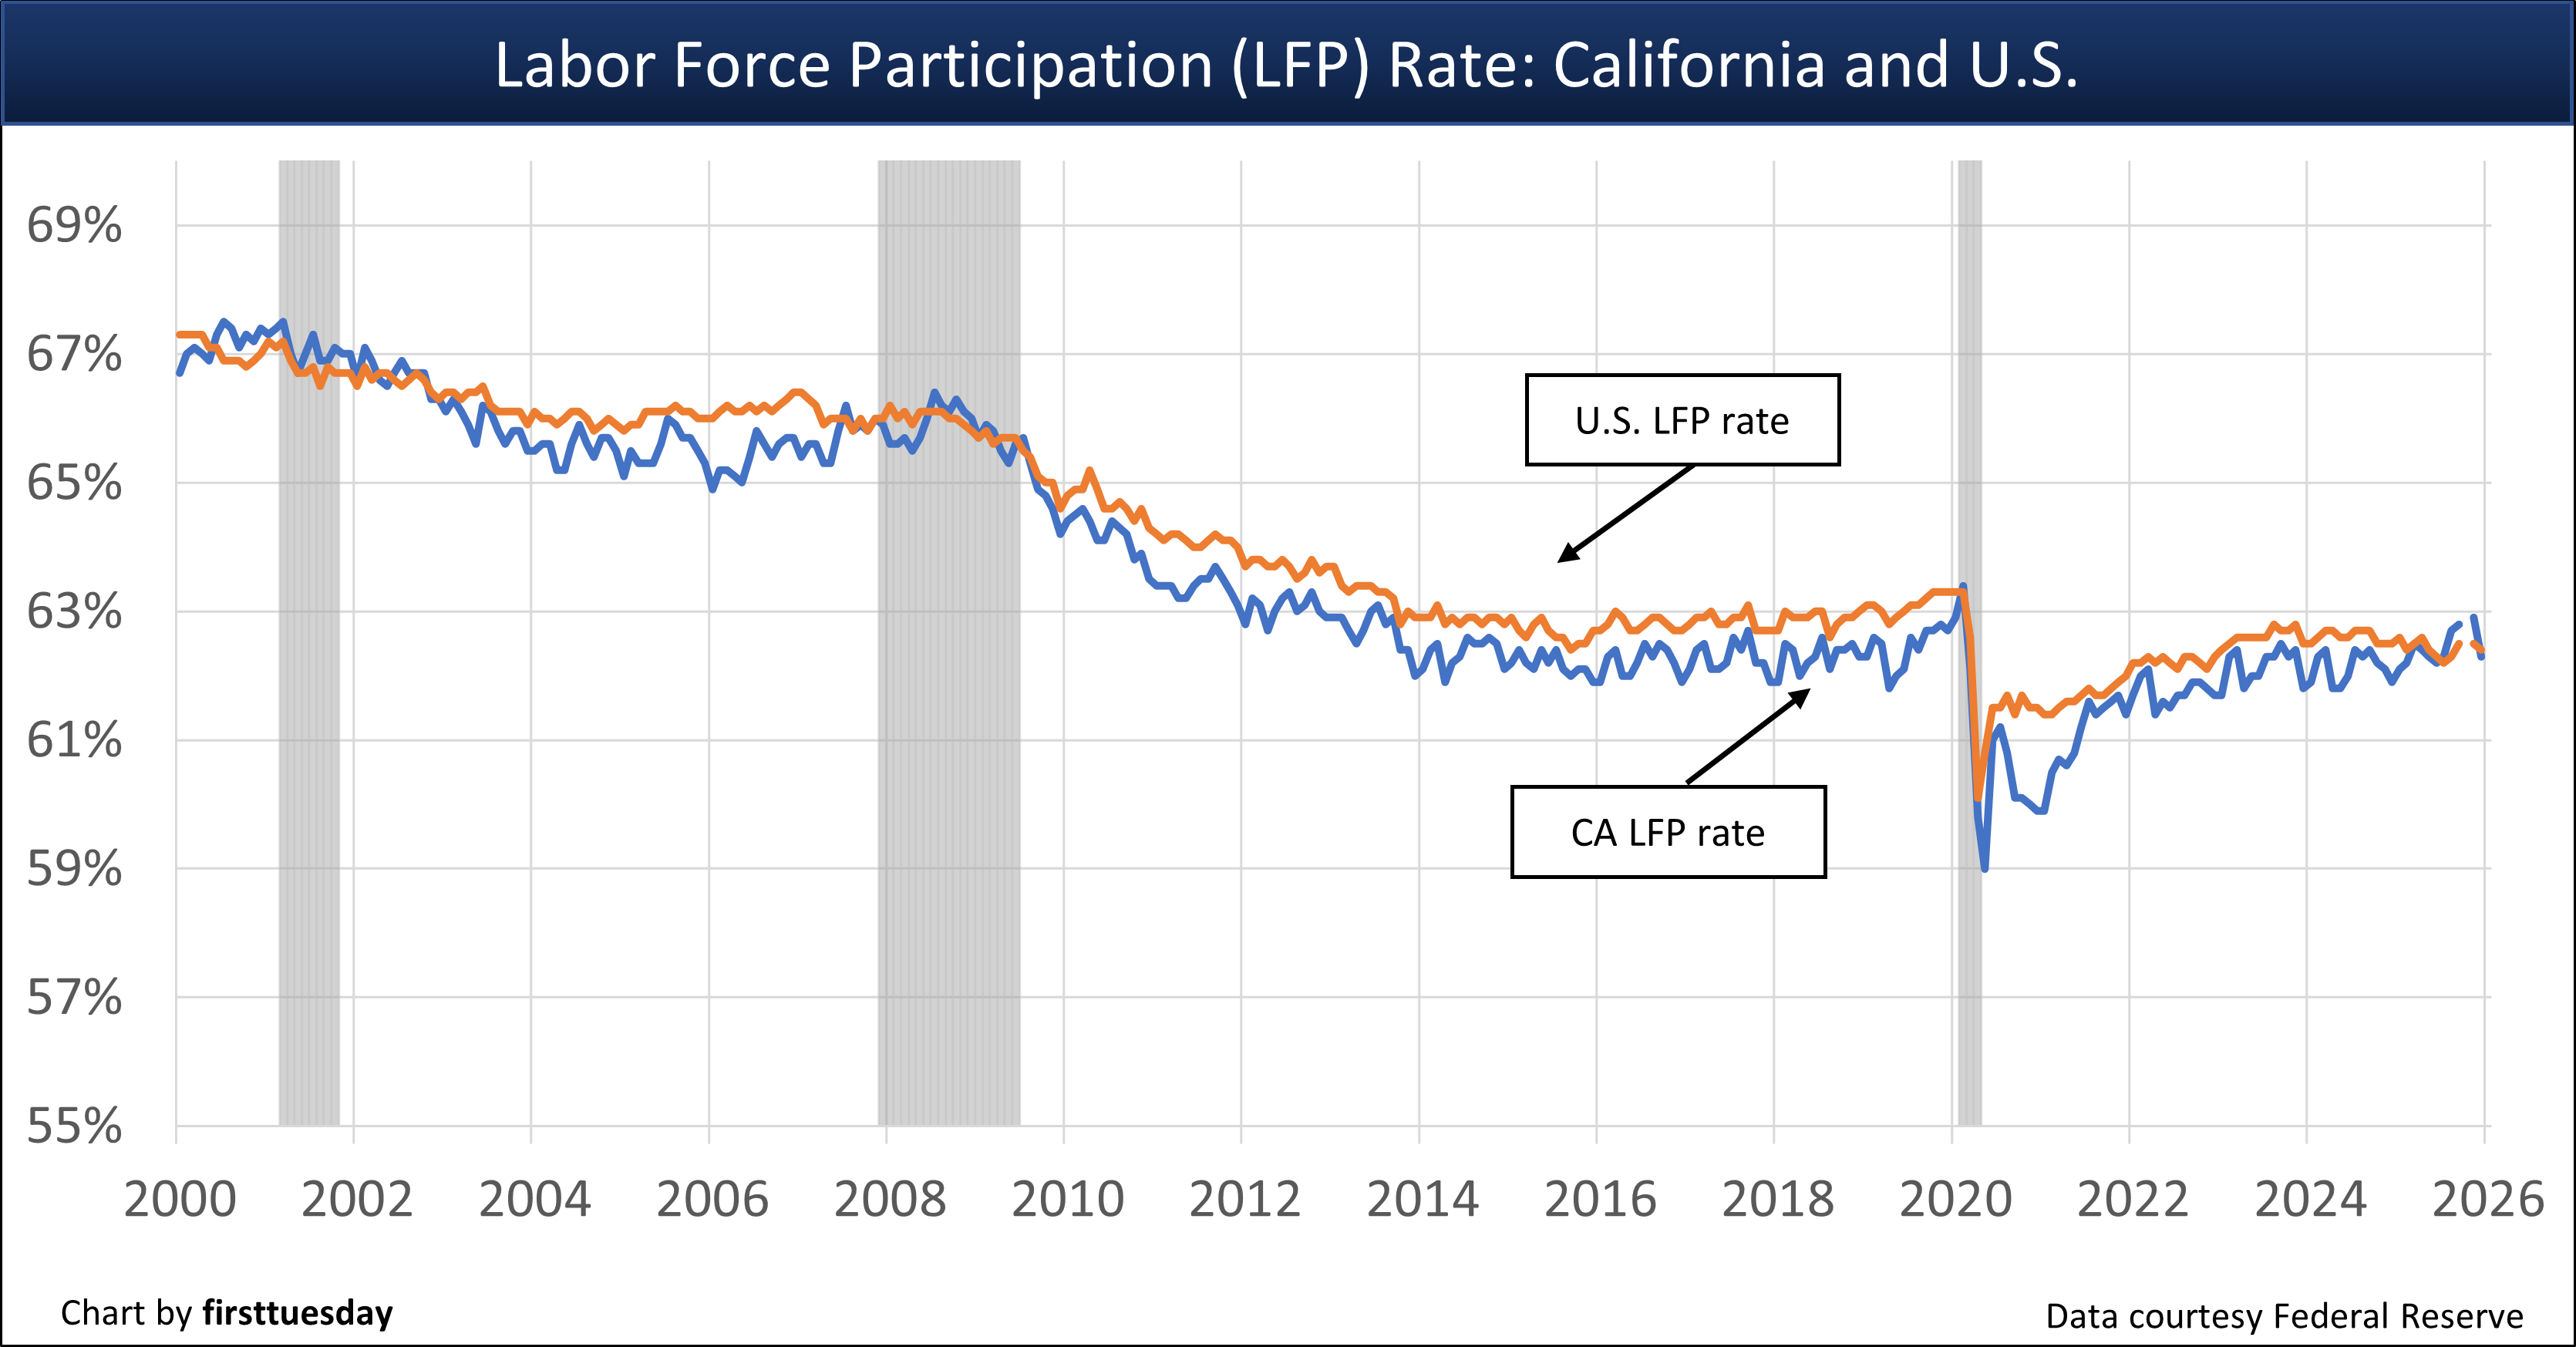
Chart update 1/20/26
Dec 2025 | Nov 2025 | Dec 2024 | |
| California labor force participation (LFP) rate | 62.3% | 62.9% | 61.9% |
| U.S. labor force participation (LFP) rate | 62.4% | 62.5% | 62.5% |
Editor’s note — Due to the 2025 Federal shutdown data was not collected for October 2025.
Jobs mean income, and their income is your income
The trend of the employed in California’s population has the most consistent impact of any economic factor on the vigor of the real estate market, driving good markets and bad. Further, when a jobholder considers a home to rent or buy, their financial decision to acquire a possessory interest in real estate — whether a leasehold or a fee estate — is significantly influenced by their annual gross income from employment. A paycheck is the primary financial base for an individual’s ability to qualify to lease a residence or obtain mortgage funds to buy a home.
Looking forward, job uncertainty is expected to continue through 2026, and likely beyond for two or three years. The forces pressing this decline include uncertain business conditions, volatile import taxes on products and material for consumers and producers, reduced ability to export, diminished tourism and travel, immigration and other 1930s-type isolationist conditions.
Related article:
Income means housing
Households respond to changes in their income by adjusting monthly housing expenses and changing their choice of location. For Californians, the retired and those workers with less in-demand skills tend to exit while new arrivals come with skills that command wages sufficient to support their relocation.
During periods of economic growth, local construction of homes and apartments increases to meet the growing demand for housing — not met by for-rent and for-sale inventory — which results from the uptick in voluntary turnover of tenants and owners.
Reductions in local employment normally lead to lower rents and prices paid by tenants and buyers for the occupancy and use of all types of real estate, with rent for housing being the most stable.
Areas with higher LFP rates support higher absorption rates for properties available for rent or sale.
A sustained dip in LFP rates contributes to reduced transaction volume across all classes of real estate, especially acute in lower- and middle-income brackets.
When employment falters, the result is:
- fewer leases signed; and
- fewer sales closing.
Significantly, most buyers need employment to qualify for mortgage financing, with the amount of borrowing to fund a purchase dependent on their household’s gross income.
Renting or buying means broker fees
Regional differences in LFP growth are used by agents and brokers to assess relocation to areas more likely to lead to more real estate transactions. Here, branch office operations come into play.
Also, brokers and agents can pinpoint a region with lower absorption rates when they observe:
- lower turnover;
- incongruent inventory for sale or lease;
- fewer sales and leasing transactions; and
- lower fees per transaction.
In conclusion, a stable, rising LFP rate supports enhanced brokerage income flows. A higher LFP helps a broker in search of a client — more fees, more often.


