
The first quarter (Q1) 2023 reports on Southern California’s (SoCal’s) commercial market are in.
Increases in availability, vacancy, time-on-market and landlord concessions have returned after more than a decade of substantial growth for the industrial, retail and office markets across SoCal, according to Voit Real Estate Services.
San Diego County — industrial, retail and office
San Diego County’s industrial vacancy rate is:
- 2.53% in Q1 2023;
- up from 2.28% in Q4 2022; and
- above the vacancy rate of 2.24% in Q1 2022.

San Diego County’s retail vacancy rate is:
- 4.26% in Q1 2023;
- up from 3.93% in Q4 2022;
- below the 4.75% level seen in Q1 2022.
San Diego County’s office vacancy rate is:
- 11.85% in Q1 2023;
- up from 11.67% in Q4 2022;
- slightly below the 11.99% vacancy rate in Q1 2022; and
- well above the pre-pandemic vacancy rate of 10.30%.
San Diego County’s industrial net absorption — the total change in occupied industrial space — is:
- -147,262 square feet in Q1 2023;
- down from +797,817 square feet in Q4 2022; and
- down from +687,935 square feet in Q1 2022.
San Diego County’s retail net absorption is:
- -394,774 square feet in Q1 2023;
- down from +183,203 square feet in Q4 2022; and
- down from +275,998 square feet in Q1 2022.
San Diego County’s office net absorption is:
- -200,124 square feet in Q1 2023;
- down from +1,425 square feet in Q4 2022; and
- down from +171,638 square feet in Q1 2022.
Orange County — industrial and office
Orange County’s industrial vacancy rate is:
- 1.46% in Q1 2023;
- up from 1.08% in Q4 2022; and
- above the 1.28% vacancy rate in Q1 2022.
Industrial space remains relatively scarce.

Orange County’s office vacancy rate is:
- 16.85% in Q1 2023;
- up from 15.75% in Q4 2022; and
- above the 14.70% vacancy rate in Q1 2022.
Orange County’s industrial net absorption is:
- -496,325 square feet in Q1 2023;
- down significantly from +2,644,930 square feet in Q4 2022; and
- down significantly from +1,090,457 square feet in Q1 2022.
Orange County’s office net absorption is:
- -1,262,288 square feet in Q1 2023;
- down significantly from -413,803 square feet in Q4 2022; and
- down significantly from -364,433 square feet in Q1 2022.
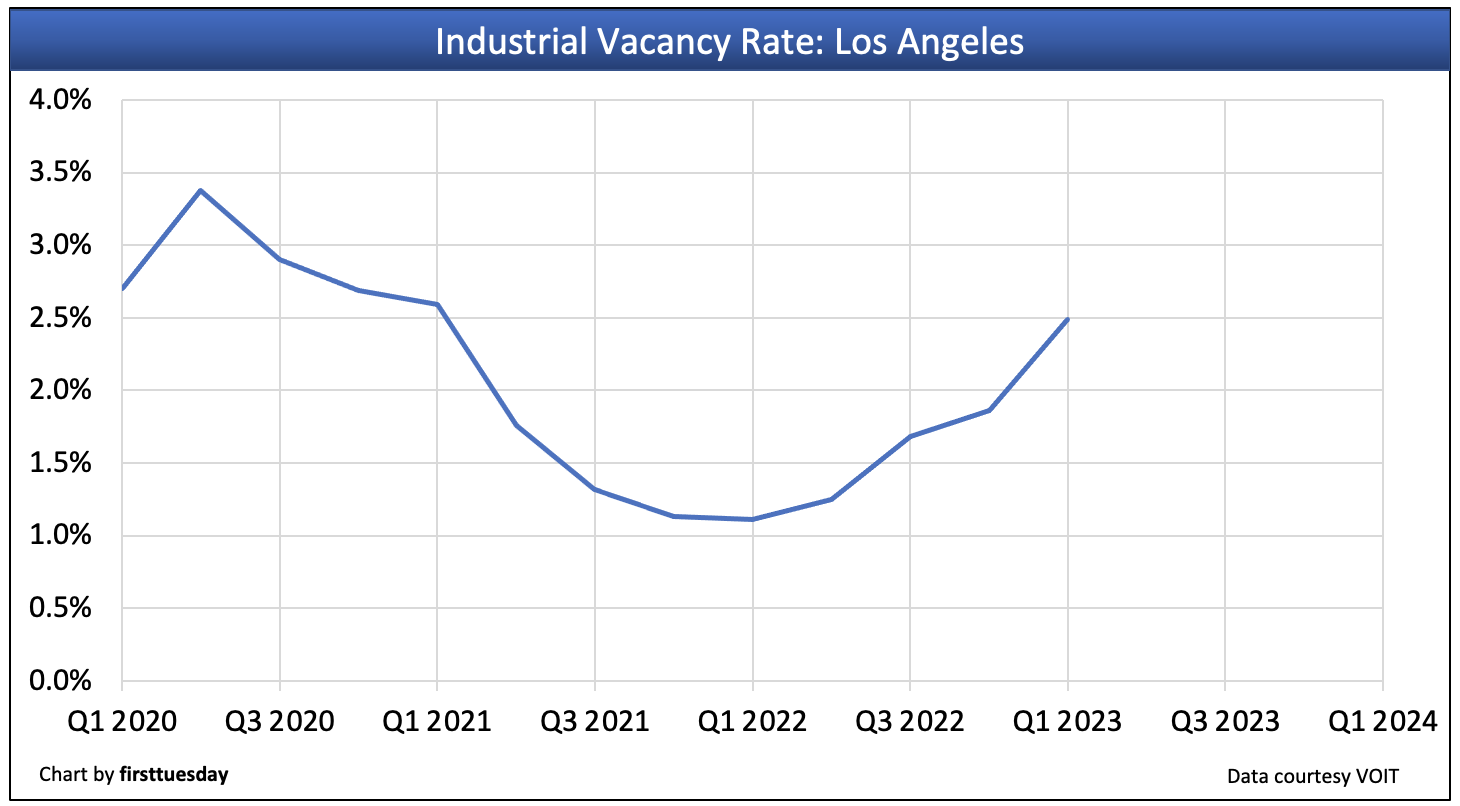
Los Angeles County — industrial
Los Angeles County’s industrial vacancy rate is:
- 2.49% in Q1 2023;
- up sharply from 1.86% in Q4 2022; and
- above the 1.13% vacancy rate in Q1 2022.
Los Angeles County’s industrial net absorption is:
- -3,606,403 square feet in Q1 2023;
- down significantly from -712,855 square feet in Q4 2022; and
- down significantly from +1,587,197 square feet in Q1 2022.
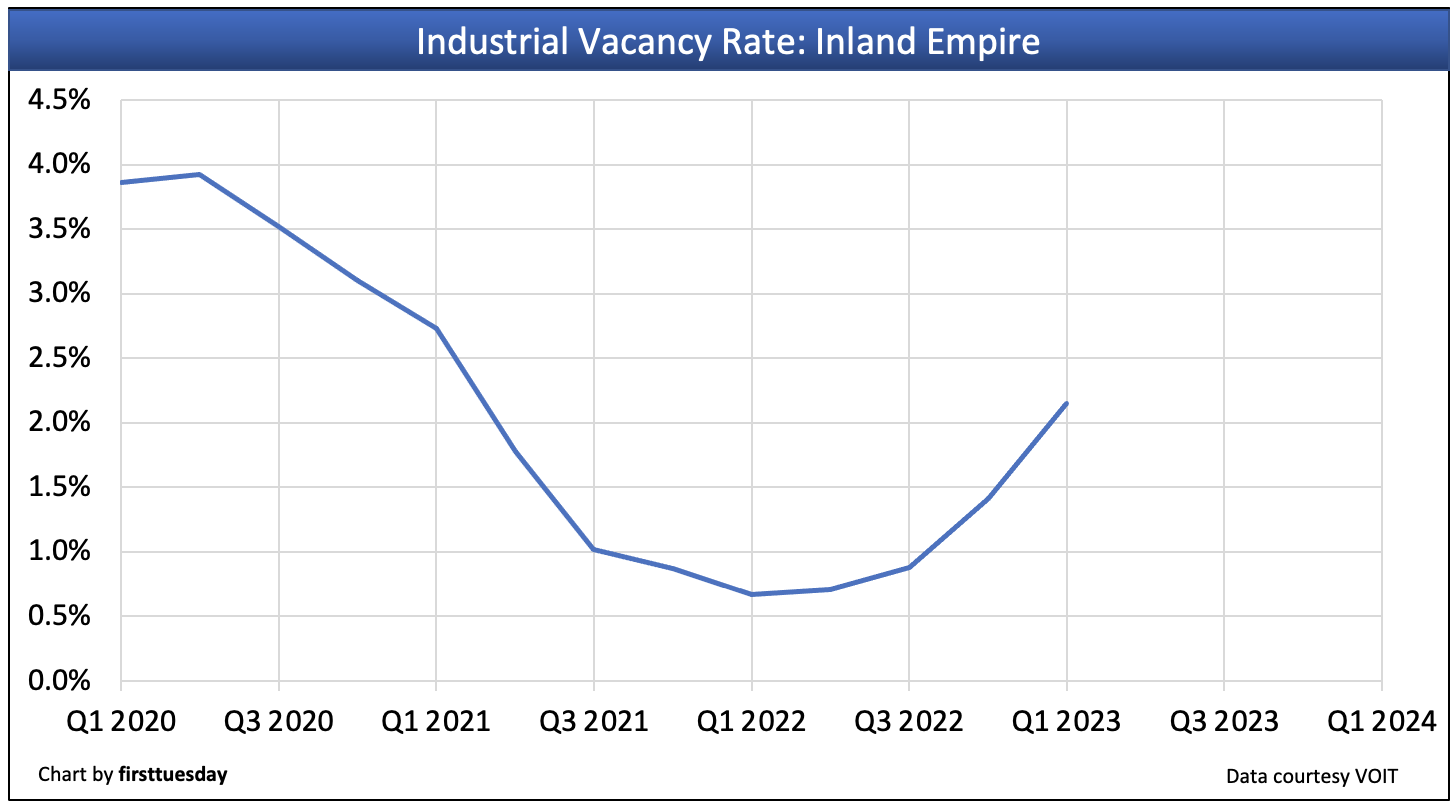
Inland Empire — industrial
The Inland Empire’s industrial vacancy rate is:
- 2.15% in Q1 2023;
- up sharply from 1.41% in Q4 2022; and
- above the 1.02% vacancy rate in Q1 2022.
The Inland Empire’s industrial net absorption is:
- +3,063,631 square feet in Q1 2023;
- up from +2,152,486 square feet in Q4 2022; and
- below +4,439,510 square feet in Q1 2022.
Related article:


