Baby Boomers boost today’s homeownership rate
Homeownership peaked in 2006, at 61% in California and even higher nationwide. Since then, homeowners have made up less and less of the population. The latest data has the homeownership rate level with 1996:
Chart 1
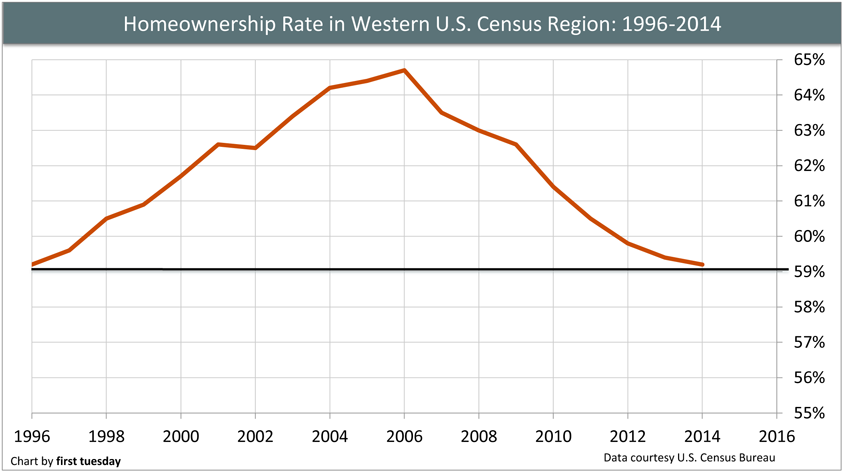
The chart above shows the homeownership rate for the Western Region of the U.S., which covers 13 states, including California. The homeownership rate for this region peaked at nearly 65% in 2006 and has since declined to today’s level of 59.2%, level with what it was in 1996.
However, it’s possible the older Baby Boomer generation is propping up the homeownership rate. After all, at 76.7%, this generation has the highest homeownership rate of any age group in 2014 (the most recently reported year by the U.S. Census). Let’s see what the homeownership rate change since 1996 looks like, broken down by age group:
Chart 2
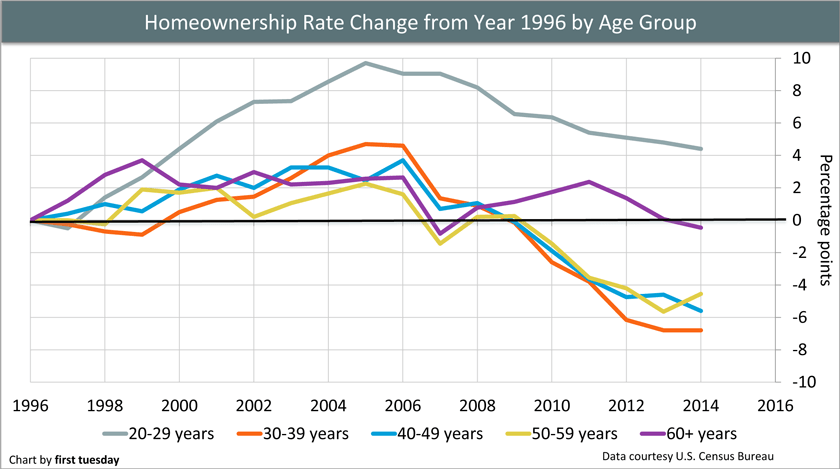
This chart shows the percentage point change in homeownership rates amongst age groups, from the year 1996. On its face, the only age group above the 1996 rate is the youngest home-owning group, aged 20-29. However, don’t let this mislead you — they still have the lowest homeownership rate of any age demographic, with 24% owning a home in 2014 compared to 20% in 1996.
Therefore, while it’s promising that young people are owning at a higher rate today, this progress is lost to the declines made across the older demographics, who are also the largest home-owning groups:
| Age group | 1996 | 2014 | Percentage point change |
| 20-29 years | 19.7% | 24.1% | +4.4 |
| 30-39 years | 51.5% | 44.7% | -6.8 |
| 40-49 years | 65.6% | 60.0% | -5.6 |
| 50-59 years | 74.4% | 69.8% | -4.6 |
| 60+ years | 77.1% | 76.7% | -0.5 |
A recent piece by Vox which examined the homeownership rate on a nationwide scale found the retiree homeownership rate to be faring the best (though it did not include the 25 and under crowd as our analysis does). There is something to be said of homeowners aged 60 and over—their homeownership rate has been more stable than any other group, oscillating at most four percentage points above and less than half a percentage point below the 1996 rate.
On the other hand, the 30-39 year age group is nearly seven percentage points lower than 1996 as of 2014. Further, the current rate is likely even lower, as the homeownership rate has continued to decline in California. This group has been cautious to become homeowners during the recovery, as:
- the lack of jobs and financial uncertainty initially caused young adults (then twenty-somethings) to shack up with roommates or move back home;
- when they did enter the jobs market, smaller incomes than their predecessors held them back from saving;
- while they have been able to move out of the nest, high rents continue to eat away at paychecks, limiting down payment savings; and
- having watched the foreclosure crisis unfold before their impressionable young eyes, this group is hesitant to take on homeownership and the risks associated with mortgage payments and other carrying costs.
A homeownership rate for the “normal years”
To be fair, the homeownership rate of the mid-2000s was the result of deregulation of the mortgage market. Lenders originated a lot of bad mortgages, and homeowners who were unable to make payments lost big time. Home values plummeted and foreclosures took over. Ten years on, prices have yet to return to the inflated levels of the Millennium Boom in most parts of California.
So if we don’t want to aspire to the inflated homeownership levels of the mid-2000s, what is “normal” and how do we get there?
The norm for California homeownership has differed from decade to decade. Before World War II ended, the homeownership percentage rate was typically in the low 40s. In 1960, it was at a high of 58% before oscillating around 55% for the next three decades.
Then, in 2006 it reached an overblown 61% in California. It then declined until 2012 when it reached 54%, where it continues to rest as we begin 2016.
Going forward, it’s going to be more difficult to achieve this healthy average. As we see in Chart 2, the homeownership rate continues to decline across all age groups. Further, homeownership is not a value Baby Boomers have passed on to successive generations. The 60-69 age group today consists of Baby Boomers. Last decade, the 50-59 year-old age group consisted of these same Baby Boomers, and so on. In these previous decades, Baby Boomers propped up the homeownership rates of younger age groups, of which they were apart. Now, we see younger adults owning less often.
If California is going to maintain its 55% average, the young generation needs to produce more homeowners. The good news: the youngest group of homeowners, those aged 20-29, remain well above their historical average rate, despite having decreased along with all other age groups following the 2008 Great Recession. Still, for the trend to continue into the middle-aged groups, some change has to happen. Specifically, young adults need to start saving for down payments.
Policy-wise, one thing the state or federal government can do to help is to subsidize down payment savings for renters who wish to become first-time homebuyers. The mortgage interest deduction (MID) exists to help current homeowners with a mortgage, but there is no subsidy to help renters get to the point of qualifying for a mortgage.
Second, local governments can help ease the high rent burden in urban areas like San Francisco, Los Angeles and San Diego. This is done by zoning for more (read: denser and higher) rental housing to be built.
Real estate professionals, what are your ideas to bring the homeownership rate back up for middle-aged households? Share your thoughts in the comments.


