California employment has surpassed the number of jobs held prior to the Great Recession — 15.6 million — reaching over 16.3 million jobs as of July 2016. While job numbers in July 2016 decreased from the prior month, the year-over-year growth shows an increase of 383,000 jobs. In terms of employment, we are continuing a strong period of economic expansion.
However, while the number of jobs has finally caught up and continues to rise steadily, wages have not yet increased at the same pace. Further, California’s working-aged population increased by 1.2 million during the employment recovery, while the number of jobs has only increased 781,500. Today’s improved demand for employees will result in higher wages, though increased labor force participation is likely to soon outpace job growth and offset wage increases. Thus, employment in California will likely reach a full recovery around 2018 or 2019.
The increased momentum of jobs growth takes about 12 months to stoke homebuyer confidence. Thus, expect a small wave of buyer-occupants and a slight rise in home pricing through 2016 — that is, before interest rate increases begin to stifle home sales in 2017.
There is a 1-month reporting delay for all data.
Updated 08/24/2016. Original copy released 10/07/2009.
Chart 1
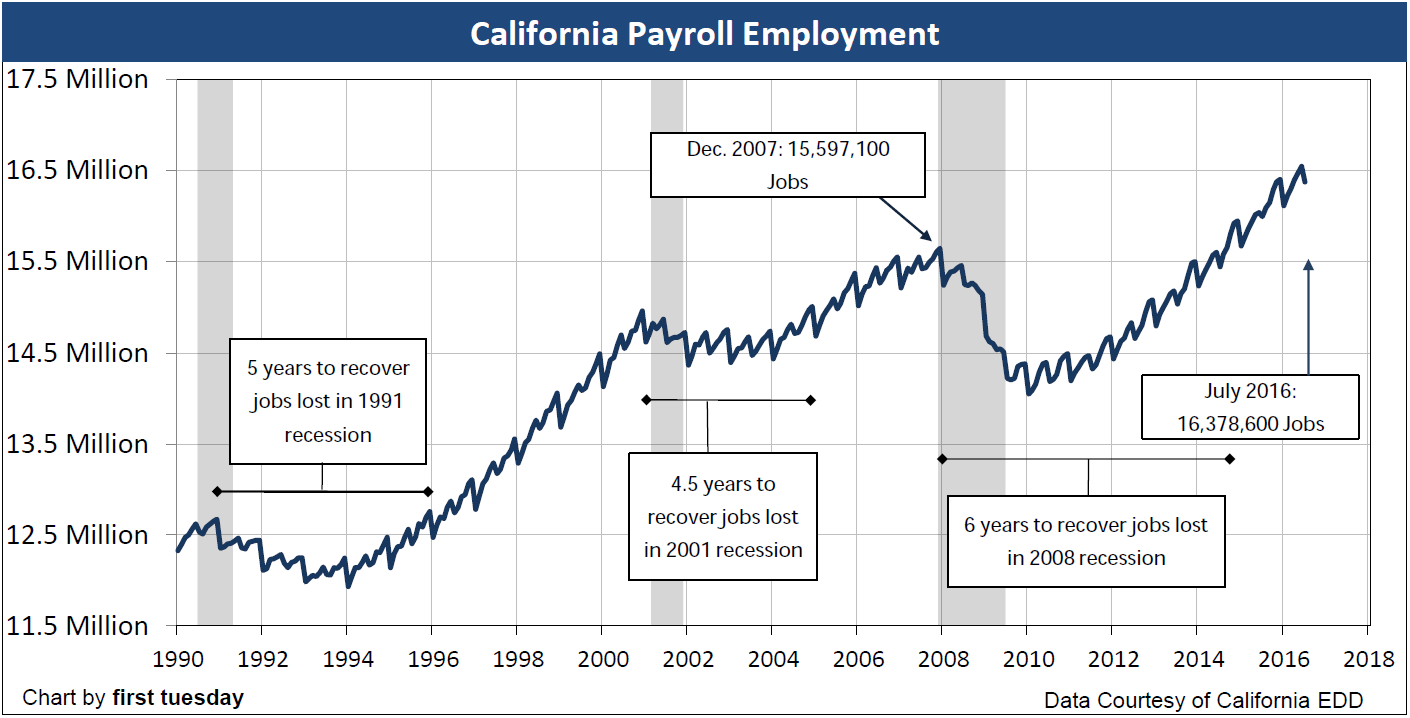
Chart update 08/24/16
| Jul 2016 | Jun 2016 | Jul 2015 | |
| Total CA Employment | 16,378,600 | 16,549,800 | 15,995,600 |
Chart 2

Chart update 08/24/16
| Jul 2016 | Jun 2016 | Jul 2015 | |
| Los Angeles | 4,316,900 | 4,373,200 | 4,241,000 |
| San Francisco | 1,082,900 | 1,081,700 | 1,055,900 |
San Diego | 1,418,200 | 1,429,500 | 1,390,100 |
| Riverside | 1,364,000 | 1,382,200 | 1,332,500 |
| Orange | 1,580,600 | 1,590,600 | 1,539,700 |
Data Courtesy of the California Employment Development Department (Labor Market Information Division)
All forecasts are made by first tuesday. Forecasts are based on current data, influential factors and market trends.
To understand the real estate market, look first at local employment
The charts above track the single most important factor in determining the past and future of real estate in California: the number of people employed. These charts review total employment numbers statewide and for California’s five most populous counties. The gray bars in Chart 1 indicate periods of recession in the United States economy (as tracked by the National Bureau of Economic Research).
Some key points to pay attention to:
- In the single month of July 2016, California lost 171,200 jobs, still an improvement of 383,000 jobs over July 2015.
- It took California over six years to recover all jobs lost during the 2008 recession.
- Despite the increase in job numbers, California has only gained 781,500 of the 1.2 million jobs needed to make up for the intervening population increase of working-aged individuals, and has yet to reach a full jobs recovery.
The quantity of jobs in California directly impacts statewide homeownership. Without a paycheck, nobody can afford to rent an apartment or buy a house (unless they are subsidized by the government or possess substantial independent wealth).
The financial basis for an individual’s creditworthiness, essential to lease a residence or borrow money to buy a home, is:
- a paycheck;
- self-employed earnings from a trade or business; or
- income from investments.
When a jobholder buys a home today, their decision to buy a particular property is influenced by:
- the amount saved for a down payment;
- their annual income from all sources;
- a lender’s willingness to lend to the homebuyer; and
- any government subsidies available to the jobholder.
Of all the factors affecting our economy, however, employment throughout California’s population has the most impact on the vigor of the real estate market. This is true in good economic times, times of financial crisis or economic recession.
Without jobs, wage earners have no financial ability to make rent or mortgage payments. The unemployed are financially unable to occupy any type of residential property (without direct government funding or personal wealth). Further, without work to provide jobs, businesses have no need to occupy and use:
- retail space;
- office suites;
- warehouses for inventory and distribution;
- industrial buildings for production; or
- land for development.
Demand for all types of real estate increases with the number of local jobs, as during periods of economic development or boom. Additions to the local labor force tend to drive rents and prices up on properties in the vicinity and results in local construction of homes and apartments.
On the other hand, a decline in the number of local jobs reduces the need for all types of real estate, as during a recession. Likewise, reductions in local employment lead to lower rents and prices paid by tenants and buyers for the occupancy and use of real estate. The current trend in the quantity of individuals employed in a region sets the direction for:
- the volume of rentals and sales in the local real estate market during the following 12 to 18 months; and
- the movement of rents and prices paid for the use and occupancy of all types of real estate in the following 24 to 30 months.
Other jobs issues which affect the level of rents and prices paid for property include the:
- quantity of employed individuals;
- quality of jobs available; and
- types of jobs existing and developing in the local market.
For instance, if a community relies heavily on the construction industry (such as the Inland Empire during the Millennium Boom), then changes in that industry will certainly impact the local housing market. In the Inland Empire, the employment picture became particularly grim following the downfall of the construction industry.
To get an idea of what type of job growth your community can expect in the coming years, here is a projection by California’s Employment Development Department on the percentage of growth to take place between 2010-2020:
Mining and logging 10.4% Construction 26.2% Manufacturing 0.4% Wholesale trade 25.8% Retail trade 22% Utilities 7.3% Transportation and warehousing 18% Information 8.3% Finance and insurance 16% Real estate and rental and leasing 10.7% Professional, scientific and technical services 25.6% Management of companies and enterprises 4.7% Administrative and support and waste management 24.9% Educational services (private) 28.8% Health care and social assistance 24.9% Arts, entertainment and recreation 15.3% Accommodation and food services 27.5% Other services 13.7% Federal government -13.7% State and local government 6.3%
Quantity of employed individuals
Historically, jobs in California create homeowners and tenants on an approximate 50:50 basis. Roughly half of all households own the residence they occupy and the other half rent. This ratio became badly skewed during the Millennium Boom when the California homeownership rate increased to an unsustainable 61%.
Our state’s homeownership rate has declined dramatically since 2006. As of Q4 2015, the homeownership rate is 54.1%, just below our state’s stabilized equilibrium rate of 55% before the Millennium boom. This rate will remain weak through 2016 at least. It is unlikely to return to our prior long-term rate due to the increased tendency to rent in urban locations, where the better paying jobs are found.
The appreciation or depreciation of property values is triggered by increases or decreases in:
- local population density; and
- the economics of the jobs (read: numbers, skills and pay levels) held by the local population.
The unemployment rate has no effect on the present real estate market. The unemployed and underemployed do not rent or buy real estate — they first need a full time job to do so.
Related article:
First nonresidential, then residential
The loss of jobs has a ripple effect on all types of real estate beyond SFRs. As employees are shed, the need for office space, commercial space and industrial space is reduced by an equal or greater amount. Subleases, reduced rents and vacancies across all segments of California’s real estate economy are the direct results of job loss.
As nonresidential vacancies increase, single family residential (SFR) vacancies likewise increase.
At the close of 2014 (the most recently reported Census year), California had 9 million SFR units and 15.9 million individuals employed, according to the U.S. Census.
Thus, California had slightly less than two-thirds as many homes as people on payroll. More meaningfully, 54.1% of households in California own the home they live in as of Q4 2015. Most homeowners are employed.
Thus, with every ten jobs lost, six people will not be able to purchase a home or retain the home they already live in (unless they have cash reserves). The remainder simply cannot afford to pay rent and will lose their housing. The reverse occurs when payroll numbers increase.
Forecasting the jobs recovery
While readers observe payroll data as reported by the media or others, they must be certain to distinguish between what is happening to California jobs and what is taking place across the rest of the nation. California took a disproportionately greater hit to jobs during the 2008 recession in comparison to national averages. The magnitude of California’s real estate bubble exceeded those of all other states (except Nevada and Florida) in terms of its negative impact on price, lending, construction, speculation and anticipation of demand.
The recession’s impact on the housing industry was equally severe. In turn, the recovery will continue its long, bumpy plateau path as we correct for the recent past’s excesses and regulatory groundwork is laid for stable, long-term job growth. What happens in a commodity economy such as Texas, and in every other state, has little relationship to what happens in California, a state defined by much more than the continental divide.
Jobs are further localized within California’s individual counties. San Francisco is the only county which has regained (and exceeded) all jobs lost during the recession when considering population gains since 2007. This is primarily due to its large technology industry, which has swiftly recovered. Other counties, particularly Los Angeles and Riverside, have a long way to go. These regions were heavily dependent on the housing and construction industries during the Boom and have struggled since.
Therefore, when constructing your own local jobs forecast, the types of jobs available are significant to the job market’s rate of growth. This information is available from California’s Employment Development Department.
Related article: