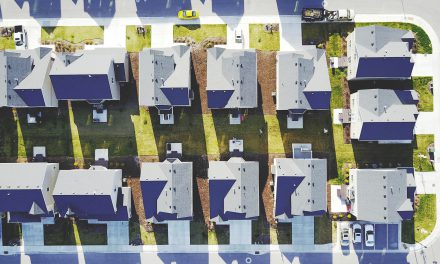
35,536 new and resale homes closed escrow in California during May 2011, down 13% from one year ago when 40,965 sales closed escrow. Home sales rose slightly from their April 2011 numbers in both Northern and Southern California. Little overall change from 2010’s numbers is expected through the end of 2012.
Thus far this year, home prices have risen and fallen from quarter to quarter, but show no sign of any sustainable recovery. This state of stasis will continue until California employment and homebuyer confidence improve. Both employment and confidence are forecast to recover much of their lost strength over the next two years.[For more on homebuyer confidence, see first tuesday’s Market Chart, Trends in homebuyer expectations; for more on California employment, see the Market Chart, Jobs move real estate.]
In the absence of consistently strong new employment and homebuyer confidence, interest rates and low home prices are the sole drivers of real estate sales (with help from aggressive agents). Low rates and low prices are likely to spark a rise in sales volume later this year, but any significant increase in sales volume will lead to a corresponding rise in interest rates. [For more on the influence of rates on home sales, see the first tuesday Market Chart, Buyer Purchasing Power.]
Real estate owned (REO) resales accounted for an estimated 40% of all sales in the first quarter of 2011— virtually unchanged from 40% one year earlier. This high proportion of REOs is expected to remain a constant for another three or four years. [For our most current data on REOs statewide, see the first tuesday Market Chart, REO Resales.]
Absentee homebuyers (a group generally composed of speculators and investors) accounted for 25% of Southern California (SoCal) sales and 22% in the Bay Area, remaining almost unchanged from April, and near the historic records of 26% and 23%, respectively, set in February 2011.
“Jumbo loans” (represented by DataQuick as loans over the old conforming limit of $417,000) accounted for 17% of sales in SoCal, virtually unchanged from one year earlier, and 32% of Bay Area sales, slipping slightly from 35% last year. 2010 saw a sharp rise over 2009 in the use of Jumbo loans, likely attributable to an increase in foreclosures among high-tier properties, but Jumbo use remains far below its height in the boom times of 2006 and 2007.
Federal Housing Administration (FHA)-insured loans made up 34% of SoCal mortgages recorded, a rise from 33% in April, but down from 36% one year earlier. FHA-insured loans made up 28% of Bay Area mortgages, a rise from 24% recorded one year earlier. first tuesday forecasts this percentage will drop in the future, as other government agencies and private mortgage insurers now guarantee almost all conventional loans, including loans with lower down payments and down payments from unconventional sources (such as gifts). The combined rate of interest and private mortgage insurance (PMI) is currently lower than the combined rate of FHA insured loans, making the latter less appealing.
Adjustable rate mortgages (ARMs) made up 9% of all SoCal mortgages, relatively unchanged from last month, but up significantly from last year’s level of 7%. ARM use in the Bay Area has increased even more dramatically in recent months, rising from 13% one year ago to a current 16%, the highest ARMs rate since October 2010. This rise in ARM use should be watched, and is cause for alarm if it continues, as an excessively high ratio of ARMS to FRMs in a low-interest rate market poses a risk of driving property prices to artificially heights. [For more information on ARMs in the real estate market, see the first tuesday Market Chart, The iron grip of ARMs in California real estate.]
Editor’s note — Wall Street investors have also begun to purchase Jumbo ARMs in the Bay Area for resale in the mortgage backed bonds (MBB) market. The MBB market for jumbos has been dormant for three years. This small opening will make it easier for sellers of high-tier property in the Bay Area to get a higher price.
Cash purchases represented 29% of Southern California and 28% of Bay Area sales in May 2011. Although these numbers are down slightly from February 2011’s record high, they remain abnormally high in both districts, indicating speculators are still at work, probably flipping under land sales contracts or let-to-buy arrangements called lease-option sales, which go unrecorded. These transactions remain, for the most part, invisible to the public.
The ongoing spike in cash purchases indicates that speculators are still optimistic about a potential recovery in real estate sales volume and pricing, but both have slipped since late 2010; not a good sign for speculators, who require very high profits to be successful.
first tuesday take: In the end, signs point to a continued vacillation in both home sales volume and pricing; the norm for at least two more years. Home pricing, especially, is unlikely to show any noticeable improvement without support from employment. [For more on current home pricing, see the first tuesday Market Chart, California tiered home pricing.]
Even after 2013, expect price increases to be modest. If the historical trends at the end of the Great Depression in the 1940s are any guide, prices are not likely to rise at a rate faster than the rate of inflation indicated in the Consumer Price Index (CPI). [For the most current CPI in Los Angeles, San Francisco, and San Diego, see the first tuesday Market Charts feature, Current market rates.]
For more extensive history and analysis of monthly and annual home sales in California, see the first tuesday Market Chart, Home Sales Volume and Price Peaks.
Re: “California May Home Sales” from MDA Dataquick