
The flood of real estate transactions and price inflation caused by excessive speculation during the mid-2000 Millennium Boom infamously helped trigger the 2008 housing market crash (the other primary contributor was the financial accelerator effect on prices fueled by Wall Street bankers).
Now, eight years on, speculators and flippers are making a small comeback — but not in California.
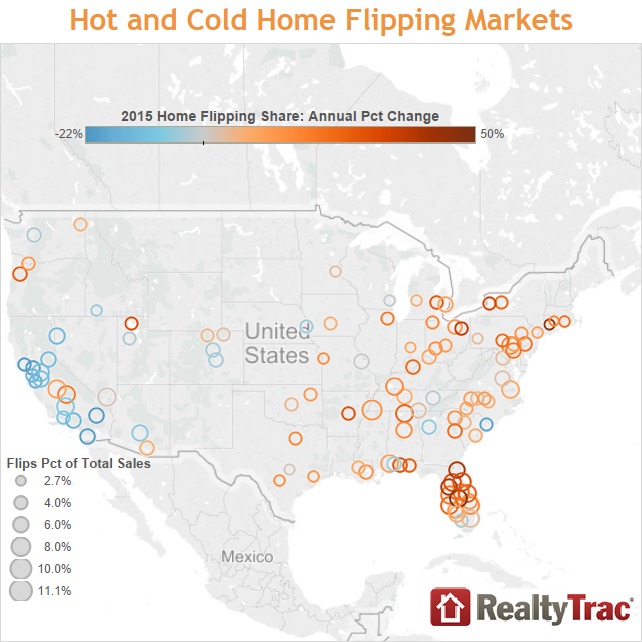
The majority of California’s metro areas witnessed an 8-12% decrease in single family residences (SFRs) and condos bought and resold — flipped — within 12 months by speculators from 2014 to 2015, according to a report by RealtyTrac. Total home sales for California in 2015 saw a 9% increase. Thus, the number of speculators active in the 2014 and 2015 California market slipped.
Meanwhile, the rest of the country saw a notable rise in the number of flipped homes — broadly defined in the report as a property sold in an arms-length transaction twice in a 12-month period.
Speculators resold — flipped within 12 months of purchase — nearly 180,000 residences nationwide last year. However, the national share of flipped homes only increased from 5.3% of all residential sales in 2014 to 5.5% in 2015.
Further, the number of speculator flips in the U.S. market reached its highest point since 2007 — two years after sales volume peaked in 2005 followed by a pricing peak in 2006 — rising to 110,000. Speculators are also raking in an average of $55,000 in gross profits nationwide, the largest amount since 2005 when the average gross profit for speculators and flippers was at $58,750.
This signals a steady return of speculators to the market and a shift in flipping trends after four years of annual decreases — all while national home sales rise.
Thus, a structural mismatch exists in the market: sellers need to sell (and speculators buy) around 12 months before homebuyer occupant demand takes place. Here, sellers are leaving nearly $60,000 on the table due to their premature rush to the market, less any fixer-upper costs for the speculator’s resale to the buyer occupant.
Consider another factor: the trend in different metro areas varies depending on the economic factors in each metro’s housing market. The upsurge of flipped homes in 83 of the 110 U.S. metropolitan statistical areas occurred predominantly on the East Coast.
Only two of the 15 metropolitan areas in California saw an increase in flipped and resold homes from 2014 to 2015:
- Fresno, which increased by 11%; and
- Visalia-Porterville, with a 21% increase.
California speculation
Why are speculation trends so drastically different in California than in the remainder of the U.S.?
The simple answer: speculators have had their fill of California real estate, or they see the future confronting them in California and are strategically retreating. The current national trends were preceded by increased speculation in California. Here, speculators ravaged the real estate sales market from 2012 to 2013 by their acquisitions. Speculators are now in a slow exodus that began in 2014, selling California properties and shifting focus to other markets ripe with opportunities to profit on a flip within 12 months.
For speculators, the 2015 data portrays California’s market as lacking the momentum requisite for a speculator feeding frenzy which is emerging in other states. In fact, California is merely returning to a more regular share of absentee homebuyers as it recovers from its most recent 2013 peak in speculator aggression.
Nonetheless, the effects of speculation continue to ripple through the market — a noticeable trend real estate agents are familiar with. Last month, 68% of our polled readers said they believe California is still experiencing a speculator-driven bubble.
Reader votes indicate the remnants of speculator activity still have a firm hold on the real estate market. Predictably, the recent past wave of speculation drove prices up. Their effect continues today as resales from 2013 acquisitions are set at prices geared to profit, exacerbated by other market factors like ever-increasing demand, totally insufficient housing starts and lowered mortgage rates.
The recent nationwide data itself reveals some of the market residue left in California by speculation: despite the year-over-year decreases, some local markets still experience relatively high numbers of flipped homes when compared to the levels preceding the 2008 speculator surge. San Diego, in particular, was among the 12 metro areas with the number of bought and resold homes exceeding the 2005 levels, now 4% higher.
Thus, California is waving goodbye to speculators — for now. Importantly, the slow exodus underway is likely to accelerate since sales volume increases, which bring on price increases, peaked in Q3 2015 and fell below 2015 numbers in April 2016. Home prices in California will most likely dip below one year prior by the end of 2016 in spite of very inadequate housing starts and slipping mortgage rates.
Are we in another bubble?
Excessive speculator activity becomes a problem when buyer-occupants are pushed out of the market, typically occurring when a recovery has matured into boom times. However, the recent speculator data is not the bad omen it appears to be for a real estate market still in a recovery mode.
The report indicates speculation trends of buying and flipping are increasing nationally — a potential disaster for the housing market when it is not in a recession. However, today’s dropping home sales volume and increasing home prices will keep speculation relatively low in California for a couple of years. When mortgage rates rise — likely in 2017 — prices and sales volume will dwindle further to discourage speculators.
The next speculator-driven bubble won’t likely occur for a few years, around 2019-2021 when first-time homebuyer demand finally takes hold and Baby Boomers begin their delayed retirement. As sales momentum builds, expect speculators to try their hand at market exploitation again, to profit from the run-up in home prices.


TOP NOTCH stuff – you continue to research and write….agree…!!!