
Single family residential (SFR) starts rose 7% over one year earlier in the six-month phase ending July 2016. Multi-family construction starts have decelerated somewhat, and have actually decreased 16% from a year ago.
Despite multi-family’s down performance in 2016, demand for multi-family rentals has generally been higher during this residential construction recovery compared to new SFRs. However, buyer-occupant demand for SFRs is gradually increasing as jobs are recovered.
SFR construction reports showed a 14% increase in 2015 over 2014. Homeowner vacancies are currently level with their historical average, thus SFR construction will have to increase to meet any future rise in demand. Expect SFR construction to continue to rise in 2016, though the increase will be dampened by rising mortgage rates beginning in late 2016.
Likewise, multi-family construction reports showed a 21% increase in 2015 over 2014, driven by the continued demand for rentals. A similar 20% year-over-year rise will likely continue into 2016.
Updated August 26, 2016. Original copy posted November, 2012.
Chart 1
This chart illustrates the number of California residential construction starts during bi-annual periods ending in July and January.

Chart update 08/26/16
| Six-month period ending | Jul 2016 | Jan 2016 | Jul 2015 |
| SFR Starts | 25,800 | 19,800 | 24,200 |
| Multi-family Starts | 23,800 | 24,800 |
28,400
|
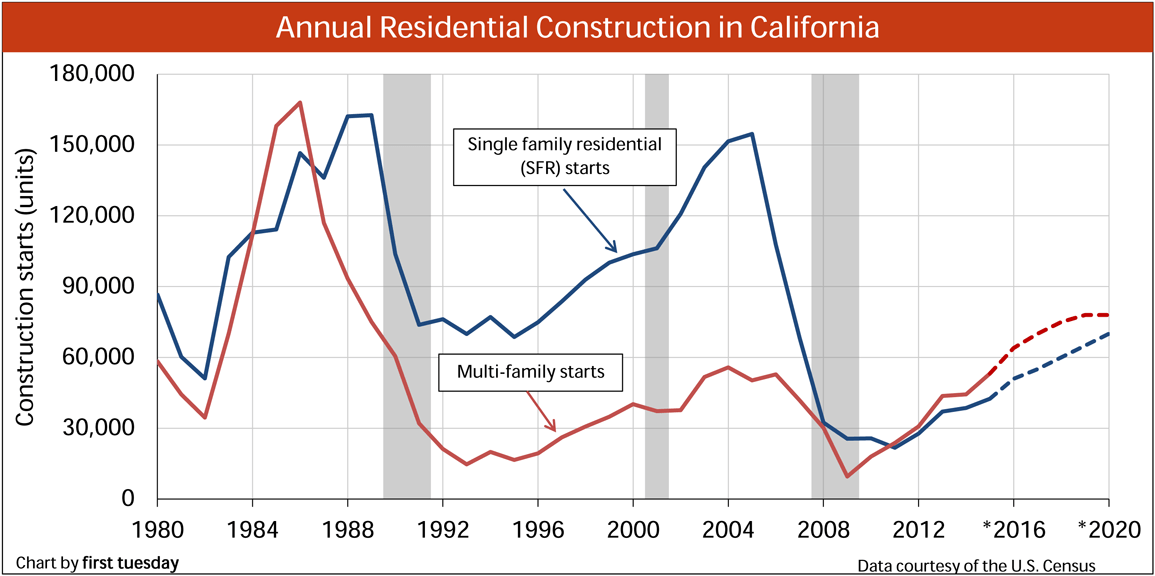
Chart update 02/05/16
| 2016 forecast | 2015 | 2014 | 2005 peak | |
| SFR Starts |
48,500
|
44,132
|
38,600
|
154,700 |
| Multi-family Starts |
64,200
|
53,479
|
44,300
|
50,300
|
*Forecasts are made by first tuesday and are based on current new home sale trends, actual construction starts and current government policies. Detached single family residential construction trends in California:
- 25,800 SFR starts took place in the six-month period ending July 2016. This is up 7% from the same period one year earlier, amounting to an increase of 1,800 starts.
- 44,100 SFR starts took place in 2015. This is up 14%, or 5,500 starts, from 2014.
- The trend in the total number of SFR starts in 2016 is expected to be a slight rise of about 10%.
- For perspective, this cycle’s peak year in SFR starts was 2005 with 155,000 starts. The lowest year was 2009 with 25,000 starts.
- Final reports issued for new subdivisions by the California Bureau of Real Estate (CalBRE) have remained constant for several years, roughly level during the past 12 months.
Detached SFR forecast:
- first tuesday‘s forecast for total SFR starts in 2016 is 48,500. This is 10% higher than 2015.
- SFR starts will begin to rise more noticeably in 2016, slowing in the second half after mortgage rates rise.
- Subdivision final reports will continue strong as developers continue to sense a return of home buyers is on the horizon.
- The next peak in SFR starts will likely occur during the boomlet period of 2020-2021.
Multi-family housing construction trends:
- 23,800 multi-family housing starts took place in the six-month period ending July 2016. This is a decrease of 4,600 starts or 17% from the same period one year earlier, a reversal of the generally positive trend experienced in multi-family starts since the end of the recession.
- 53,500 multi-family housing starts took place in 2015. This was up 21% from 2014.
- For perspective, this cycle’s peak year in multi-family housing starts was 2004 with 61,500 starts. The lowest year was 2009 with 11,000 multi-family housing starts.
Multi-family housing forecast:
- first tuesday‘s forecast for total multi-family housing starts in 2016 is 64,200. This is a 20% increase from 2015.
- Multi-family housing starts will continue increasing at an annual pace of roughly 20% throughout 2016.
- The next peak year for multi-family housing starts is likely to be 2020.
Statistics related to California housing:
- 6,851,400 owner-occupied housing units existed in California in 2014, according to the U.S. Census Bureau. This is an increase of 1% over the prior year.
- California population growth is increasing at a rate of just below 1% per year, having bottomed at the height of the Millennium Boom and trending upward slightly since then.
- 16.3 million people were employed in California in July 2016. This is 781,500 jobs above the pre-recession peak month of December 2007, according to the California Employment Development Department (EDD), yet to catch up with the 1.2 million increase in working-aged population.
- The trough month for employment was January 2010, with 13,686,400 people employed state-wide.
- The rental vacancy rate in mid-2015 was 4.2%.
Construction starts will continue to rise through 2019, at least. The pace of this rise is dependent on several factors, discussed below.
Related articles: Nobody’s home: California’ residential vacancy rates Golden state population trends
Key factors for builders
How do builders decide when and where to build? Builders analyze existing home sales, end user demand and local employment. Together, an analysis of these and ancillary factors produces a prediction of future construction trends.
End user demand drives sales
End user homebuyer-occupant demand will ultimately determine whether and how fast construction starts for SFRs and condos will continue to climb. Currently, speculator acquisitions at less than 25% of ownership turnover — while significant to interfere — no longer dominate California’s home sales volume. This intervention subsided through 2015 and will continue at an even lower rate in 2016. As prices slip in 2017, expect speculators to return to grab up properties in anticipation of continuous price rises into 2019-2021.
However, builders rely upon buyer-occupants to support new home construction, deliberately culling out speculators as buyers in staged tract developments and slow selling projects. Buyer-occupant demand to purchase a home in 2016 remains stunted. This is demonstrated by relatively low sales volume participation and mortgage origination figures. Builders will continue to bide their time until sales volume figures for buyer-occupants pick up, likely in 2018 as prices begin to rise again.
Employment drives demand
When speculators interfere, home sales volume and pricing display a distorted picture of demand. However, builders need to look to jobs data and mortgage rates as the primary impetus for demand when they set the level of starts that will likely sell.
California has finally recovered all jobs lost in the Great Recession but at wages which do not cover the interim inflation. Still, considering the intervening population gain (around 3,000,000), full employment and labor force participation comparable to the December 2007 peak is not expected to be reached until 2019.
Obstacles facing SFR builders
Obstacles of concern to future construction starts include:
- speculators and syndicators dumping the fast building shadow inventory of their circa-2012-2014 acquisitions back on the market;
- slipping rent rates in the suburbs, weakening in concentric circles from the coast, due to competition by absentee owners for SFR tenants;
- rising mortgage rates — ARMs first, then FRMs later — reducing homebuyer borrowing capacity before completion;
- leased-out urban condo projects built but yet-to-be-sold due to the Great Recession, part of the shadow inventory builders have to watch out for in 2018-2020;
- an upturn in foreclosures/REO resales and bankruptcies to re-occur after mortgage rates begin a sustained rise, likely in late-2016 into 2017 as part of the home sales price downturn in the current price bump cycle; and
- California’s 490,000 negative equity (underwater) homes inhibiting turnover as of Q2 2015, which will increase in numbers with the downturn in home prices in 2017.
Until these factors are considered and a conclusion reached, builders (and their lenders) may not take for granted that construction starts will pay off. Expect starts to only modestly increase until these factors collectively improve, around 2018.
Related article:


