
Just 18,450 new and resale home transactions closed escrow in California during February 2024. Nonetheless, home sales volume was up 13% from the prior month, and up 8% from a year earlier.
While sales volume year-to-date (YTD) is 8% above a year ago, compared to 2019 — the last year before pandemic volatility took over — sales volume YTD in January 2024 is 33% lower.
Annual home sales in 2023 experienced a 22% decrease from 2022. More critically, sales volume in 2023 was 30% below 2019 — the last year to experience a typical seasonal sales cycle.
During 2021, historically low interest rates and buyer fear of missing out (FOMO) escalated housing market sales activity, cannibalizing future sales while inflating prices. With the pandemic fuel depleted, sales volume collapsed in early 2022. Absent this momentum, sales volume peaked early in March 2022, this volatility now being repeated in 2024.
2023 was a year of overall weakening for California home sales volume as the supply of homebuyers was exhausted during the pandemic buying spree. Other buyers know the math and will only buy when prices stop dropping.
Watch for home sales volume to continue trailing in 2024. Without the support of a steady rush of home sales, home prices have resumed their decline, causing recent mortgaged homebuyers to dive underwater. Expect a return of real estate speculators by 2025 to provide a “dead cat” bounce during the ongoing sales slump, with a sustainable recovery taking off with the return of end user homebuyers around 2026-2027.
Updated February 27, 2024. Original copy posted March 2009.
Chart 1
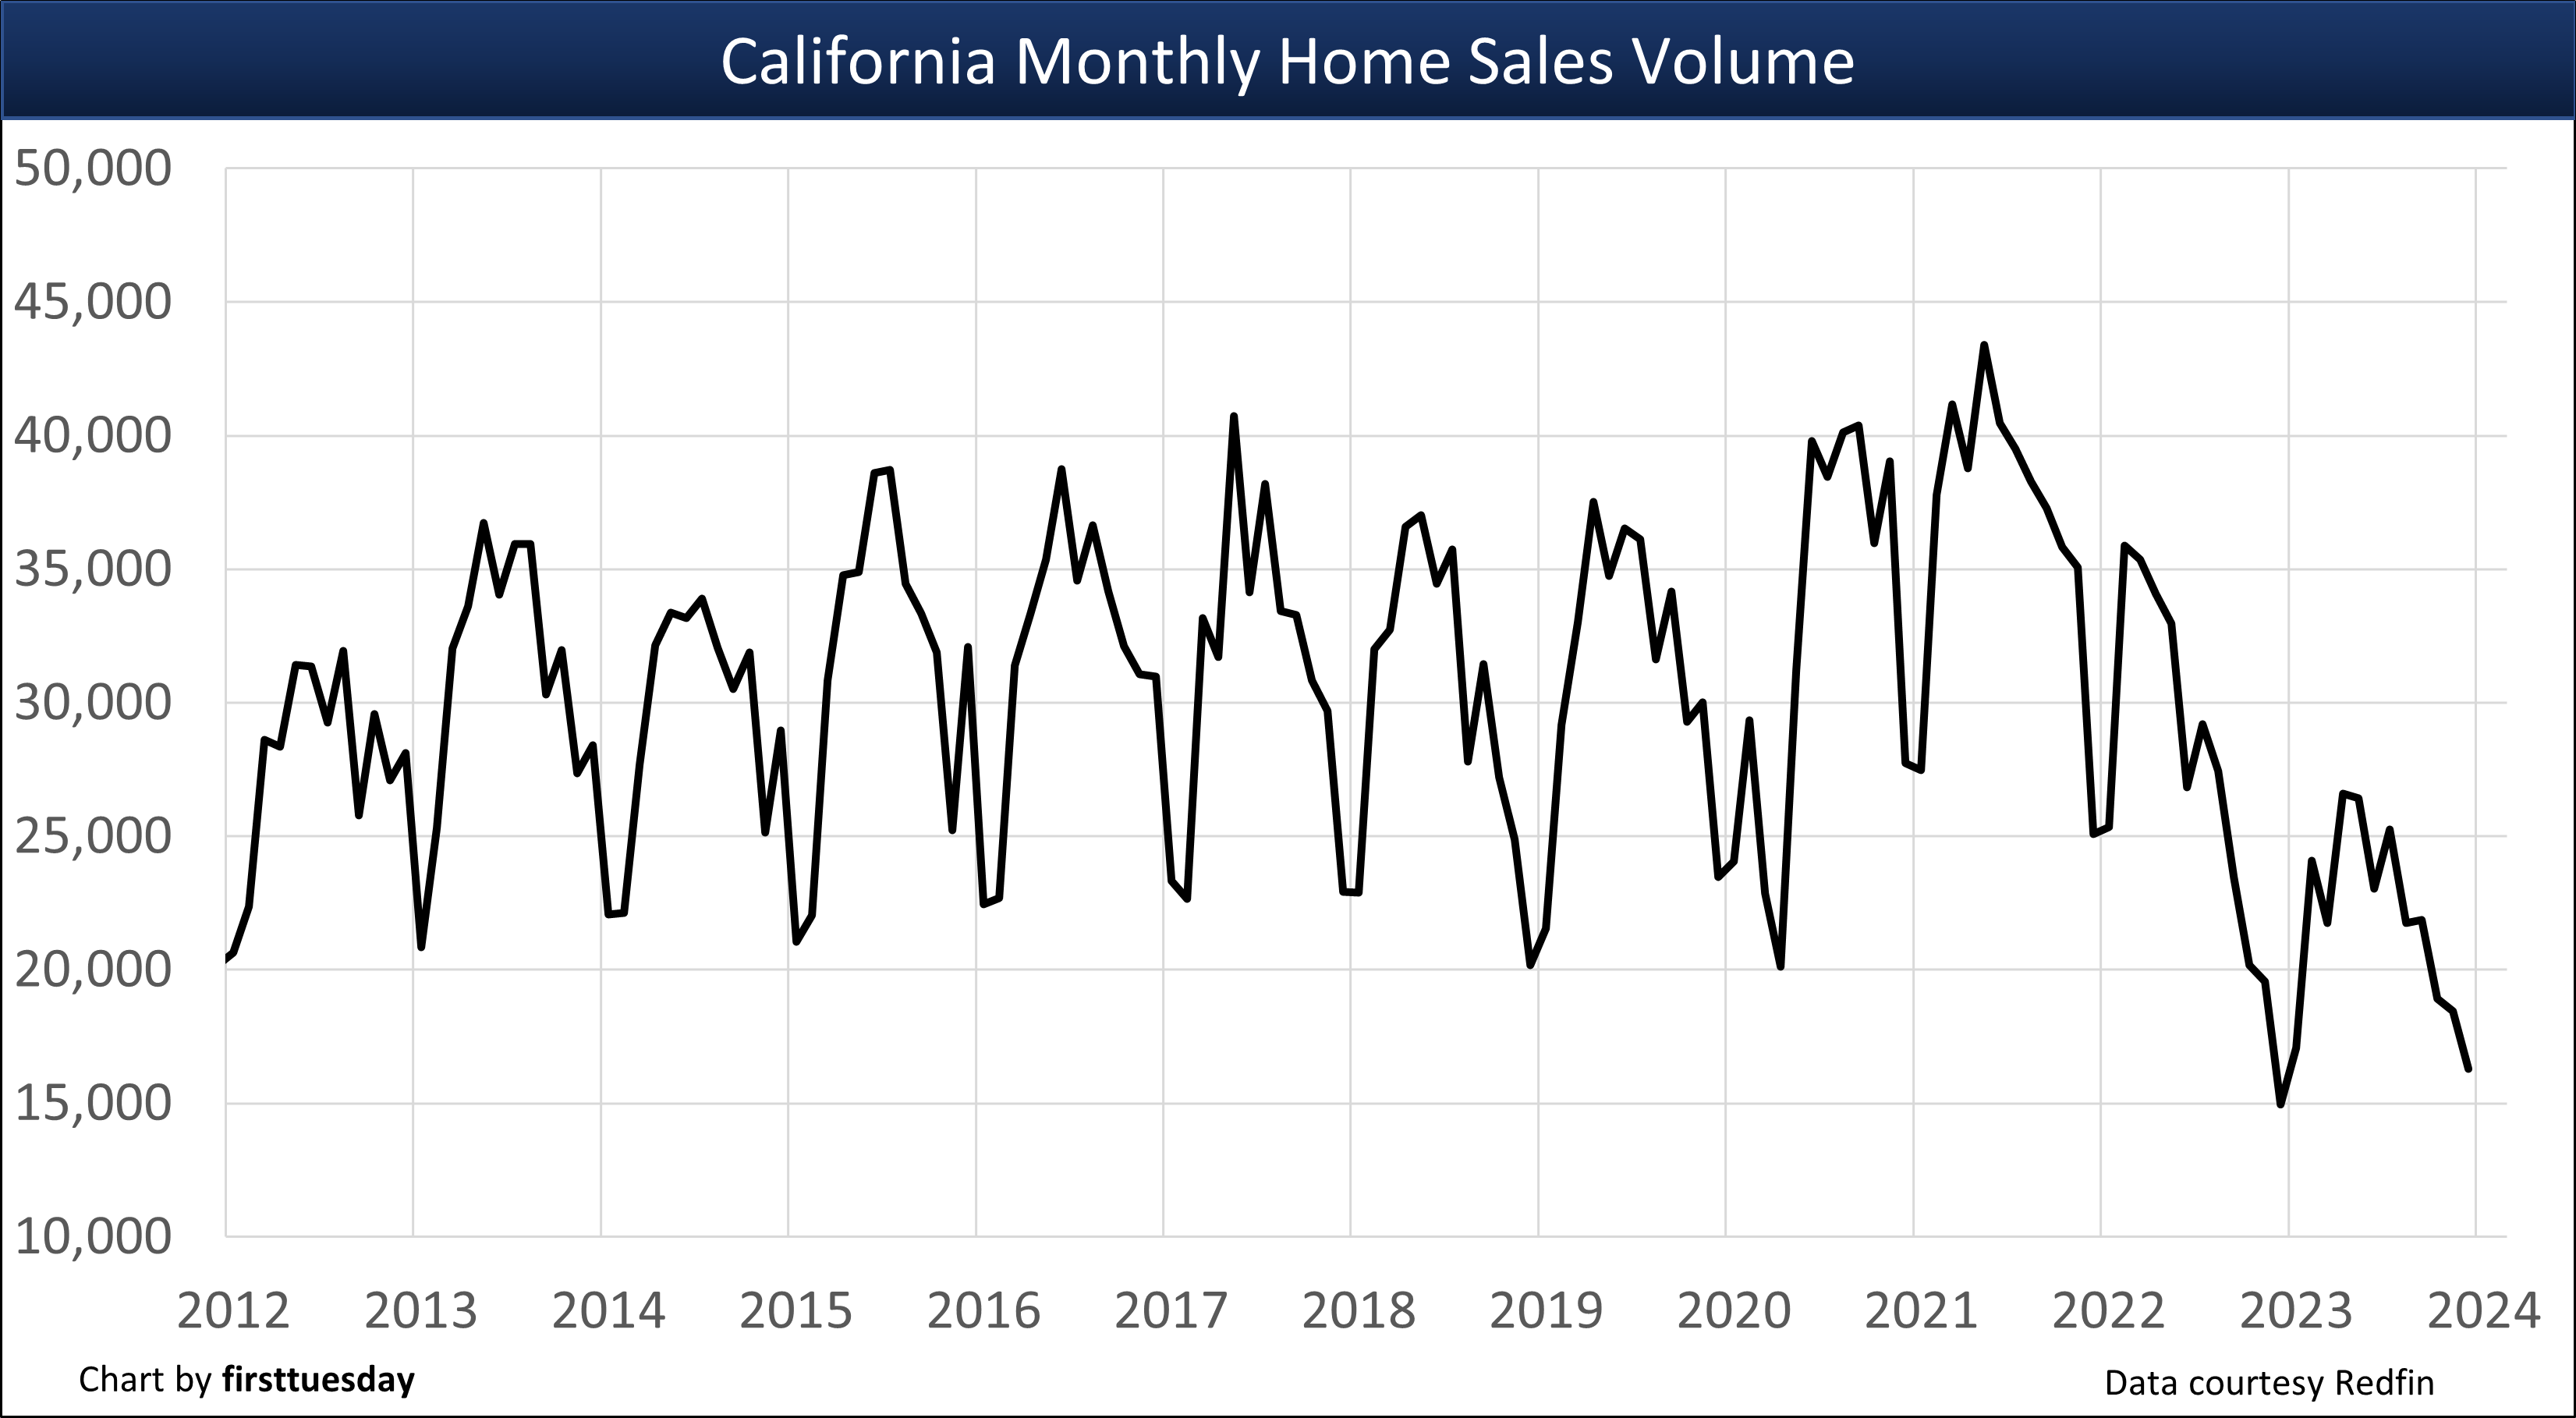
Chart update 03/25/24
Feb 2024 | Feb 2023 | YoY change | |
| California home sales volume | 18,450 | 17,066 | +8% |
Home sales vary from month-to-month for a variety of reasons, most significant being homebuyer demand. This demand is influenced by several factors constantly at work in California’s homebuying market, including:
- seasonal differences [see Chart 2];
- changes in home prices;
- mortgage interest rates;
- consumer confidence;
- the presence of investors and real estate speculators in the market;
- negative equity status;
- the quantity and quality of jobs held by homebuyers; and
- homebuyer saving rates.
Seasonal differences in annual sales volume
It’s normal for home sales volume to rise in the first half of the year and fall after June, generally speaking.
Chart 2
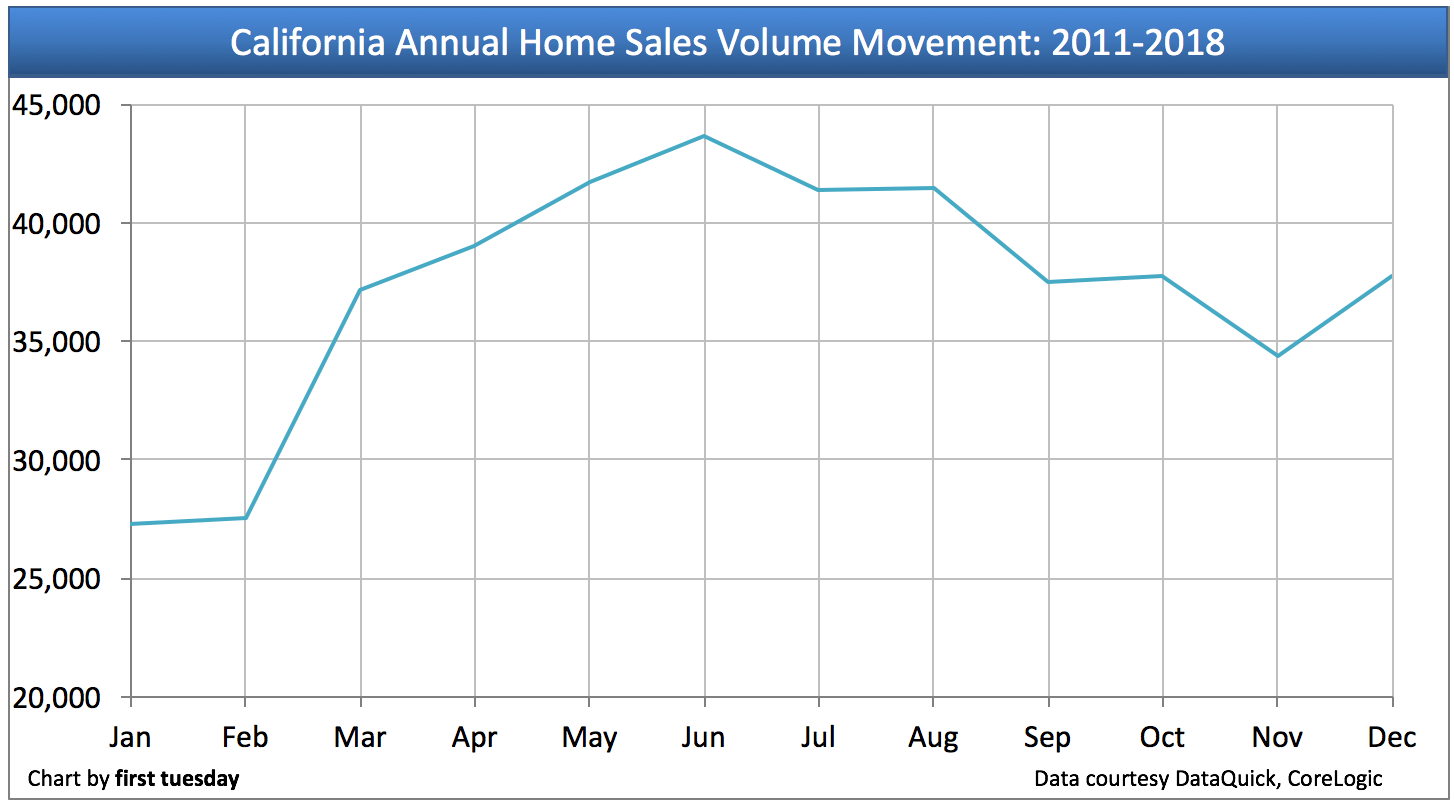
Chart update 02/02/19
Chart 2 shows average home sales as experienced from 2011-2018. As depicted, the most homes are regularly sold each year in June. Another small increase takes place in December, as homebuyers seek to wrap up their financial activities before the end of the year.
Therefore, real estate professionals are not to worry when they hear of falling sales volume in the latter half of the year. This is a normal seasonal progression. What to watch for is year-over sales comparing a month or other period (such as year-to-date) this year with the same month or period last year.
The ongoing recovery for home sales volume
Annual real estate sales numbers since the Great Recession of 2008 have been characterized by a continuing bumpy plateau in home sales volume, now experienced for over a decade. As a rule, current market action, whether up or down, is reflected first in sales volume, followed by prices, and both fluctuate from month to month mostly going in opposite directions or just standing still.
2021 was the first year to see a significant increase in annual sales volume, rising 22% over the prior year. However, 2021’s sale numbers still pale in comparison to the peak year for sales volume experienced in 2005, 29% below this peak year.
Chart 3

Chart update 02/27/23
| 2023 | 2022 | Annual change | |
| Annual home sales volume | 260,064 | 335,383 | -22% |
To set the stage for a forward look, a review of sales volume in the recent past is helpful:
- Mid-2005 saw sales volume peak for all types of real estate in California, with nearly 754,000 homes sold that year;
- Nearly 30% fewer sales were recorded in 2006 than in 2005, while sales dropped an additional 30% in 2007;
- sales bottomed in 2008 and were artificially inflated in 2009 due to subsidy-induced purchases and speculators jumping on the momentum, but remained 40% below 2005;
- 2010 saw a decline from the year earlier in both sales volume and prices;
- 2011 increased slightly in sales volume while decreasing in sales prices, a normal price adjustment condition;
- 2012 saw sales volume increase marginally and home prices jump significantly by year’s end, supported primarily by massive speculation;
- 2013 home sales volume stagnated, while home prices continued to increase rapidly, not a good sign for the immediate future; and
- 2014 saw home sales volume decrease throughout the year, ending the year 7% below 2013.
- 2015 ended 9% higher than 2014 — in other words, just about level with 2013. [See Chart 4]
- 2016 and 2017 sales volume continued a flat trend in sales which began in 2015;
- 2018 saw sales volume decrease rapidly in the fourth quarter, ending the year 4% below 2017;
- 2019 home sales volume decreased slightly from the prior year; and
- 2020 home sales were extremely volatile, dropping as much as 30% mid-year, but bouncing back sufficiently enough by Q3 and Q4 to make up for the loss, ending 2020 roughly level with 2019.
- 2021 home sales volume rose 22% over the prior year, spurred on by low interest rates and buyer fear-of-missing-out (FOMO) following a year of pandemic-slowed sales.
- 2022 home sales lost all ground gained in 2021, ending the year 24% below 2021 and 12% below 2019, the last “normal” year for home sales before the pandemic upended traditional market dynamics.
- 2023 home sales lost a further 22% over the prior year, further wiping out the ground gained in 2021
Chart 4

Chart update 03/25/24
| Feb 2024 | Feb 2023 | Feb 2022 | |
| Home sales volume year-to-date | 34,739 | 31,975 | 49,830 |
Year-to-date (YTD) home sales volume rose slightly compared to a year prior, though still far short of the 22% annual jump in 2021. As of February 2024, YTD home sales volume is 9% above a year earlier. Compared to 2019 (the last “normal” year for housing before the Pandemic Economy took over), home sales volume YTD is 19% lower as of February 2024.
Home sales volume will continue to fall back in 2024 due to:
- lower homeowner turnover due to rising mortgage interest rates;
- reduced home inventory across the state; and
- the 2024 recession, which is as yet undeclared, but is already being felt across the housing market.
Home prices leveled off in mid-2022 and will soon fall, dragged down by significant cuts to buyer purchasing power.
When home prices fall, some California mortgaged homeowners will fall underwater. Thus, turnover by this chunk of owners will be restricted. These homeowners cannot sell and relocate to purchase another home because their homes are worth less than the debt encumbering them. To rid themselves of the home and the debt, they have to endure damaged credit resulting from a short sale or foreclosure. The desire to avoid this embarrassment takes most of these 3.2% homeowners out of the home buying market for years.
Home sales in the coming years
The forward trend in California home sales is mixed for both buyers and seller. Homebuyer income is going further and doing more than anytime during the past 15 years due to increased borrowing capacity brought on by low interest rates, at historic lows in May 2020.
first tuesday forecasts home sales volume will languish in 2020-2021, the result of an unstable jobs market. The peak sales volume last seen in 2004, inflated by speculator acquisitions and excessive mortgage money, is unlikely to return for decades, when interest rates cyclically peak.
Relocating Baby Boomers going into retirement in the coming years will be the primary propelling force in both selling homes and buying replacements. Their Generation Y (Gen Y) children will add to the sales volume at the same time as they find jobs at better pay levels and become first-time homebuyers. Gen Y influence will peak in sales volume at the end of this decade as they complete their shift from renting to owning.
Once California’s job market rebounds from the current recession, their confidence about the future will improve. They will once again be willing to invest in the economy since the expectations for tomorrow are projections based on yesterday’s most recent experience. Only then will occupying homebuyers – end users – return in sufficient numbers for sales volume to swell significantly.
Trends to be concerned about
Many long-term unfavorable market conditions restrain the rise of home sales volume:
- the weakest homebuyer demographics in 15 years;
- failed savings for a down payment as high rents squeeze potential first-time homebuyers out of saving;
- buyer borrowing power no longer enlarging the funds they can borrow as interest rates inevitably rise, reducing funding for purchase-assist financing and dampening property prices;
- the public’s increasingly anti-business and pessimistic attitude about American economics, wealth inequality and national politics no matter the outcomes; and
- tightened loan standards as lenders are forced to apply forgotten fundamentals of sound mortgage lending practices (20% down payment on non-FHA/private mortgage insured loans, lower income ratios, risk-free credit scores and full documentation of income, funds and collateral value).
The competitive broker
What’s a broker to do until home sales volume takes off?
SFR brokers and agents might consider adding SFR-related services to supplement their income. Those who do add related services will restructure their practice as “all-service brokers.” Transaction-related services will be integrated into their office operations to maintain solvency and grow.
Related article:
These services include:
- escrowing their in-house transactions under the broker’s license;
- entering into or expanding property management services;
- negotiating equity purchases for investors from underwater owners on the chance of a short sale discount or who have a positive equity;
- specializing in sales and leasing of a particular type of commercial property, other branch office locations and alternative marketing approaches (aside from social media);
- providing mortgage loan broker services for business-investor loans made by private lenders and secured by the borrower’s residence (no mortgage loan origination (MLO) endorsement required);
- arranging carryback financing and the take over/assumption of existing mortgages, and buying and selling those carryback trust deed notes;
- negotiating options to buy, or lease with option to buy when inventories expand as the shadow inventory of speculators returns to be sold;
- exchanging properties with equity to help owners relocate their wealth held in real estate tax free; or
- using barter credits in lieu of greenbacks, etc.
Prudent brokers will insist their prospective buyers commit to exclusive representations by the broker and agent to locate a home (or other property). By signing an exclusive right-to-buy listing agreement, buyers commit to employ brokers and agents just as sellers commit to employ brokers and agents, the obverse side of the same employment coin. This will ensure time spent with a buyer produces a closing and a fee.


Can you be any more specific about the effect of rising interest rates on prices ‘expected’ in 2016? In other words buying now in 2015 would one expect to be underwater in a few years depending on the change in rates?
Ann,
Thank you for your inquiry! Historically speaking, when mortgage rates rise homebuyers become discouraged and sales volume declines, usually within six months. As sales volume falls back, home prices likewise fall within the following 9-12 months. Therefore, first tuesday expects pricing to decline in 2017.
However, to answer your question about underwater homes, prices aren’t expected to fall very far in 2017, nor will they be down for long. Economic action is pointing towards a solid recovery beginning in 2018, and by that point we will likely be heading into our next housing boom, expected to occur in 2019-2021. Therefore, if a home goes underwater due to decreased home prices in 2017, it will likely regain positive equity quickly.
Please read more about the anticipated rise in mortgage rates here: Why fixed mortgage rates won’t rise (yet), despite Fed action. You may also read specifics about our forecast for the real estate market here: California real estate almanac: past and future.
Regards,
ft Editorial
Are there any granular data regarding shadow inventory? How much percentage are true speculator or flippers, and how much are for parking their money as safe investment comparing to their home country, ie. China? What about the institutional purchase of foreclosure properties? do they rent out those properties, or resell at a later time,? These unknown forces have disrupted California real estate market for the last few years and partially blame for inflating home prices.
Dave,
CoreLogic provides information on the percentage of absentee buyers and real estate owned (REO) properties.
CoreLogic also provides data on shadow inventory occasionally. To the best of our knowledge, their latest report is here: A new source of shadow inventory.
For information on investors from China, please see our article: Chinese stock market crash motivates investors: true or false?
To read more broadly about foreign investors in California’s real estate market, see: The global economy’s effect on local real estate.
Thank you for your question!
ft Editorial Staff
Does the analysis reflect any concern for the impact the California drought may have on housing activity / home prices over the next several years?
Can’t believe that we are in the worst threatening situation in the state’s history and this article refuses to recognize that buyers will not purchase a home if:
They have much higher water bills
Water restrictions
Water penalties
Water brown outs
or no water at all
What is the world does the author think is happening all over the state. There is only one last chance and that is El Nino this winter. If that doesn’t yield mega results in rain and snow, then all bets are off and so is California because it most likely is in a mega drought.
I’ve thought about the drought effect…and I’m torn between two scenarios: One, the state will suffer economically, and eventually have a negative impact on real estate prices. Two, cities will heavily restrict growth because of our severe drought. Scenario 2, to me, is the most likely, and that would DECREASE inventory compared to population growth leading to even higher R/E prices. While it is true that water is a tremendous issue, I see people willing to let their lawns go completely dead and perhaps skip showers to live here in Southern Cal…it’s crazy, and it probably always will be. Then again, there was the collapse of 2008. Who is sage enough to figure this out?
WRONG!
Absolutely wrong analysis. I have been a broker
for 34 years in Los Angeles. This post is so far removed
from reality I could write a book tearing it apart.
Why don’t you people give up forecasting real estate prices ?
You have NEVER BEEN RIGHT. NEVER.
AGREED.
So what is your forecast ?
Thank you for this informative, in depth analysis. This data is very helpful when trying to put current local market data in perspective.
Its all about location. Here in the Bay Area, housing sales are out of control once again with multiple offers and homes selling within days of listing. I’d like to see the chart for this area specifically. Of course other (inland) areas suffer massively and will continue until as you said, employment expands greatly and regularly. But there’s magic in the Bay Area and specific smaller locations.
Thank you very much for the information on house market trend as well as brokers and real estate agents fall.
stella song
You list your source as MDA DataQuick. If you will check with DataQuick, you will find they are no longer owned by MDA. It’s always nice to properly reference your sources.
It is indeed! Thanks for bringing this change to our attention. We’ll see to it that our attributions are updated accordingly.
Always great information!
Thanks much!!
My thanks to Bradley for the research and information provided in the article. Historic trends lend themselves to greater understanding of the factors involved in the movement of markets. I went straight from this article to investigate the “charts” section. Good information–leads to good insight. Susan Carter
It seems at this point that the trend was downward but since January things have picked up. When the interest rates were lowered the housing market jumped a bit and since has leveled off just as interest rates have.
ft Editorial Staff:
Thanks for the invaluable lists of important facts that will direct the business decisions of Real Estate Brokers over the coming years. All of your journals are spot-on subjects for surviving this current R. E. Cycle. But this journal gives the lists that a Broker will need when making a business plan. I am studying for my Broker’s Test now.
Sincerely, Ed Reisinger