
Sacramento County, encompassing California’s capital and cities like Elk Grove, Citrus Heights and Folsom, is home to the California Department of Real Estate (DRE). This region was one of the last counties in California to reach a jobs recovery from the 2008 recession, necessary to fuel wallets and in turn household formations. Its lagging recovery can be attributed partially to Sacramento’s dependence on state and local government jobs, which were slow to return.
This recovery was quickly followed by the 2020 recession, resulting in significant job losses and a complete erasure of the past five years of job gains. But unlike the last recovery, jobs in this region returned more quickly than other parts of the state, likely due to its reliance on government funding, which was abundant during the hangover from the 2020 recession.
In 2022, home prices began to fall back, having met resistance from rising interest rates and buyer caution. In 2023, Sacramento County will continue to see sales volume and prices decline, worsened by 2023’s deteriorating economic situation. Real estate’s next recession is here, and the time is now for real estate agents to recession-proof their careers. Home sales won’t begin a consistent recovery until around 2026-2027.
Get to know Sacramento’s local housing fundamentals in the charts that follow.
Updated August 22, 2023. Original copy posted October, 2015.
Home sales volume inches higher

Chart update 08/22/23
| 2022 | 2021 | 2019 | |
| Sacramento County home sales volume | 15,700 | 20,200 | 19,400 |
Sacramento County home sales volume has avoided much of the volatility of California’s other major metros. After years of essentially flat sales volume, home sales volume in 2021 totaled 6% higher than a year earlier. While a larger increase than prior years, all of California’s other major metros experienced much larger year-over-year leaps in sales volume during 2021, with the sales volume increasing 22% statewide.
However, sales volume quickly reversed in 2022, totaling 22% fewer sales than a year earlier in Sacramento. Compared to the last “normal” year for home sales, 2022’s home sales volume total was 19% below 2019. Thus far in 2023, sales volume year-to-date is a steeper 34% below a year earlier and 36% below 2019.
Home sales volume in Sacramento has not been as volatile as many other parts of the state. One reason is the consistent addition to the for-sale inventory, in the form of residential construction. In California’s expensive and desirable coastal cities, new construction has been held back significantly by outdated zoning laws and not-in-my-backyard (NIMBY) advocates. Not so in Sacramento, where construction is welcome and typically allows sales volume to keep pace with homebuyer demand.
Even so, home sales are expected to continue their slowdown heading into 2023, primarily due to higher interest rates and the loss of homebuyer enthusiasm. Sales volume will not stabilize until the market has worked through the presently undeclared double-dip recession and jobs begin to return consistently, expected to take shape in Sacramento around 2025.
Related article:
Inventory rises from historic lows
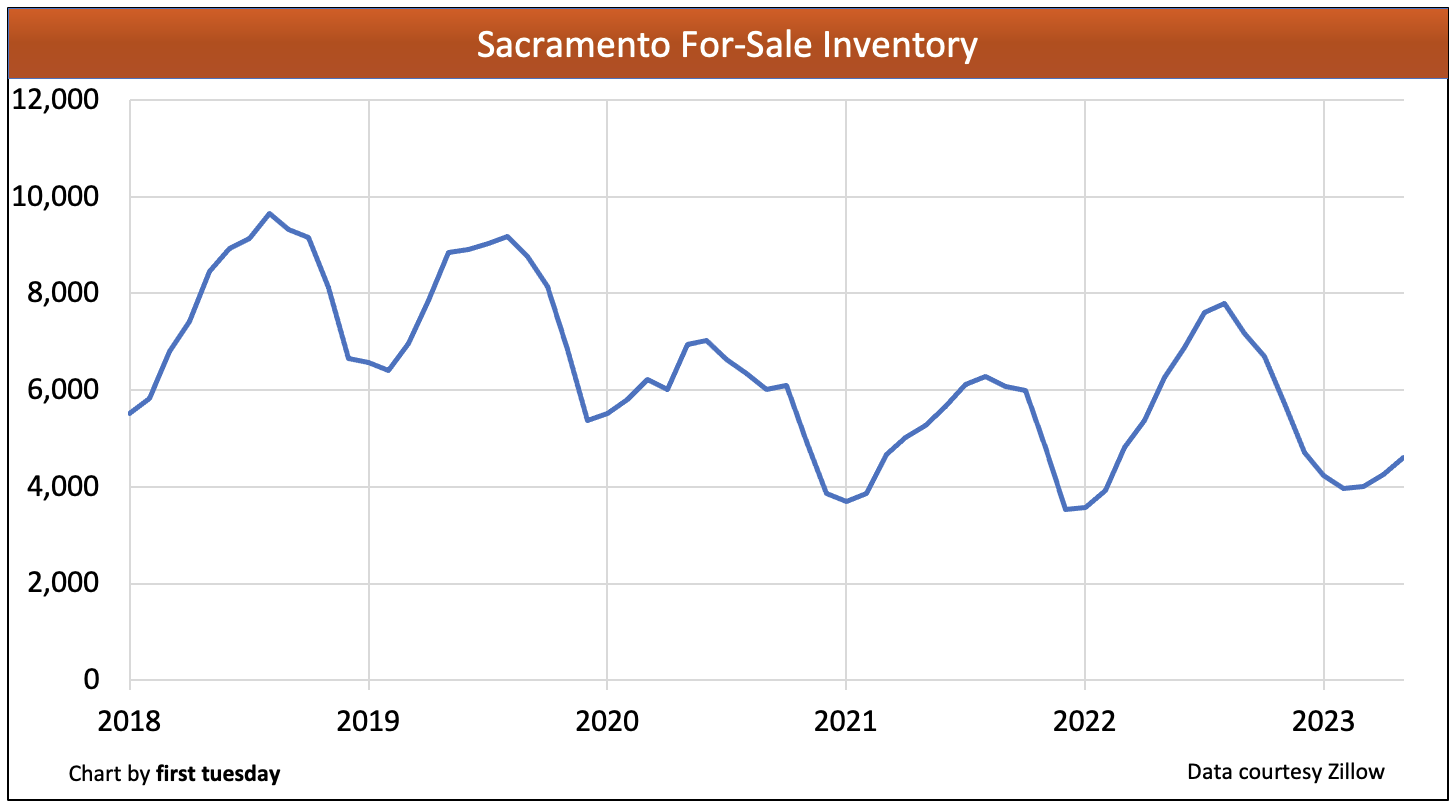
Chart update 08/22/23
| May 2023 | May 2022 | Annual change | |
| Sacramento County for-sale inventory | 4,600 | 6,300 | -27% |
Multiple listing service (MLS) inventory has bounced from the historic low reached at the end of 2021. After two years of steep decline followed by a brief bump in 2022, for-sale inventory in San Diego averaged a significant 27% below a year earlier as of May 2023. However, this most recent inventory decline is not due to excess buyer demand. Rather, today’s lower inventory is the result of seller reluctance to list in light of higher interest rates and the uncertain economic situation. The winter months typically see the lowest inventory of homes for sale, peaking around mid-year.
Lo0king forward, expect inventory to continue to climb in 2023-2024. The significant interest rate increases of 2022 slashed buyer purchasing power, making it nigh on impossible for mortgaged homebuyers to compete. Along with high inflation, the signs are pointing to a rapidly approaching downturn in the housing market — of which homebuyers and sellers are well aware. The seller’s market of the past decade has finally slid into a buyer’s market, with prices to follow heading into 2024 as inventory grows and homebuyers choose to wait out the declining market.
Homeownership buoyed by residential construction
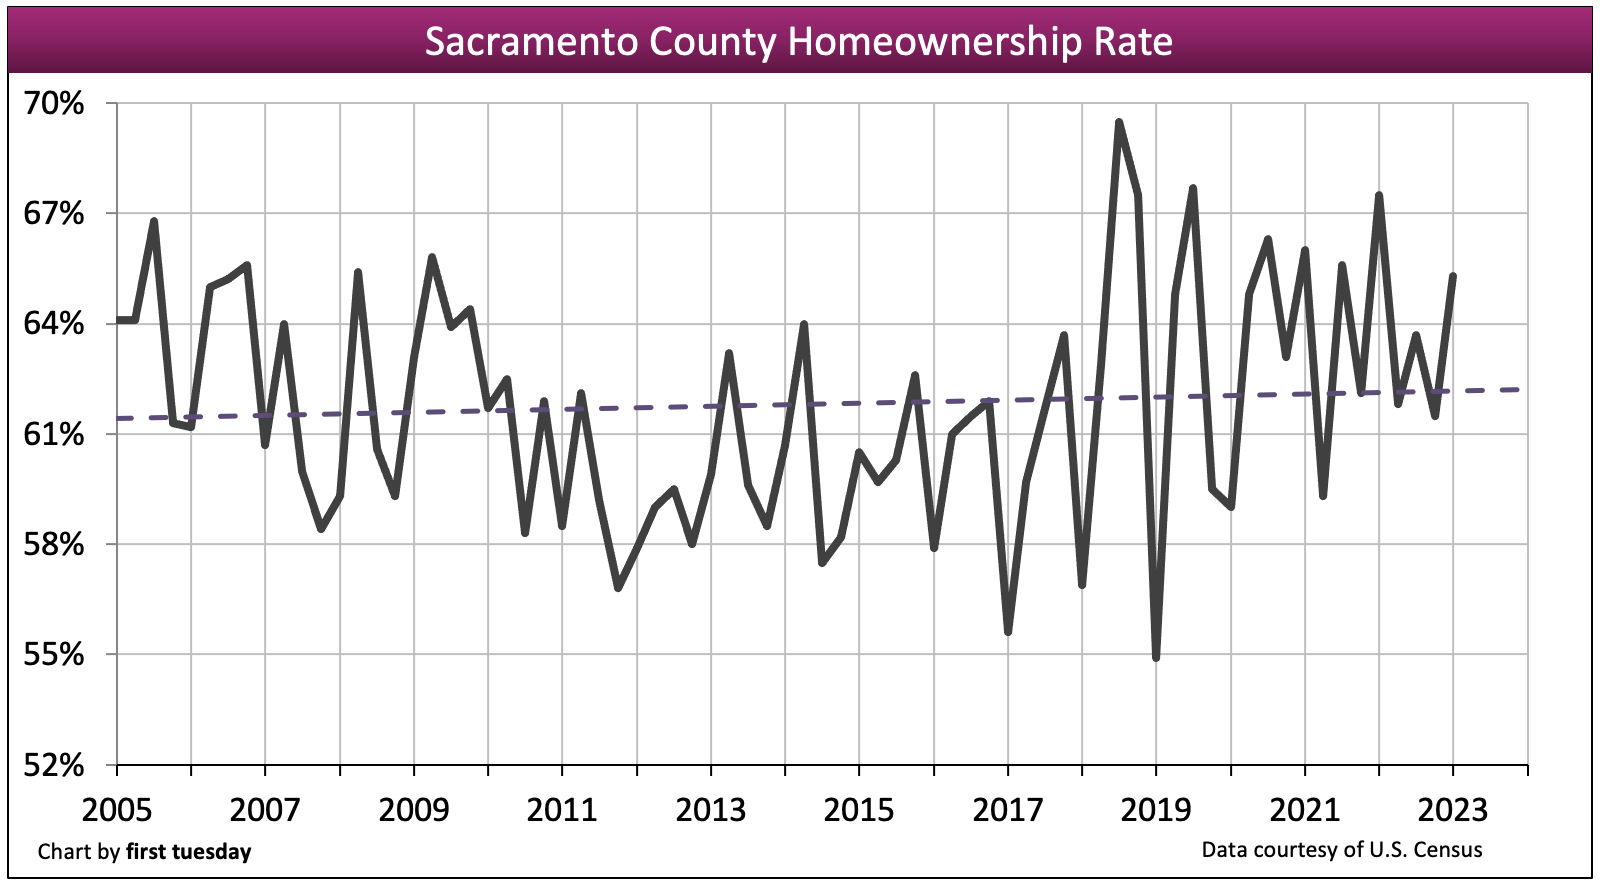
Chart update 08/22/23
| Q1 2023 | Q4 2022 | Q1 2022 | |
| Sacramento County homeownership | 65.3% | 61.5% | 67.5% |
The homeownership rate in Sacramento County varies greatly each quarter, though the general trend was flat-to-down for over a decade — until homeownership began to jump dramatically from quarter-to-quarter in 2017. As of Q1 2023, the homeownership rate is a high 65.3% in Sacramento. For comparison, the statewide average was a much lower 55.3%.
In 2022, Sacramento smashed past its homeownership record of 67%, previously set in 2005. Following the conclusion of the housing bubble when homeownership was last at its peak, many homeowners lost their homes to foreclosure. This is pictured in the swift decline in Sacramento County’s homeownership rate experienced in 2010, bottoming at 57% in 2011. Meanwhile, the rest of the state has yet to catch up to the Millennium Boom levels of homeownership, and are unlikely to bounce back for several years, if at all.
Sacramento’s high homeownership rate is the result of relatively sufficient residential construction to keep up with demand. Compared with California’s other major metros, Sacramento’s looser zoning restrictions enable construction to meet the demand of homebuyer occupants of all income levels. Still, expect Sacramento’s homeownership rate to fall back slightly in 2024, as negative economic conditions discourage homebuyers.
Turnover flat to down

Chart update 11/09/22
| 2021 | 2020 | 2019 | |
| Sacramento County homeowner turnover rate | 7.8% | 8.7% | 8.4% |
Sacramento County renter turnover rate | 16.1% | 21.9% | 23.1% |
A real estate agent’s living is contingent on residential turnover. Without it, property doesn’t sell, tenants stay put and mortgage originations go nowhere.
Owner-occupant turnover (the percentage of homeowners who moved within the last 12 months) bottomed in 2007 just as the Millennium Boom began to explode. Homeowners found the courage to move a bit more in 2008-2009 (due partially to the government stimulus that encouraged homebuying), only to fall back by mid-2010 when the stimulus ended. Since then, turnover by owner-occupants has remained steady at around 8% each year, down slightly at 7.8% in 2021.
Further, the general trend for renter turnover is also down. Renter turnover peaked in 2009 at a massive 40%. For perspective, that means two out of five renters moved in 2009 — a significant sum for California. A lot of this turnover was due to former homeowners selling (often by short sale or foreclosure) to buyers who were tenants or to investors who rented to relocating tenants. Renter turnover has fallen each year since, rebounding slightly in 2017-2019, but falling back significantly to 16.1% in 2021.
Turnover was held down in 2020-2021 as a result of the eviction and foreclosure moratoriums. Looking ahead, with the support of a healthy jobs market in the years following the 2023 recession, turnover will gradually improve.
Construction slowly rising

Chart update 02/16/23
| 2022 | 2021 | 2020 | |
| Sacramento County single family residential (SFR) starts | 3,700 | 3,900 | 4,400 |
Sacramento County multi-family starts | 1,800 | 3,000 | 1,600 |
After years of flat performance, construction in Sacramento County began to make solid gains in 2020-2021, only to fall back in 2022.
In the past couple of years, there have been several months where builders started zero new multi-family or single family residential (SFR) construction projects. This dormant situation saw an injection of new growth in 2020, as investors set their eyes on Sacramento as a city primed for residential growth. It has since fallen back, tempered by the building material and labor shortages which have characterized construction across the state.
However, even 2020’s level of construction is below what Sacramento needs to keep up with demand from homebuyers and renters alike. In fact, the peak year of 2003 saw nearly three times more SFR construction starts than the 3,900 SFR starts experienced in 2021. But multi-family construction is finally looking up, with 2020 surpassing the peak year for construction last achieved during the Millennium Boom. However, in 2022, multi-family construction fell back 13% from the prior year.
Sacramento construction is likely to continue to outpace the rest of the state in the coming years. State legislative efforts to increase the low- and mid-tier housing stock have focused on encouraging more multi-family construction and with Sacramento’s relatively low cost of living compared to other Central and Northern California metros, it has become an attractive city for many first-time homebuyers and renters looking to save and still maintain a high standard of living.
A swift jobs recovery from the 2020 recession

Chart update 08/22/23
| May 2023 | May 2022 | Annual change | |
| Sacramento County jobs | 1,093,200 | 1,049,700 | +4.1% |
Sacramento was one of the last counties in California to reach a pre-2008 recession jobs recovery. Its lagging recovery can be attributed partially to Sacramento’s dependence on state and local government jobs, which were slow to return. On the other hand, the region’s recovery from the 2020 recession occurred much more quickly, with government-funded jobs minimizing losses. As of MMay 2023, jobs have fully surpassed the pre-2020 recession peak.
Sacramento’s population has grown about 1% each year since the 2008 recession. With working-aged individuals making up some 60% of this added population, Sacramento needed an additional 84,000 jobs for adequate employment following 2015’s initial recovery for total employment to match population levels. At the past pace of job additions, this finally occurred in 2019, a decade after the conclusion of the recession.
This recovery was just in time for triple whammy of financial crash, pandemic and recession that arrived in 2020. As of May 2023, the number of jobs held is 4.1% above a year earlier, and 68,400 jobs above the pre-recession peak. Jobs bounced back much faster here in Sacramento compared to the rest of the state, likely due to the large number of state-sponsored jobs in Sacramento.
Real estate jobs lacking
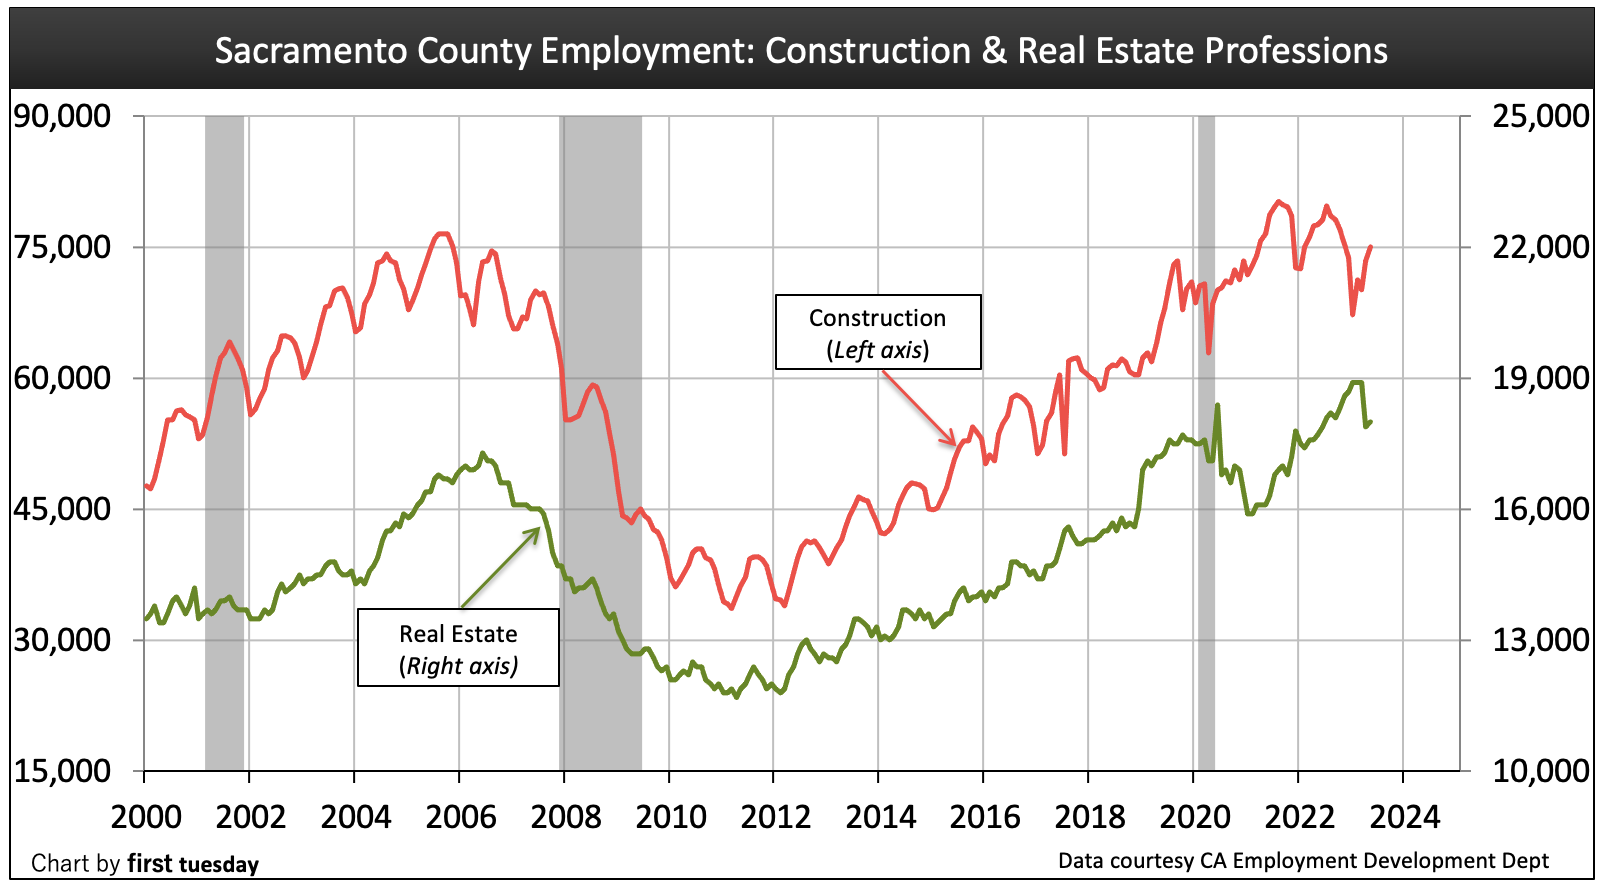
Chart update 08/22/23
| May 2023 | May 2022 | Annual change | |
Construction | 75,000 | 77,600 | -3.4% |
Real Estate Rentals & Leasing | 18,000 | 17,700 | +1.7% |
The recovery in jobs for those in the real estate and construction industries has been slow. Keep in mind that while the chart above shows a steady rise in both real estate and construction jobs, the actual number of construction jobs is displayed at seven times that of real estate jobs on the chart (the chart is displayed in this manner to make the change in real estate jobs perceptible). But the number of Sacramento real estate jobs and construction jobs are slightly above the pre-recession peak.
Some real estate jobs will be cast off in 2024 as transaction volume and pricing slow, still others will look to supplement their reduced incomes. However, expect construction jobs to be regained more swiftly as more housing is needed to meet demand, currently restrained by low inventory. Jobs of all types will begin a more consistent recovery from the forthcoming recession around 2026, filling wallets and in turn fueling household formations.
Income on the rise
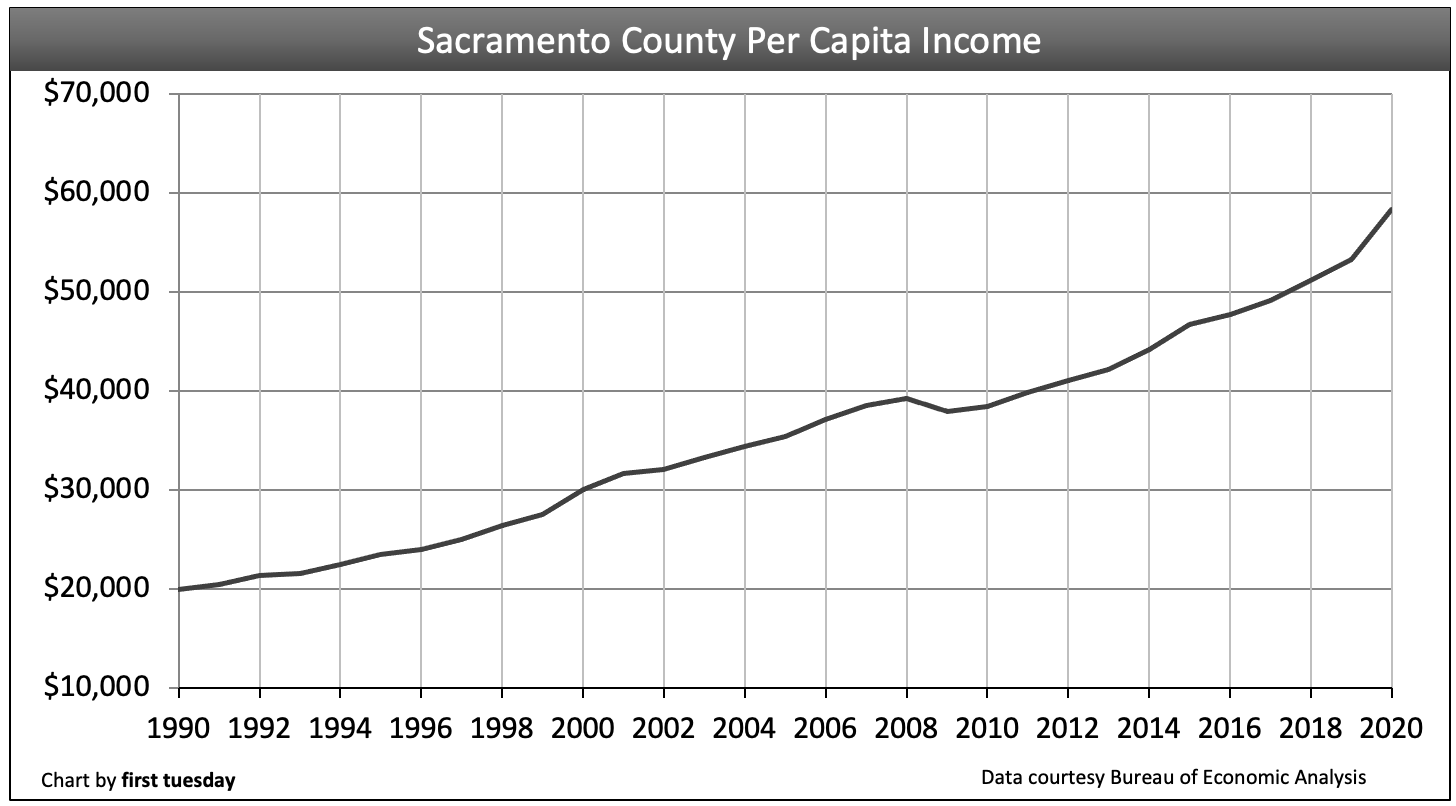
Chart update 05/12/22
| 2020 | 2019 | Annual change | |
| Sacramento County per capita income | $58,300 | $53,300 | +9.4% |
| California per capita income | $70,700 | $65,300 | +8.3% |
Sacramento County surpassed its 2008 (pre-recession) peak of $39,671 in per capita income just three years after the recession in 2011. In contrast, most of the state didn’t catch up with pre-recession income until 2012.
However, Sacramento County’s average income remains well below the state average as of 2020, an adjustment typical to the region. Government employee compensation is less than state averages but more long-term in duration than the private employment turnover throughout the state.
Income finally surpassed the pre-recession pace of around 3% a year in 2015, and actually exceeded the state’s average income pace at 9.4% in 2020. This is well above the target rate for consumer inflation, but still below the average annual increase in housing costs. Thus, incomes were able to match the ever-increasing price of goods and services in 2020, granting residents a boost in their standard of living.
For housing, incomes are keeping pace with the annual rise in the historic mean price trendline: the home price anchor and point at which prices invariably return. But annual home price movement during a business cycle is another matter. Property prices often rise or fall dramatically from year to year without regard to the annual rate of consumer inflation and wage increases before returning to the mean price trendline. In any given year, home pricing is controlled by factors such as:
- mortgage rates;
- jobs;
- personal savings;
- housing starts; and
- individual confidence in the future.
Expect to see average incomes fall back in 2023-2024, the result of job losses and reduced wages. However, the impact on home prices has been muted due to a still-low inventory.


It is fun reading the comments from 2018. If those people would have bought in 208 they would be very happy today.
Sacramento real estate prices don’t look like they will decrease anytime soon. Surprising to see this market continue to climb.
I would lke to know who is getting the raises, Sacramento is still 20 years behind for the same job in the rest of California. I can’t imagine prices going beyond 350k before we have anouther burst and anouther cover up by the banks setting their own values on Auction homes that are a result of stagnent wages and higher prices for everything form one of the highest tax base in the country to the cost of new shackeled needs like smart phones and old ones like food getting out of controll. You can only split a 20 year old wage so many ways.
The people getting raises can spell, and use correct grammar (try grammarly.com before you post next time). I have been looking at relocating to Sacramento. There are lots of jobs, and the wages for my office job are almost the same, but the home prices are much lower in Sacramento.
They are allready getting soft, anything over 325,000 in East Sac is just sitting there. Buyers are not buying the old and beaten up for top dollar with new homes competing at the same price point. Not as many will pay top dolllar for a house with a worn out roof and pool with outdated fixtures anymore when they can buy new. Some of the younger Agents have never seen what the real market looks like with all the artificial market tampering from the big banks casting a wide net over all the forclosures that sit empty or have renters and homeless either babysitting or squatting. Have walked into a few potty boxes in the past few months without warning and seen beautiful homes distroyed by those who are suposed to be taking care of the property but are running off buyers so they don’t get thrown out. And there is the over developed and the “it a sellers market” attitude, not anymore. Buyers are still complaining from the last crash and cost of living along with property taxes have risen faster than wages allready low for California. LA is starting to crash and the Bay Area is the next place expected to start to fall.
If you look at all the price reductions you will get it. Just follow the bouncing heart on the web and watch everything over 350k sit if it has repairs needed.
Sellers got too used to getting away with leaky roofs and dry-rot but if you add it to the asking price it simply dose not make sence to pay 30 k in repairs when you can buy new.
I feel like rents in the area (I’m in Folsom) have skyrocketed in the past three years. One house I almost rented in 2015 recently rented for $1650 with no change to the condition of the home. A friend of mine just had his rent increased at a popular apartment complex in Folsom to $1575 for a one bedroom. I am totally against rent control so please don’t go there, but I don’t think local incomes support these increases (or at least not their continuing increase.)
If you do a search on Zillow for houses in Sacramento County, look at all of the blue dots on the map. These are foreclosures, or pre-foreclosures (uncheck the box marked “make me move.”) There is a lot of blue on the map!
What are your thoughts?
You’re not very wise to be paying an excess of $1,500/month to rent a home in Folsom. It would probably make sense to step down so that you can come up. There are plenty of nice homes in Sacramento where you could afford a home; build some equity and move on. Folsom has nothing to offer but chain restaurants and suburban dullness. Plenty of 20 somethings living in cottage style homes in older neighborhoods throughout Sacramento proper (Not Rancho Cordova or Citrus Heights).