
Why this matters: The tandem relationship between the separate volume and pricing trends in property sales indicates the coming change in the number of transactions and the follow-on move in pricing. For real estate agents and brokers to responsibly guide pricing decisions with their clients, the tandem lead-lag nature of the two data sets is recognized as strong indicators of a parallel forward change to the other.
Stuck in the waiting period, until…
California home sales volume stalled in the fourth quarter (Q4) of 2025, with quarterly sales volume 1.5% above a year earlier. Despite the intimidatingly high mortgage interest rates, elevated prices held. But wars will increase both mortgage rates and buyer caution.
Home prices were 0.2% below a year earlier in Q4 2025. Home price trends typically follow a consistent movement in sales volume moves by about 12 months. The delay in follow-on pricing in a declining sales volume market is due to the sticky pricing phenomenon that discourages sellers from accepting lower sale prices than sellers experienced in the recent past.
Sellers’ expectations for the California housing market are still greatly influenced by pricing in the first half of the 2020s when record low interest rates were introduced. At the time, the resulting sales volume was a pandemic-era buying spree which quickly absorbed the inventory of property for sale.
Sellers met the challenge with rapid price increases — 30% within 12 months. This left sellers with the illusion of inflated price expectations as 2022 mortgage rates leaped to quickly diminish the number of willing buyers without a compensatory reduction in asking prices.
Underlying both sales volume and price movement is that all-important factor: jobs. Homebuyers need a reliable source of income to purchase, making jobs necessary for homes to sell and prices to remain buoyed. But job uncertainty and rising cost of ownership in both the price and the costs of a mortgage have dissuaded potential buyers from making big lifestyle changes.
Until consumer confidence rises, expect home sales volume to remain low, and prices to follow suit.
The immediate future — 2026 — largely depends on how the mortgage-backed bond market responds to steps taken by the Fed to corral rising consumer prices and job disruptions while wars of all sorts are being waged.
Updated April 7, 2026.
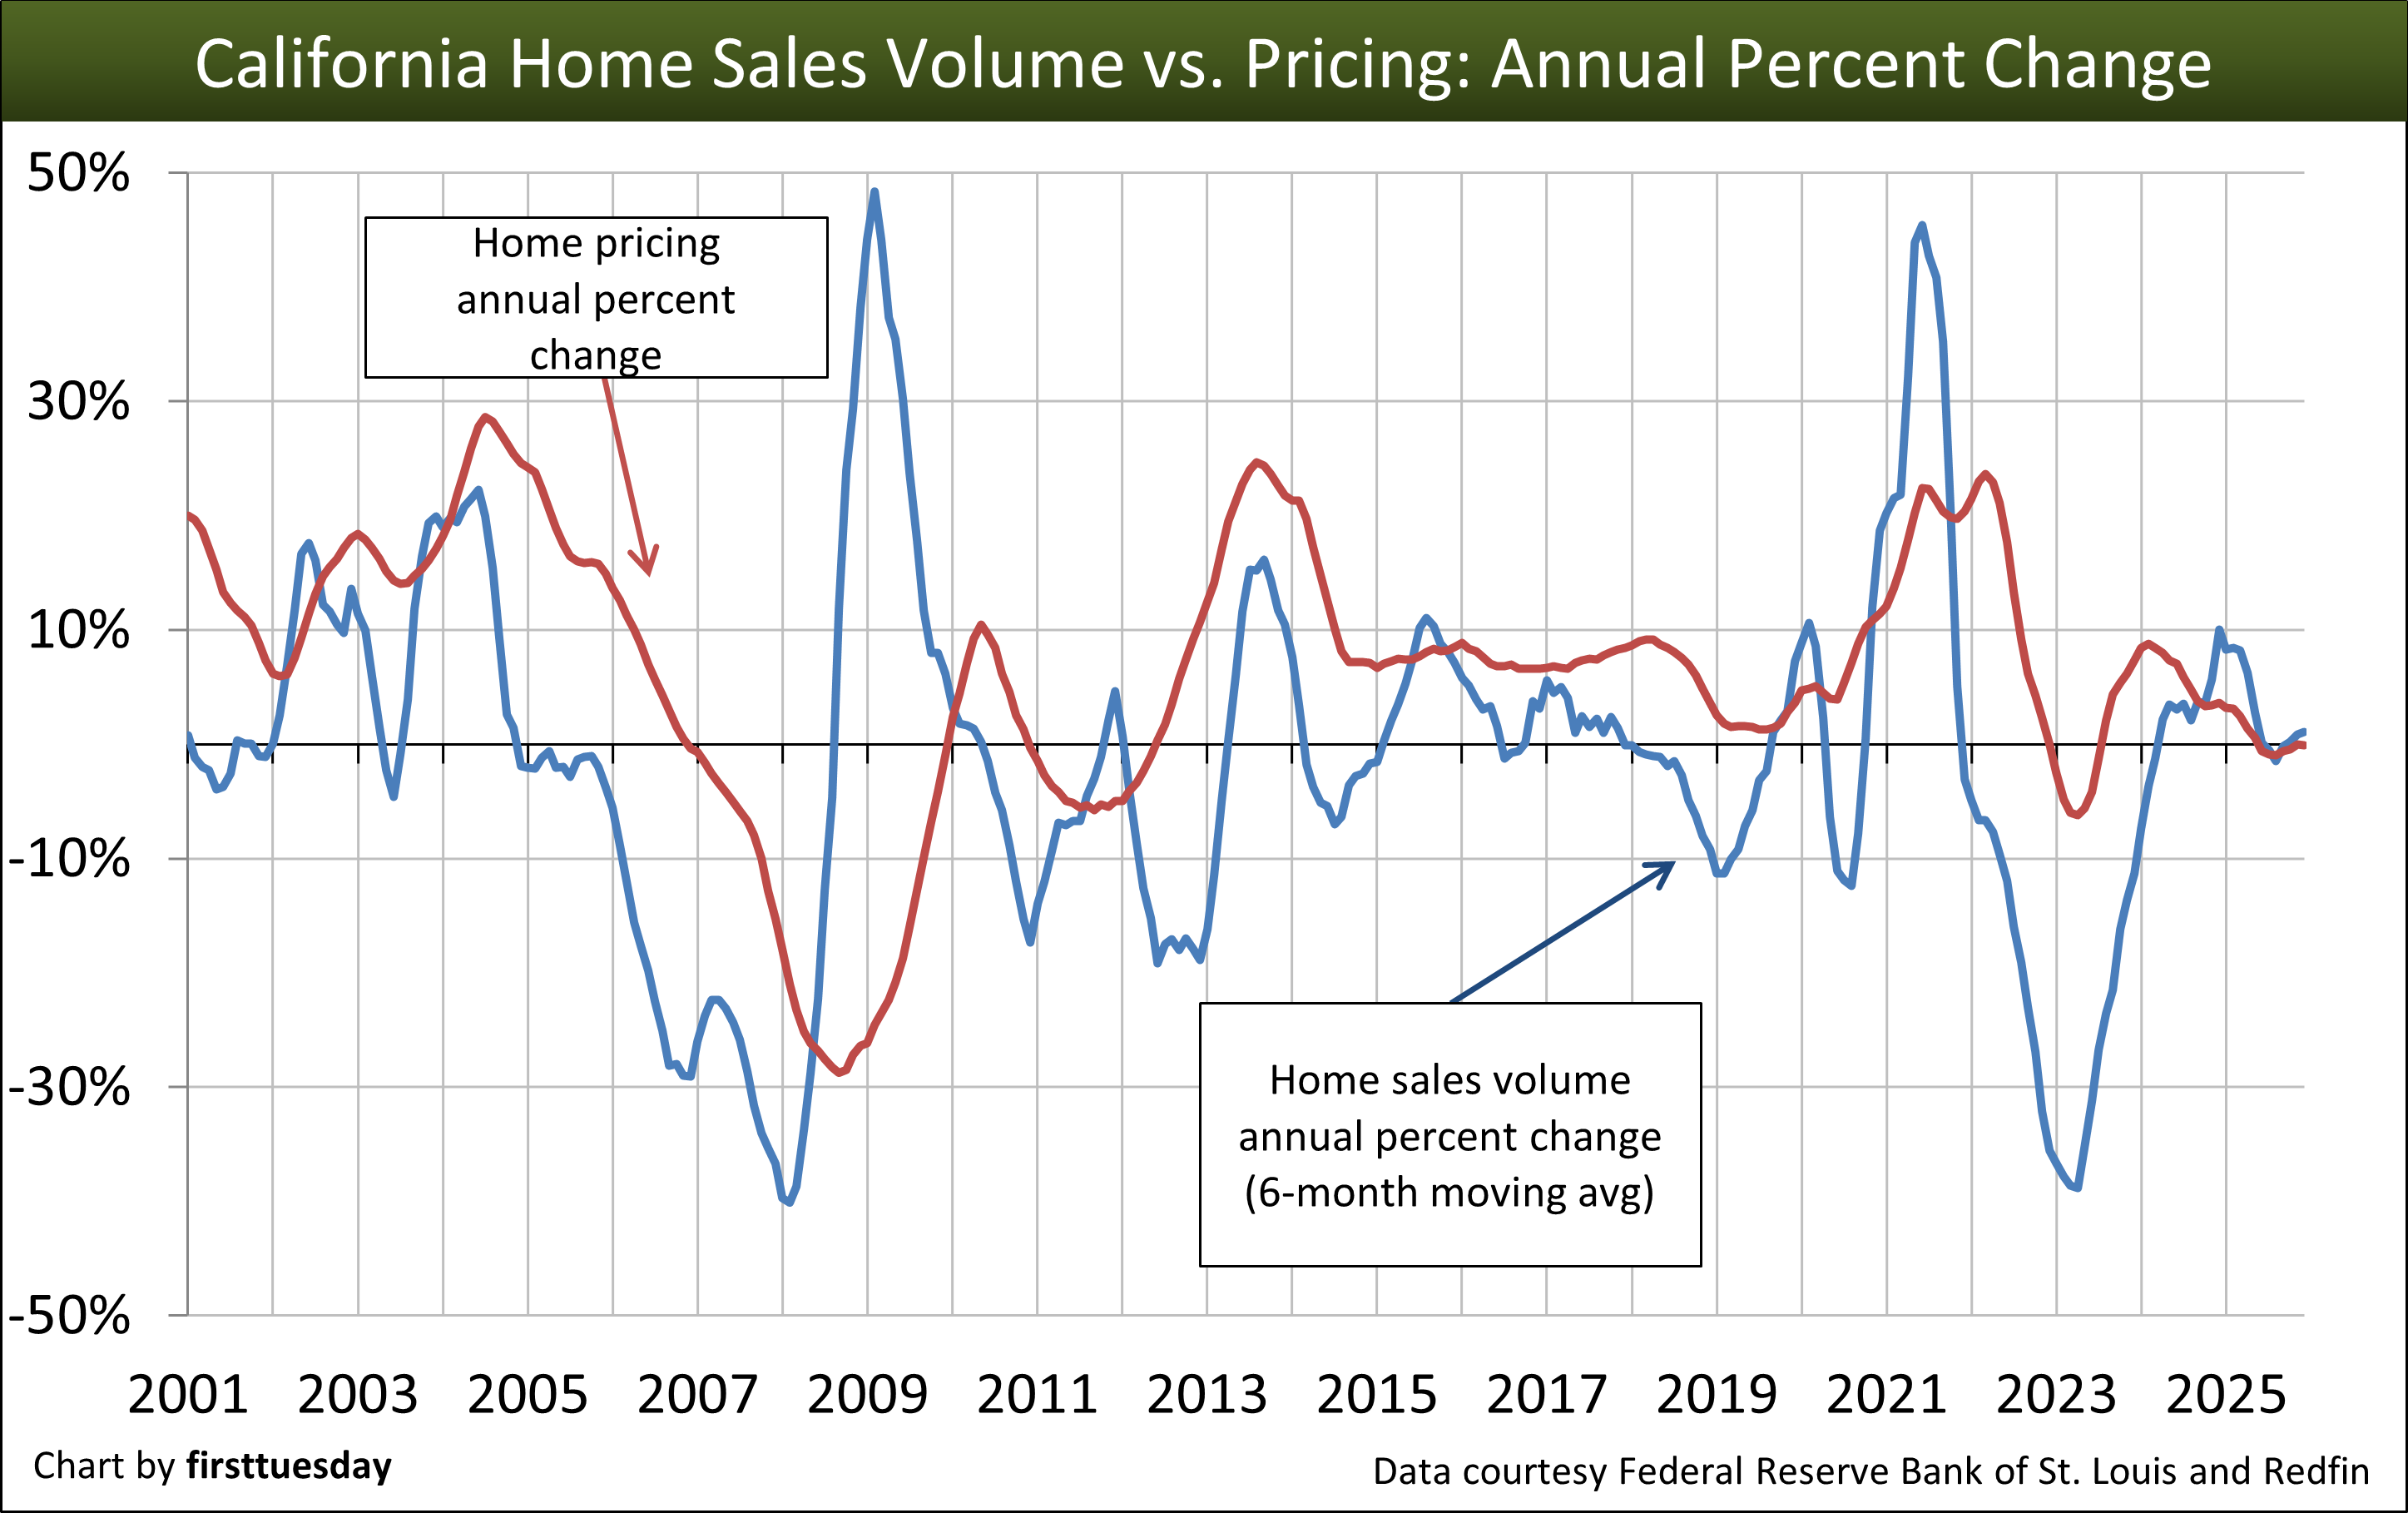 Editor’s note — The chart above shows a 6-month moving average for sales volume. Therefore, while actual home sales volume average +1.5% above a year earlier in Q4 2025, the longer 6-month average displayed on the chart is just +1.1% above a year earlier.
Chart update 4/7/26
| Q4 2025 | Q4 2024 | Annual percent change | |
| Home sales volume | 68,900 | 67,900 | +1.5% |
| Home price index | 426 | 426 | +0.0% |
Sales volume projects home prices
Many indicators go into forecasting home prices, including:
- home sales volume and inventory;
- buyer purchasing power and confidence;
- jobs performance; and
- mortgage rates.
Of these, current home sales volume movement has the most direct impact on tomorrow’s home prices.
The chart above tracks movement in home sales volume and the corresponding impact on home price movement roughly nine months later. Movement in home sales volume is depicted in the chart above by plotting the percent change from one year to the next. A six-month moving average is used to smooth out month-to-month fluctuations caused by seasonal pressures.
One important factor affecting sales volume not displayed on the chart is fixed mortgage rates. Rates jumped sharply after record lows in 2021 and continue to remain elevated, inhibiting buyers in 2026. Despite a soft sales volume, prices have held but are faltering at the highest price tier as the wealthy become cautious.
The foundation for a true recovery isn’t sales volume
To predict sale volume and pricing of property, you need to look at jobs. Home sales volume movement is telling as it suggests future home price movement. But it’s a mechanical correlation — the interwoven relationship between volume and prices alone doesn’t indicate how consistent the changes will be in the two data sets.
Since homeowners and renters require an income to make housing payments, California’s housing market is a reflection of the jobs market. A look to job numbers provides an indicator for home sales volume since sales and leasing transaction volume head in the same direction as the number of individuals employed.
The job market surpassed its pre-pandemic 2019 peak in October 2022. However, growth since then has stagnated with only 2.5% more Californians employed at the end of 2025 compared to six years earlier.
Expect to see job numbers slip as we make our way through the coming national recession, a follow-on recession to our California real estate recession which commenced in mid-2022 and persists today. A continuing US war effort will likely gear up job numbers sufficient to stall a general recession as was experienced in the mid to late 1960s.
Additionally, trends in the amount of inventory available for sale tend to move in reverse order from recent sales volume. This sales-versus-inventory spread influences the direction of pricing which runs in tandem with but lags behind sales volume movement. Thus, sales volume is the first to peak and the first to bottom.


I need to take the Exam for renuw my licence as soon as possible
Dear Stephen,
Thank you for your question. We’ve posted a response to this question about inventory and home prices here: Does inventory set home prices?
Regards,
first tuesday Editorial Staff
On the volume versus home prices question, in San Diego County volume has dipped but prices keep inching up. The reason appears to be that inventory is so low, and low enough to define the current market as a ‘seller’s’ market. Isn’t inventory (or said another way, ‘months of inventory’) a stronger indicator of price movement than volume?