Why this matters: California’s homeownership rates, have stabilized at a moderate historic level following a return to fully regulated mortgage lending after the Great Recession. Now global disruptions, sticky asking prices and high FRM rates are sidelining hesitant buyers otherwise ready and willing to become homeowners.
Buyer-clients are now preferring to wait, and watch for-sale inventories build up so prices weaken. We are now in a four-year long pricing trough destined to continue – and likely worsen – over the next few years until a recovery sets in with sales volume and homeownership rates rising normally again.
Homeownership steady among debilitating factors
California’s average homeownership rate held at 55.3% in 2025. This was down from the homeownership rate of 55.8% experienced in 2023. However, the rate is firm as the beginning of 2026 shows the rate at 55.7% in Q1.
After trending down from its predatory mortgage-induced 60.7% peak in 2006 to its present level near 55%, the homeownership rate has finally stabilized at what appears as a normative level for the state.
California’s homeownership rate typically runs around 10 percentage points below the national average, primarily due to the flexibility of the state’s more job-mobile population. Another culprit for California’s low homeownership rate is a lack of residential construction sufficient to support the state’s ever-growing population.
Our housing supply-and-demand imbalance cyclically forces homeownership temporarily out of reach for many would-be homebuyers. Legislators and the Attorney General have aggressively addressed this dynamic for years with little to show in return. Cities where the jobs are located obstruct new housing of any type rather than facilitate the needs of the general population. Thus, the population commutes long-distances on widened highways.
However, when the coming recession settles in, the homeownership gains California has experienced since 2016 will avoid the disruptive loss of a home by foreclosure seen in 2008-2011 recession. Our state’s homeownership rate is likely to remain stable near its current historical level in spite of the present global economic chaos.
Post updated June 25, 2026.
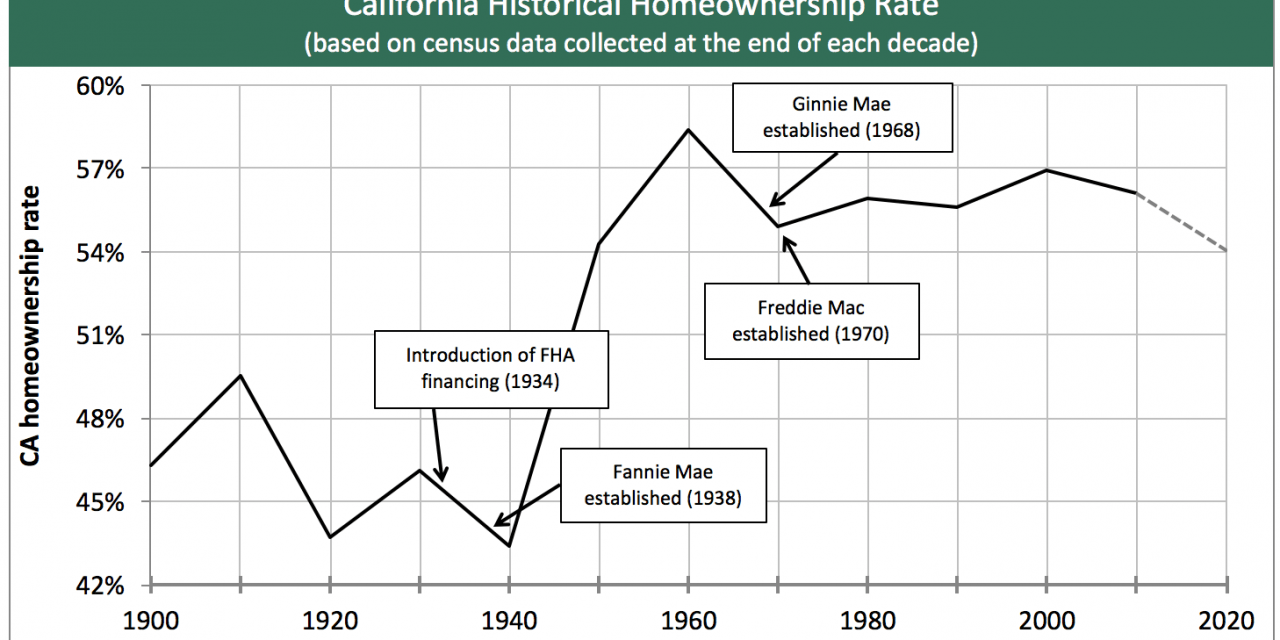
Chart 1
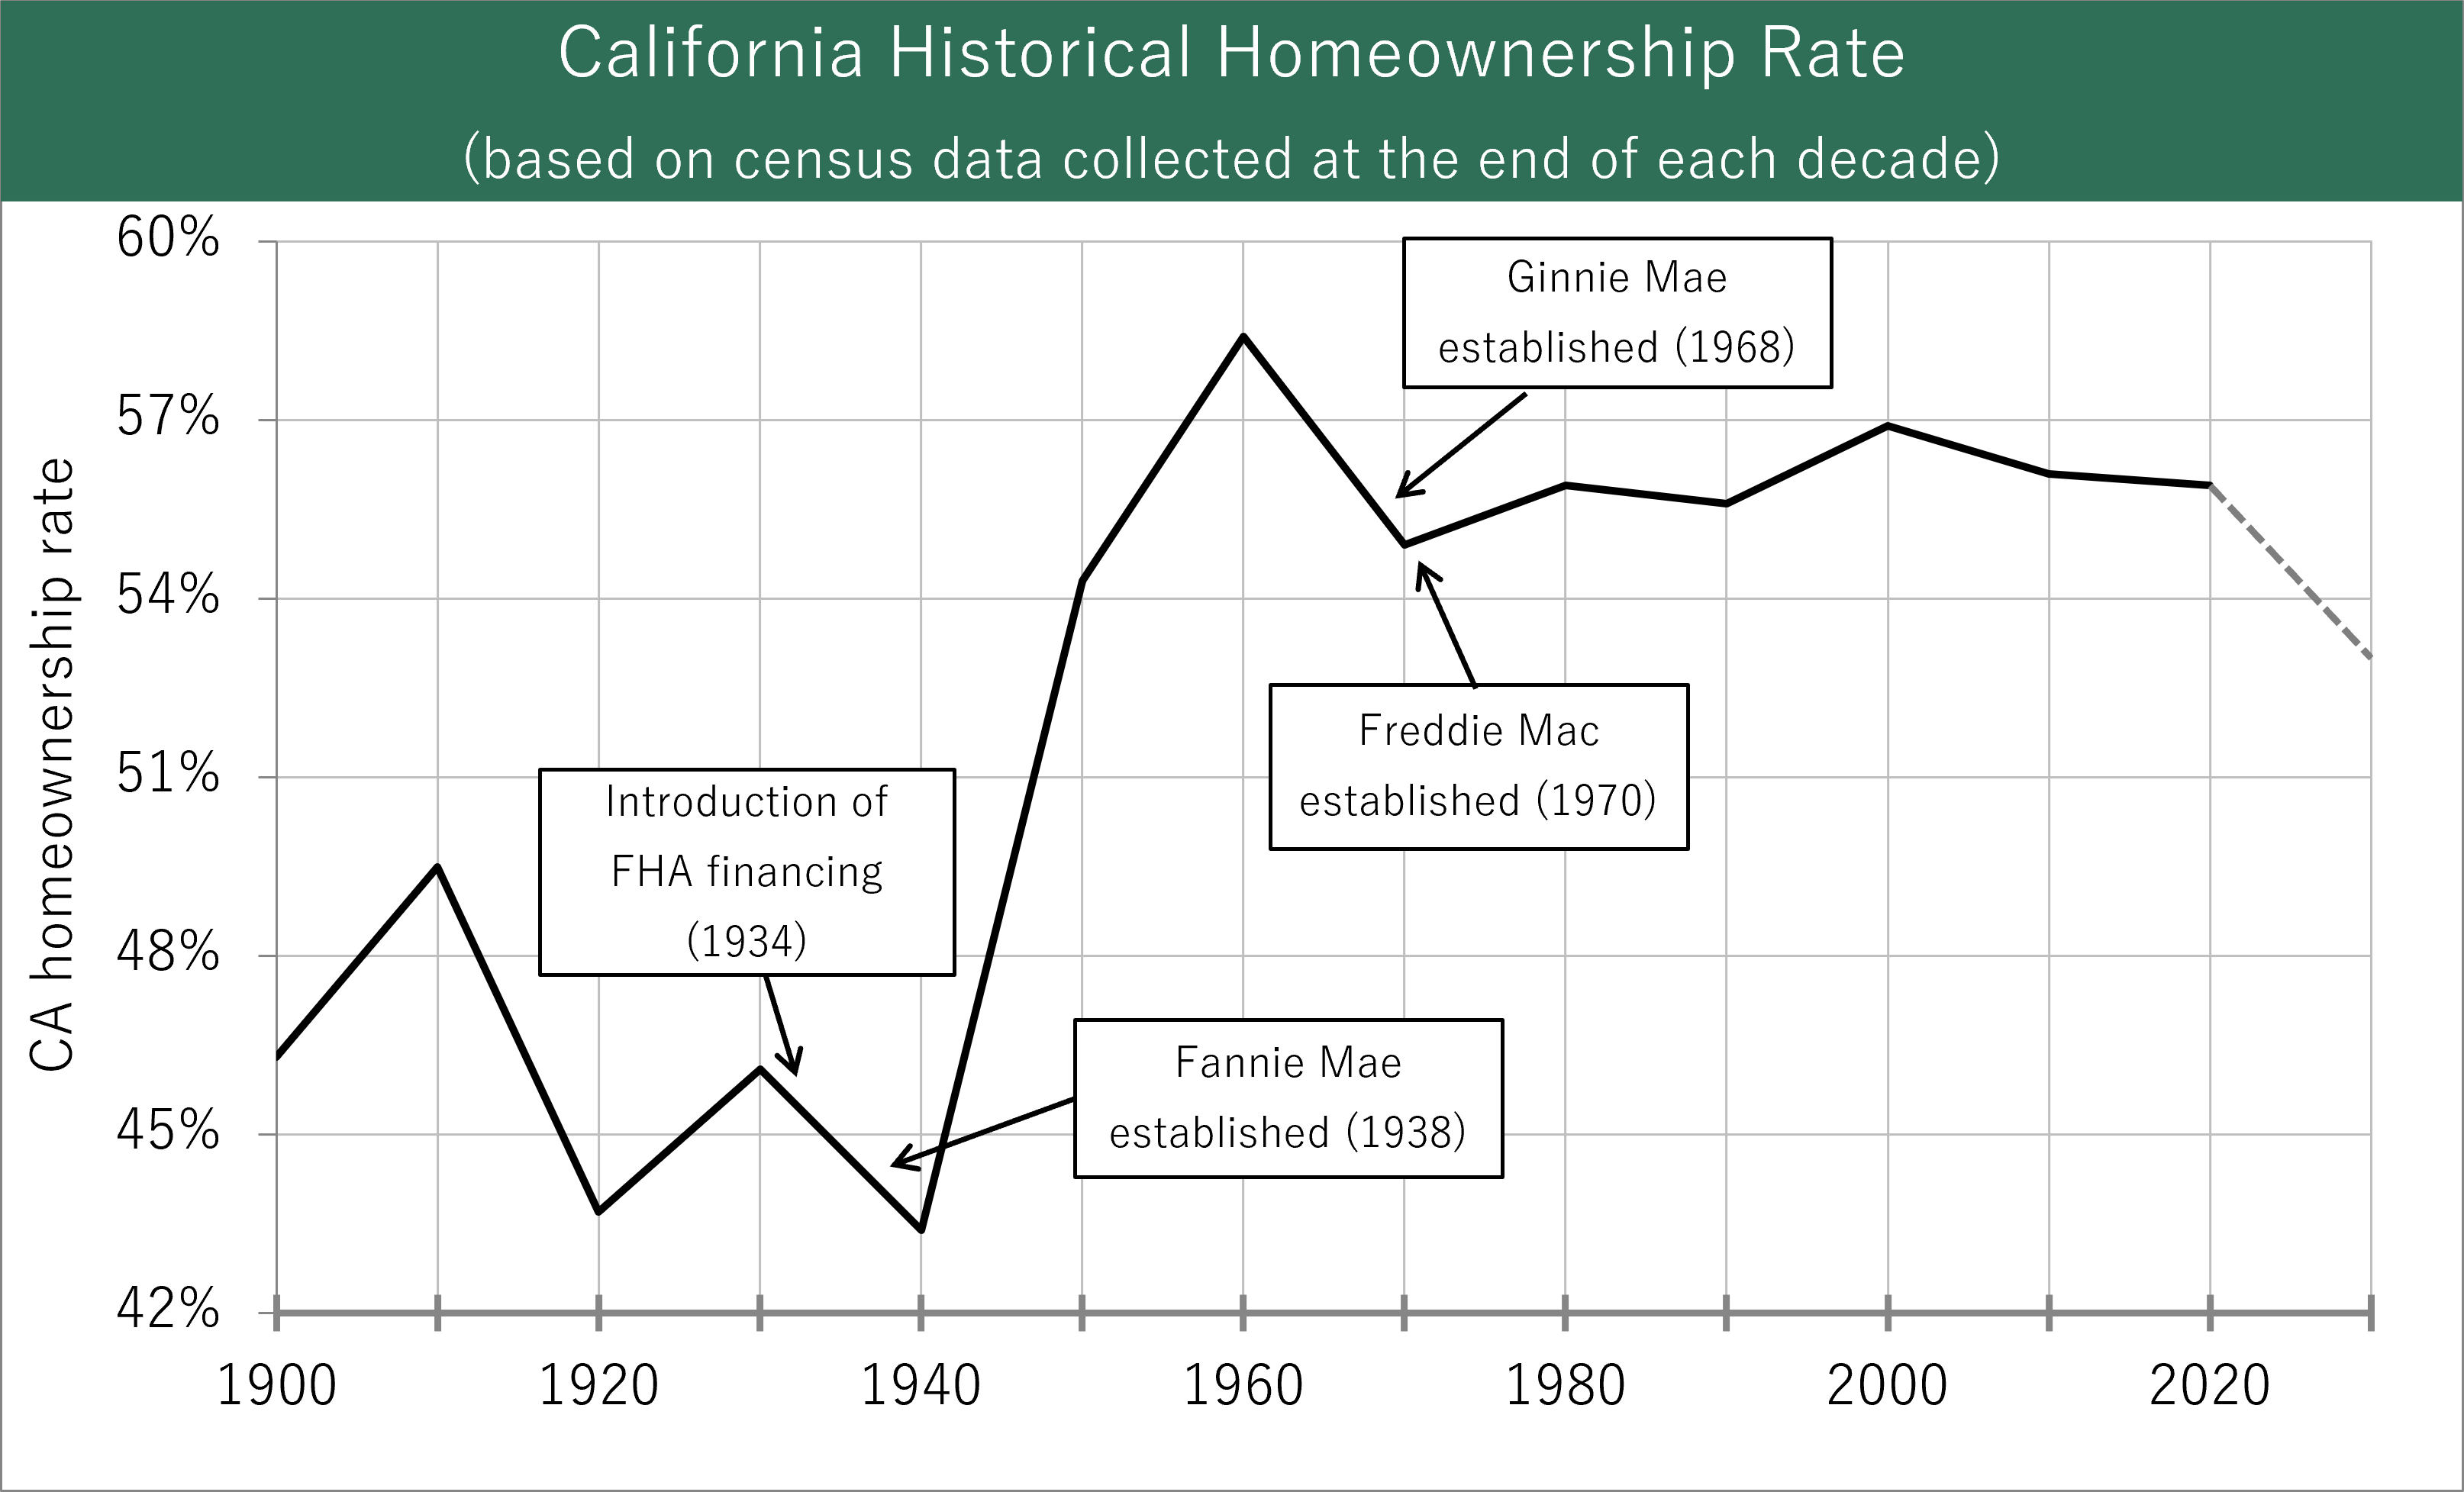
Reflects census data taken at the end of each decade
Chart updated 8/15/25
| 2020 | 2006 peak | 1940 low | |
| Homeownership rate | 55.9% | 60.7% | 43.4% |
Chart 2
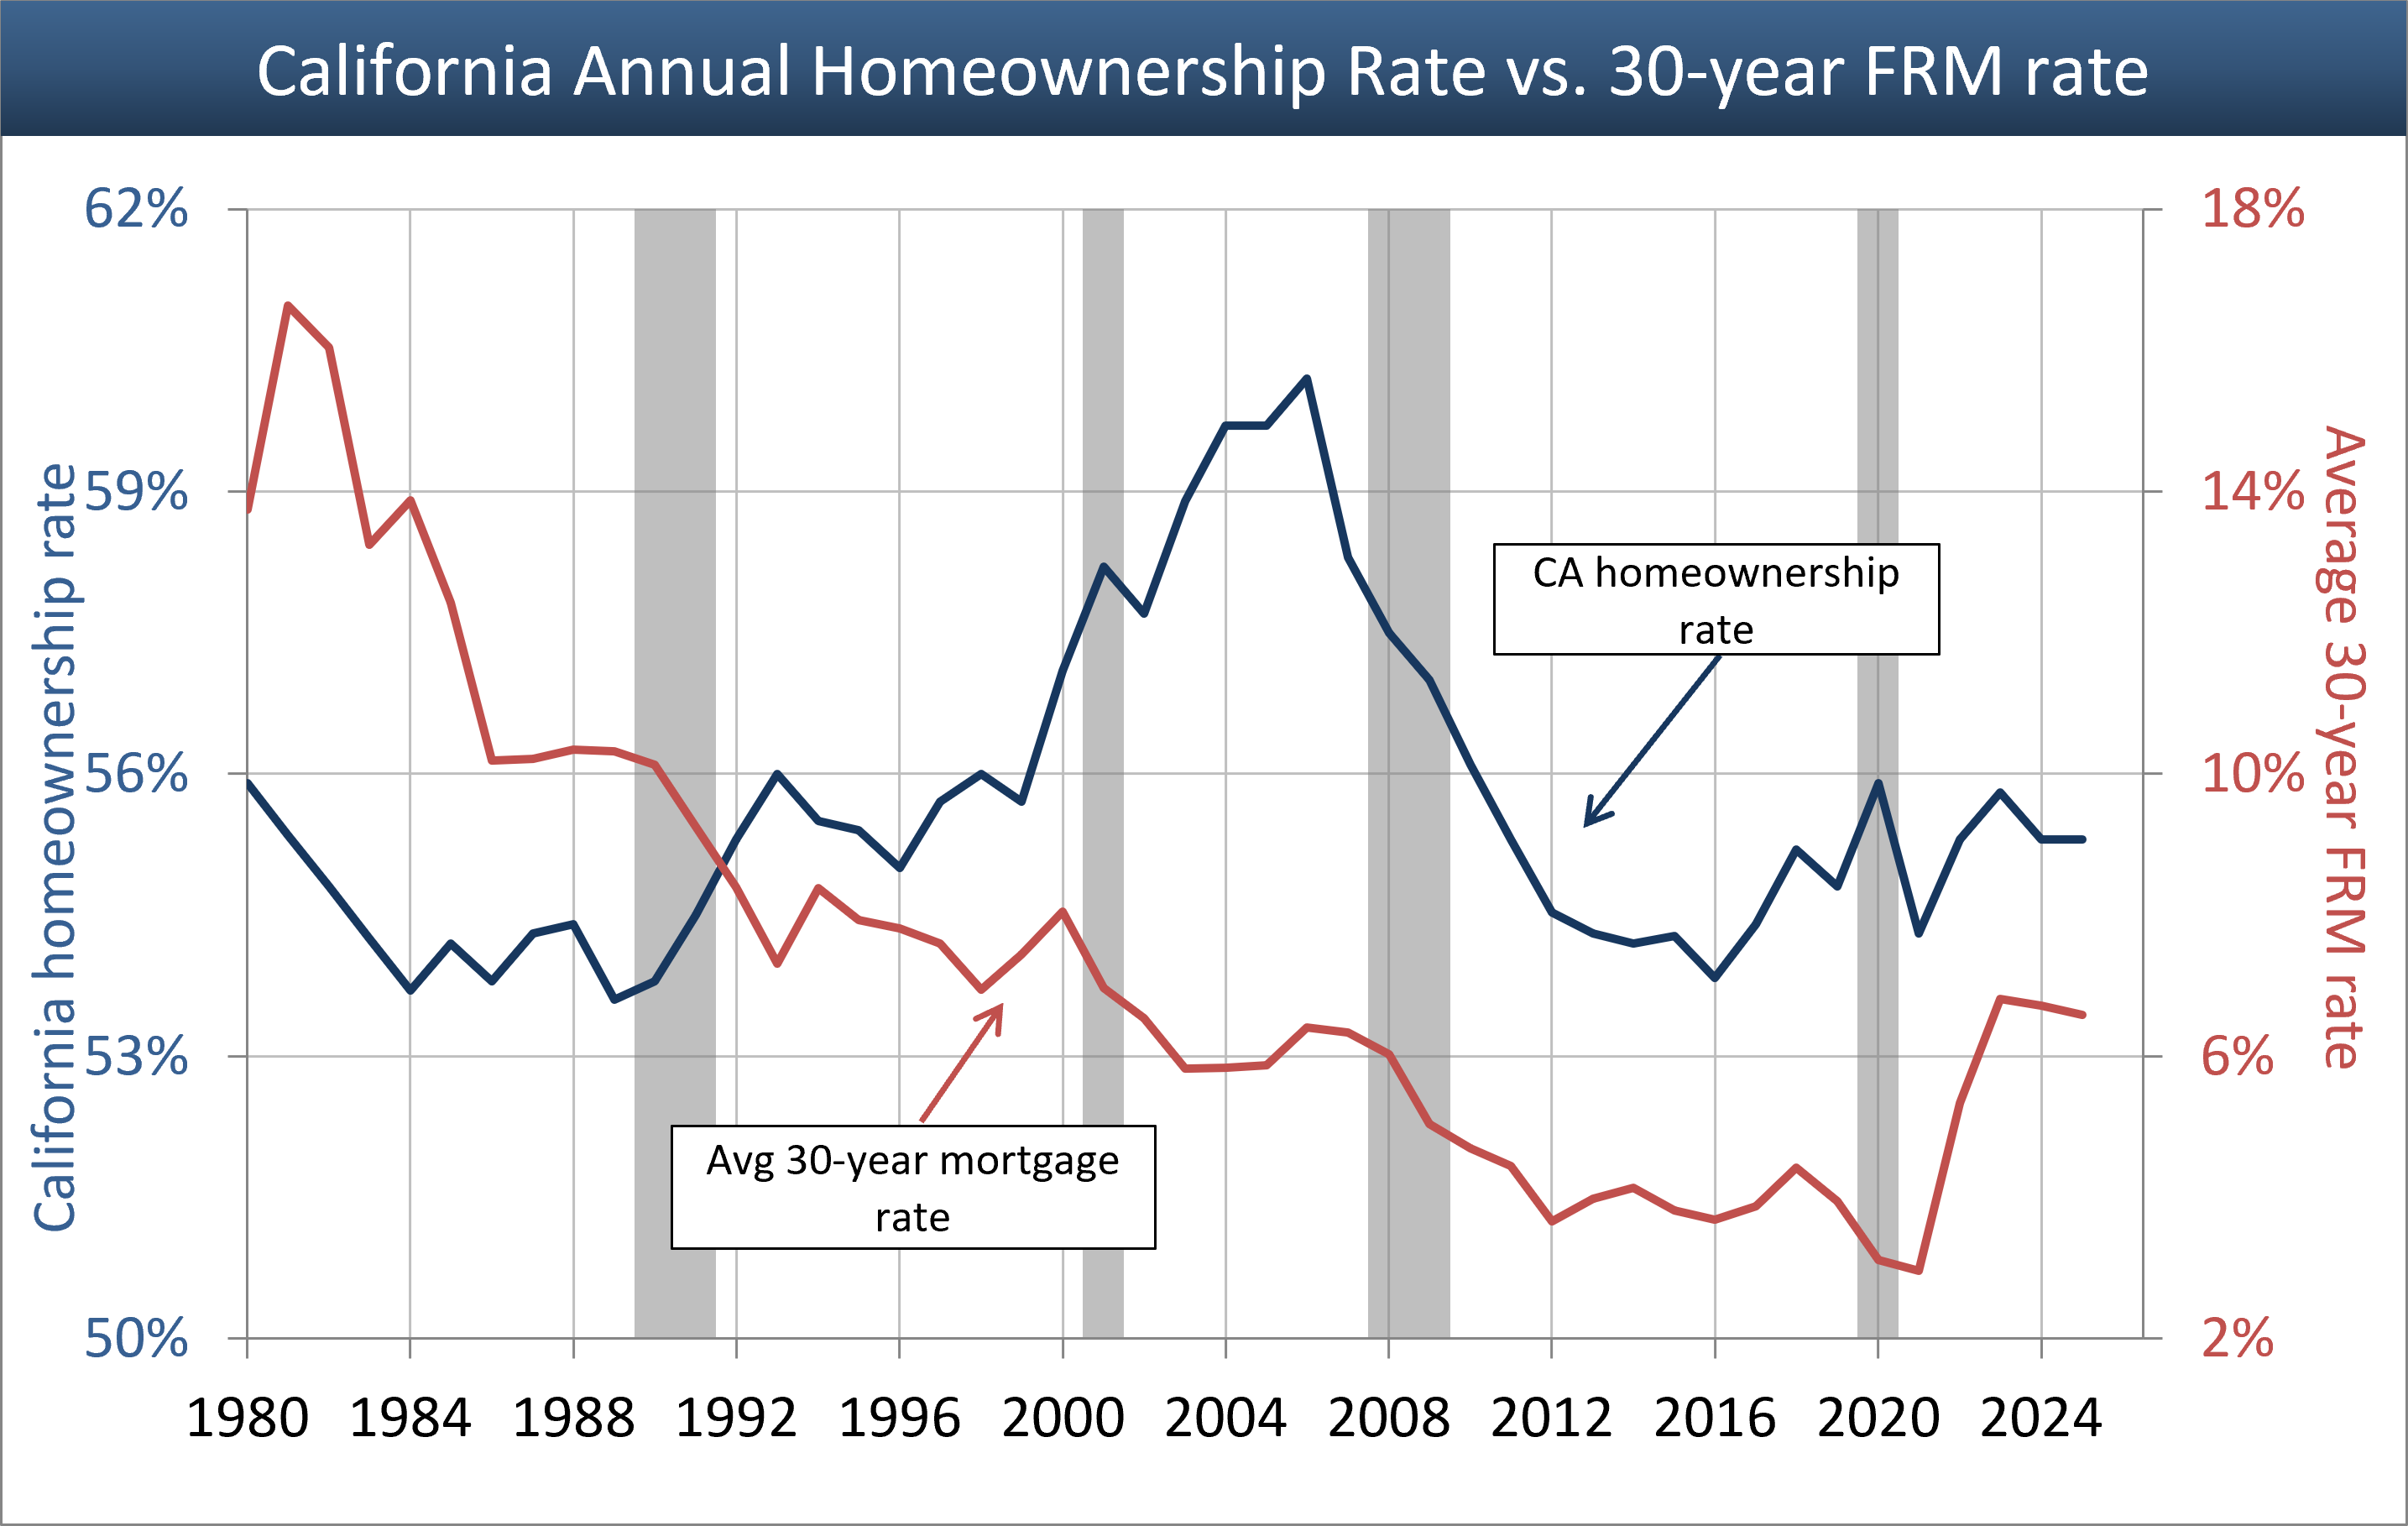
Chart updated 6/25/26
| 2025 | 2006 peak | 1989: 30-year-low | |
| Average homeownership rate | 55.3% | 60.7% | 53.6% |
Past, present, future
California’s homeownership rate ballooned during the Millennium Boom, only to plunge with the Great Recession and its accompanying foreclosures and relocation of 1.1 million homeowner families. California’s homeownership rate has finally stabilized around 55%.
California’s homeownership rate is historically around 10 percentage points below the national homeownership rate (at 65.7% nationally at the end of 2025). This is due to a combination of factors, including the lesser impact of the national housing policy constantly pushing the “American Dream” of homeownership on our more mobile and math-conscious Californians.
Understanding the factors which impact California’s homeownership rate requires an analysis of several economic factors, demonstrated visually through the charts above.
Chart 1: The long view of homeownership
In 1934 Federal Housing Administration (FHA)-insured mortgage financing was introduced to commence a national housing policy pushing construction jobs via highly leveraged homeownership. The objective was for FHA to allow virtually anyone with a steady income to finance the purchase of a home.
Previously, only individuals wealthy enough to qualify with 50% down payments could borrow to fund ownership of a home. Sellers frequently supplied the financing (as the creditor of last resort) with a carryback note and trust deed for a portion of the price, without which they could not sell.
Much later, Chart 1 shows the evolution of California’s homeownership rate as three factors were introduced:
- 1982: adjustable rate mortgages (ARMs) of all varieties made their debut in California (strict state-regulated variable interest rate mortgages (VIRs) already existed for more than a decade);
- 1986: the federal right to borrow against your home equity as though it were an ATM under the Tax Reform Act of 1986, (Californians had this right from the early 1970s); and
- 1997: the inception of the Internal Revenue Code (IRC) §121 principal residence profit exclusion (capping 20 years of treating homeownership as a profit-center investment since declining mortgage rates created homeowner wealth).
The easy access after 1982 to deceptively complex, enticing ARMs in boom-time recovery periods allowed homebuyers to borrow more with an ARM than had they taken out a fixed-rate mortgage. However, the ARM left the owner with payments they could not make when the ARM adjusted – the zero ability to pay (ZAP) mortgage situation outlawed in 2010.
And then the incentives provided by the Tax Reform Act of 1986 and the principal residence profit exclusion in 1997, pushed the California homeownership rate beyond historical bounds of 55% to an unsustainable 60.7% in 2006.
This high rate of homeownership, quickly attained by mortgage lenders originating mortgages to fund untenable ownership, proved short-lived. Homeowners, who were not qualified by the mortgage lenders to handle ARMs once the rate and payments began to reset, defaulted. Thus, new homeowners walked and returned to what they knew best – renting.
Related video:
Mortgage Concepts: The birth of the adjustable rate mortgage (ARM)
Chart 2: Recent movements
In an improving economy, homeownership rates drop as mortgage rates move upward until the Federal Reserve rate cools the economy. This phenomenon was reflected in the rate of homeownership during the late 1950s through the early 1980s.
Chart 2 displays the generally unacknowledged converse economic relationship between the 30-year fixed rate mortgage (FRM) rate and the homeownership rate (with upward home price trends) from early 1980 until 2006, the beginning of the Great Recession.
However, the millennium mortgage financing crisis brought on an unusual tandem drop in both FRM and homeownership rates as homeownership lost its decades-long status as part of the American dream in 2008. Today, the homeownership rate has stabilized.
Related article:
Using the yield spread to forecast recessions and recoveries
Just as the 2001 recession’s magic was removing inefficiencies in the economy, fiscal and monetary moves to stimulate the economy post-9/11 fed directly to the Millennium Boom. In the boom, as aided and abetted by extensive mortgage deregulation, low-tier home prices were artificially driven to a three-fold high price.
A new real estate paradigm was prematurely declared in which prices would go up and up forever, in brazen defiance of economic principles. Bond rating agencies, improperly induced by Wall Street bankers, fully endorsed the ARM ad nauseum concept and issued mortgage-backed bonds full of tranches, now sliced and diced for any level of investor risk.
To no surprise, this false paradigm came crashing down in 2007, and agents and brokers fell fast alongside real estate values into recession. Recovery mode arrived in 2013 as FRM rates fell to historic lows of 3.6%.
Apart from the effects of the interest rate cycle of rising and falling rates, the evolving societal mores of the younger first-time buyer generation show an increasing tendency towards renting, rather than owning one’s shelter. As these new generations are financially more aware and wary due to student debt, they are hesitant to repeat the real estate and related mortgage mistakes of the past.
Related article:
Today’s first-time homebuyers are priced out of buying — and also renting
In California, the pandemic momentum has faded from home prices and buyers’ fear of missing out.
Homebuyers in a real estate recession prefer a wait-and-see approach. The current generation of first-time buyers are more financially literate, well paid and less able to borrow large mortgage sums at fixed rates than in years past.
However, the rise of ARM deregulation in 2025 foreshadows an increased anxiety among homebuyers to act now. Thus, they are taking on more risk of foreclosure and loss in the coming recession.
Related article:


Home ownership in California is not going down because this article does not discuss all the methods of home ownership. Home ownership among those who reside in California is going down. However, if you factor in foreign investment and people who buy homes in California who do not live in this state home ownership is up quite a bit. There are very few unclaimed or unowned properties or house in California. If you track sales of homes you will notice those have not declined. I don’t think this is a bubble because as long as foreign investment is coming in to buy homes and real estate the prices will continue to be held high.
13 -48 bp (unch frm 9:30)Dollar/Yen: 110.
Interest rates go down but home ownership goes down anyway?? Property values going up steeply over median income??? What does this tell you?
STOP!!
Bubble time