
The average 30-year fixed rate mortgage (FRM) rate for the week ending November 10, 2017 decreased to 3.78%. The 15-year FRM rate fell to 3.09%. The recent short-term trend shows FRM rates have remained low, continuing a slow decline.

The financial markets going into 2017 saw a “Trump jump” due to post-election investor anticipation.
Those bounces lost steam with mortgage rates slowly declining as we head into the 2018 period of economic slowdown. The decade-old recovery has been kept from overheating by a combination of failed fiscal action and the Federal Reserve (the Fed) rate hikes.
FRM rates are tied to the bond market and move in tandem with the 10-year Treasury Note (T-Note) rate. Investors have been placing large sums in bonds and on deposit with the Fed for safekeeping. This is due to congressional uncertainty over fiscal rectitude and a scarcity of investment opportunities beyond the pricey stock market and shaky hedge funds. These excess funds have kept FRM rates low and steady.
Mortgage lenders use the 10-year T-Note to determine a homebuyer’s FRM rate — while adjustable rate mortgage (ARM) rates are based on interest rates paid on savings accounts. The difference between the FRM note rate and the 10-year T-Note rate represents the lender’s risk premium. The premium accounts for potential losses due to foreclosures which are not present when holding T-notes.
The current spread between the 10-year T-Note and 30-year FRM rate is now 1.46%, just below the historical difference of 1.5%. However, the long-term trend shows a more elevated spread between the two rates, a condition most likely to continue as the rate of foreclosures is starting to rise. A higher spread indicates higher than normal mortgage rates for homebuyers and owners refinancing. As buyers are now faced with both overpriced mortgages and excessive home pricing, we are witnessing a logical reduction in purchase-assist originations and a slowdown in residential sales volume. The solution is a doubling up on SFR construction in city centers to create ownership turnover, which increases inventory and sales volume.

As of October 2017, the average monthly rate on ARMs increased to 3.31%, far above its low point of 2.49% experienced in May 2013. The use of ARMs to fund the purchase of homes has gradually risen over the past year. The rise is due to home prices accelerating faster than the rate of pay, causing buyers to take on more risky ARMs to extend their purchasing power. With each Fed hike in the short-term interest rate they push up the ARM rate proportionately.
Looking forward, expect ARM rates to move in tandem with future adjustments to the short-term rate made by the Fed. Further, some key federal changes proposed by the current administration – though yet to be implemented and highly unlikely to occur – may put upward pressure on ARM rates, along with payments on consumer debt for cars, credit cards and business loans. These pending proposals include:
- tax rate reductions and increased tax incentives to privatize government infrastructure programs, causing a net drop in federal tax revenue;
- deregulation of mortgage lending that will increase availability of predatory mortgages and homebuyer demand for mortgages;
- a congressional shift from fiscal austerity to stimulus through growth in infrastructure and military spending, triggering a sharp rise in the employment rate, labor force participation and wages;
- increased federal and private borrowing spent on new long-term government programs that will raise demand for capital from the bond market; and
- new import tariffs driving up the cost of goods and thus the rate of inflation, resulting in higher interest rates.
The only change to have occurred so far is the new tariffs placed on lumber imports from Canada, increasing the cost of lumber by up to 20%. As Canadian lumber composes around 30% of all lumber used in U.S. residential construction, the tariffs are expected to raise construction costs and will likely drive up home prices at least 2% before exchange rates rebalance to quickly eliminate the increase in dollar costs and reduce the rate of exports from the U.S. to Canada.
Updated 11/10/2017. Original copy released 03/13/2012.
Click the link to go directly to a chart, or browse the charts by scrolling below.
1. 30-year fixed rate mortgage (FRM) rate, weekly — Chart update 11/10/17
2. 30-year FRM rate, monthly — Chart update 10/27/17
3. 15-year FRM rate — Chart update 11/10/17
4. 5/1 adjustable rate mortgage (ARM) rate — Chart update 10/27/17
5. 10-year Treasury note rate — Chart update 11/10/17
6. Combined FRM and 10-year Treasury note rates — Chart update 11/03/17
7. 91-day Treasury bill rate — Chart update 10/06/17
8. 3-month Treasury bill — Chart update 10/13/17
9. 6-month Treasury bill — Chart update 10/13/17
10. Treasury Securities average yield — Chart update 10/06/17
11. 12-month Treasury average — Chart update 10/13/17
12. Cost of Funds Index — Chart update 08/25/17
13. London Inter-Bank Offered rate (LIBOR) — Chart update 08/25/17
14. Applicable federal rates — Chart update 10/06/17
15. Private lender section 32 Reg-Z loans — Chart update 10/06/17
Average 30-Year Conventional Commitment Rate
| ||
| Chart update 11/10/17 | ||
Current | Month ago 10/13/17 3.83% | Year ago 11/10/16 3.57% |
The average 30-year FRM rate in California is provided by Bankrate.com.
| ||
Average 30-Year Conventional Commitment Rate: 1991-present
| ||
| Chart update 10/27/17 | ||
Oct 2017 Average 3.82% | Sep 2017 Average 3.73% | Oct 2016 Average 3.43% |
 | ||
| Chart update 11/10/17 | ||
Current 11/10/17 3.09% | Month ago 10/13/17 3.07% | Year ago 11/10/16 2.81% |
The average 15-year FRM rate in California is provided by Bankrate.com.
| ||
5/1 Adjustable Rate Mortgage (ARM) Average Rate | ||
 | ||
| Chart update 10/27/17 | ||
Oct 2017 3.31% | Sep 2017 3.19% | Oct 2016 3.06% |
The 5/1 average adjustable rate mortgage (ARM) rate shows the average rate for the first five years after origination. After the initial five-year period, the ARM rate is adjusted annually based on an index figure, such as a certain Treasury Bill rate (which reflects Federal Reserve rate movements) or the London Inter-Bank Offered Rate (LIBOR). Beginning January 2016, the average ARM rate in California is provided by Bankrate.com. Prior to January 2016, the average ARM rate is provided by Freddie Mac’s survey of the Western Region of the U.S. | ||
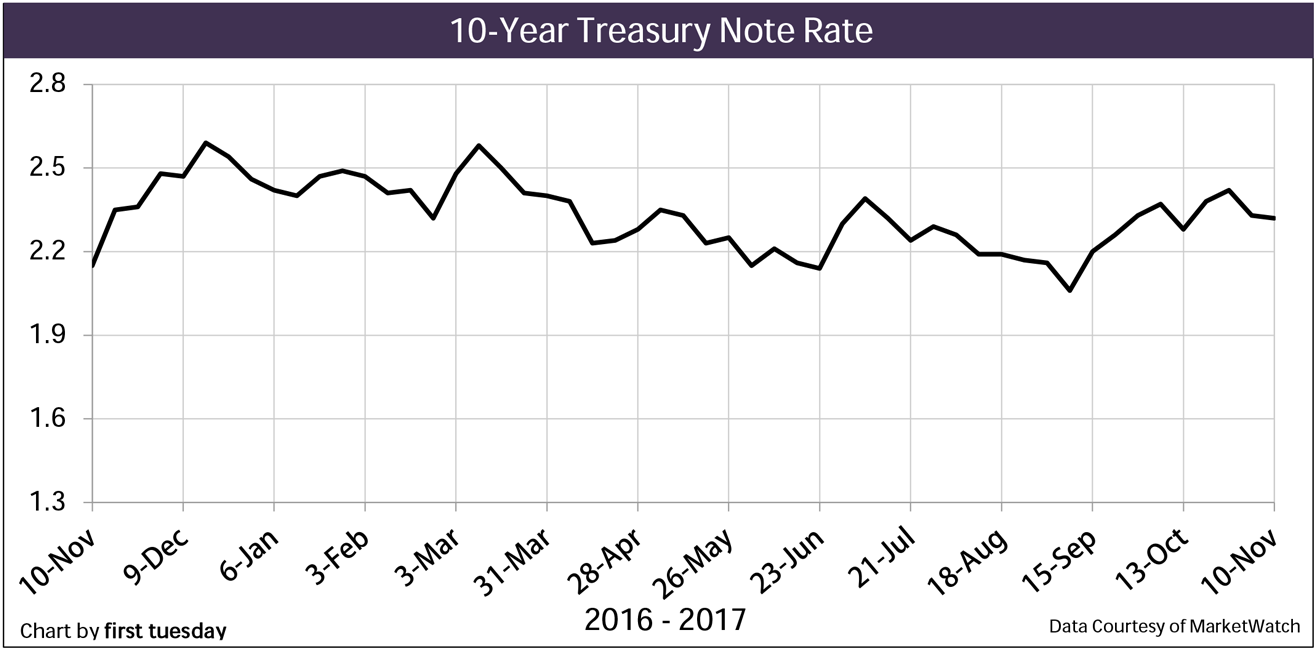 | ||
| Chart update 11/10/17 | ||
Current 11/10/17 2.32% | Month ago 10/13/17 2.28% | Year ago 11/10/16 2.15% |
This rate is a leading indicator of the direction of future Freddie Mac rates. The 10-year rate historically runs closer to 4% during a stable money market. The rate is influenced by worldwide demand for the dollar and anticipated future domestic inflation. | ||
Combined Average 15-, 30-Year Conventional Rates and 10-Year Treasury Note Average
| ||
| Chart update 11/03/17 | ||
Avg 15-Year Oct 2017 3.07% | Avg 30-Year Oct 2017 3.82% | Avg 10-Year T-Note Oct 2017 2.36% |
The average 15- and 30-year conventional commitment rates are the rates at which a lender commits to lend mortgage money in the United States-West/California for the duration of the life of each respective mortgage as reported by Freddie Mac. The green line reflects the 10-Year Treasury Note Average, a leading indicator of the direction of future Freddie Mac rates. It is comprised of the level of worldwide demand for the dollar and anticipated future domestic inflation.
| ||
91-Day Treasury Bill – Average Auction Rate
| ||
| Chart update 10/06/17 | ||
Current 10/05/17 1.05% | Month Ago 09/07/17 1.02% | Year Ago 10/06/16 0.31% |
This rate determines the minimum interest rate the seller must use in a delayed §1031 transaction and report when not receiving interest on §1031 monies held by a facilitator/accommodator. This rate also sets the amount of the ordinary income the facilitator/accommodator must report. | ||
3-Month Treasury Bill
| ||
| Chart update 10/13/17 | ||
Sep 2017 1.03% | Aug 2017 1.01% | Sep 2016 0.29% |
The 3-Month Treasury Bill is the rate managed by the Federal Reserve through the Fed Funds Rate as the base price of borrowing money in the short-term. It is used in determining the yield spread, which predicts the likelihood of a recession one year forward. The posted rate is the monthly average for the listed month. Rates are released with a 1-2 month reporting delay.
| ||
6-Month Treasury Bill
| ||
| Chart update 10/13/17 | ||
Sep 2017 1.15% | Aug 2017 1.11% | Sep 2016 0.46% |
The six-month T-Bill rate is one of several indices used by lenders to periodically adjust the adjustable rate mortgage (ARM) rate. The adjusted rate equals the indexed rate (at the time of adjustment or an average of several prior rates) plus the lender’s profit margin. The posted rate is the monthly average for the listed month. Rates are released with a 1-2 month reporting delay. | ||
Treasury Securities Average Yield — 1-Year Constant Maturity
| ||
| Chart update 10/06/17 | ||
Sep 2017 1.28% | Aug 2017 1.23% | Sep 2016 0.59% |
This index is one of several indexes used by lenders as stated in their ARM note to periodically adjust the note’s interest rate.The ARM interest rate equals T-Bill yield, plus the lender’s profit margin. The index is an average of T-Bill yields with maturities adjusted to one year. | ||
12-Month Treasury Average
| ||
| Chart update 10/13/17 | ||
Sep 2017 1.0% | Aug 2017 0.94% | Sep 2016 0.54% |
This index is one of several indexes used by lenders as stated in their ARM note to periodically adjust the note’s interest rate. This figure is an average of the one-year T-Bill rates for the past 12 months.The ARM interest rate equals the 12-Month Treasury Average yield plus the lender’s profit margin. There is a one-two month lag in data reporting for the 12-Month Treasury Average. | ||
Cost of Funds Index (COFI) (11th FHLBB District)
| ||
| Chart update 08/25/17 | ||
Jul 2017 0.66% | Jun 2017 0.65% | Jul 2016 0.69% |
This index is one of several indexes used by lenders to periodically adjust the interest rate on an ARM note. The ARM interest rate equals Cost of Funds Index, plus the lender’s profit margin. Current index reflects the cost of funds two months’ prior in the United States-West.
| ||
London Inter-Bank Offered Rate
| ||
| Chart update 08/25/17 | ||
1 Month 1.24% | 6 Month 1.46% | 1 Year 1.73% |
This index is one of several indexes used by lenders as stated in their ARM note to periodically adjust the note’s interest rate.The ARM interest rate equals the LIBOR rate plus the lender’s profit margin. The rate is set by the banks in London, England. | ||
Applicable Federal Rates
| ||
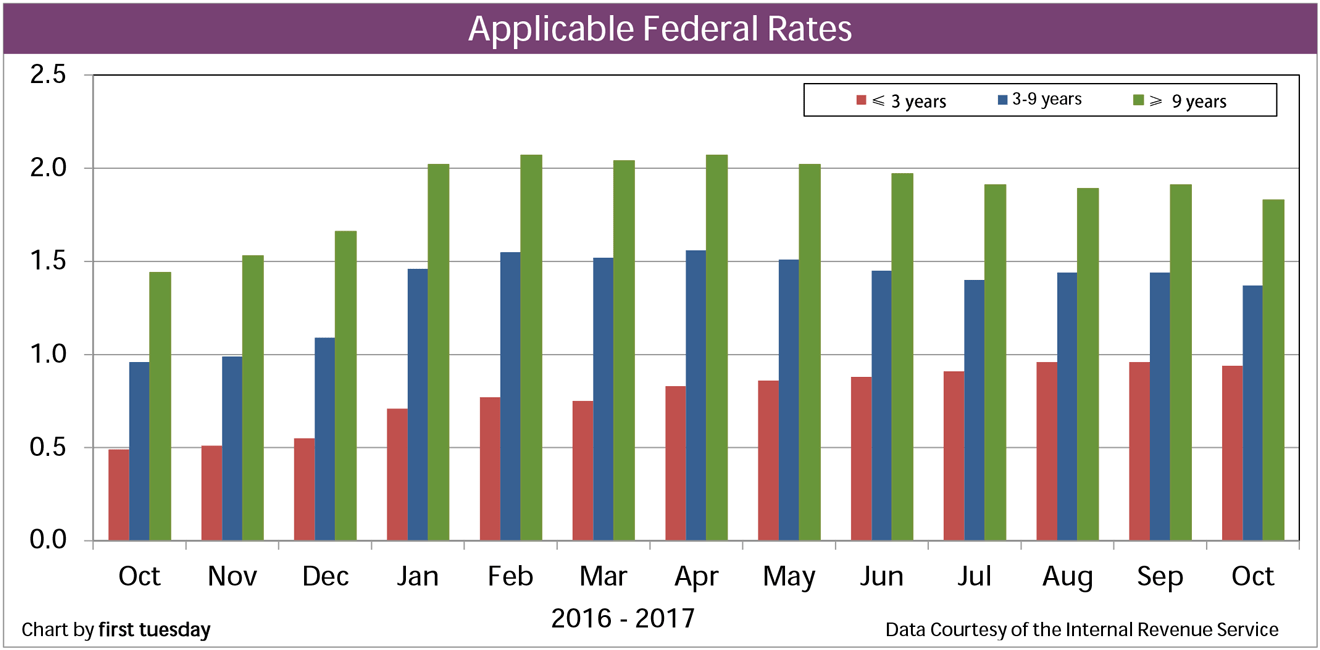
| Chart update 10/06/17 | ||
Short (3 years or less) Oct 2017 0.94% | Medium (3 to 9 years) Oct 2017 1.37% | Long (9+ years) Oct 2017 1.83% |
These rates determine minimum interest yield reportable on carryback financing. The AFR category is determined by the carryback due date. *Rates are for monthly payments.
| ||


| Month* | 6-Month | 1-Year | 2-Year | 3-Year | 5-Year | 7-Year |
| Sep 2017 | 1.17% | 1.28% | 1.38% | 1.51% | 1.80% | 2.03% |
On junior trust deed loans, a margin of 5 – 8% points is added to the Index Figure (Cost-of-Funds Rate) for the maturity date of a Treasury bill equal in length to the payoff date of the loan to set the Section 32 threshold for term limitations. With this in mind, if the percentage of the total loan amount represented by points and fees is greater than the applicable Federal Securities Rate plus ten percentage points, additional disclosures, limitations and prohibitions are triggered by Regulation Z (Reg-Z) Section 32. [See RPI Form 223-1: Points and Fees Test and Form 223: Supplemental Truth-in-Lending Section 32 Disclosure]
| ||||||


